261 E Solomons Way · Manila, UT
Flood risk 1/10 · Minimal
- FEMA flood zone
- —
- Chance of flooding over 30 yrs
- 0.0%
- Est. flood insurance / yr
- —
Fire risk 4/10 · Minor
- Est. fire insurance / yr
- $453 – $841
Heat risk 2/10 · Minimal
- Hot days now (above 89°F)
- 7 days/yr
- Hot days in 30 yrs
- 18 days/yr
Wind risk 1/10 · Minimal
- Chance of severe wind over 30 yrs
- —
Air-quality risk 1/10 · Minimal
- Unhealthy air days now
- 0 days/yr
- Unhealthy air days in 30 yrs
- 0 days/yr
Risk factors via First Street. Map © Google.
Why this score? — see what drove the C grade
The composite is a weighted blend of 9 inputs, each scored 0–100. Each bar is that input's sub-score; the figure is the points it added to the 100-point composite (weight × sub-score).
- Cash flow +19.0/30.0
- ARV discount +7.5/15.0
- DSCR +6.0/10.0
- Appreciation +5.8/10.0
- 1% rule +4.5/10.0
- Schools +4.5/10.0
- Livability +3.1/5.0
- Rent growth +2.5/5.0
- Condition / age +2.5/5.0
$105,000
🖨 Deal sheet 📄 Offer letter ✓ Due diligence
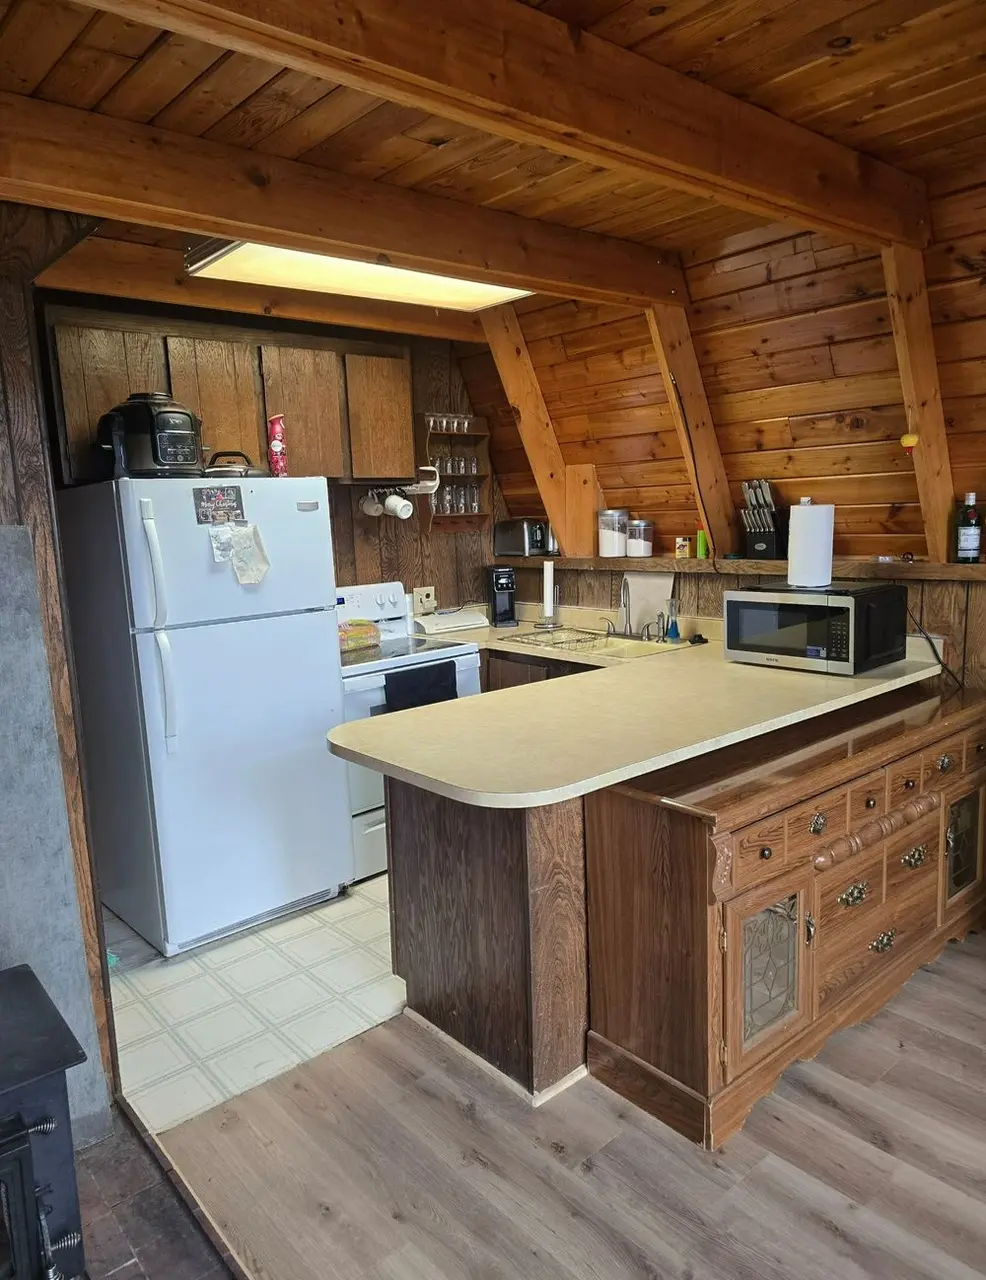
Listing remarks
Cabin located in Manila UT. Built in 1975, mostly everything is still the original, electrical, plumbing, windows, doors, carpet, ect. The bathroom was updated but done fairly poorly and may need to be redone. Carpet in living/dining area was recently ripped out and replaced with hardwood but again not sure of the quality of work and it's not finished, missing edges and trim. There is a part of the inside wall in the living room area that is exposed where a cooling/heating unit was put it years ago as well. Big tear in the laminate in the kitchen, cupboards are in poor condition and the sink is slightly unsealed form the counter and has leaks. This is a fixer upper, sold as is.
Key facts
- 3,049 sq ft lot
- Built 1975
- Listed 15 days
Property features AI
Exterior
- Home design: House
- Construction: 1,008 square feet of living area
- Exterior features: Lot area approximately 3,049 sq. ft.
Neighborhood map
What this means for you Summary
Snapshot
- This is a 2-bed/1.0-bath other listed at $105k.
Deal economics
- At list price, monthly cash flow is $109 ($1k/yr) — positive.
- The deal already cash-flows at list — no discount required.
- To meet the 1% rule (rent ≥ 1% of price), the offer needs to be $100k (4.9% below list).
- Recommended offer: $100k (4.9% below list) — sets the bar for 1% rule.
Location & tenants
- Location reads 61/100 on livability (#221 in UT) — a middle-class / working-renter tenant base. Strengths: employment A+, cost of living A+, crime A; Watch: amenities F, commute F, housing F.
- Daggett District (rural): math 45% / reading 55% proficiency, ranked #44 of 110 in UT (top 40%) — acceptable for families but not a draw, mixed tenant base, ~2y average lease; only 17% free/reduced lunch — higher-income household profile.
- Market conditions: 26 active listings in the ZIP; 18 units permitted in Daggett County in 2024 (0 in 5+ unit buildings).
Forward outlook
- In year one you build about $2k of equity ($726 loan paydown + $2k appreciation (1.5% local appreciation)).
- Daggett County population projected at +16% by 2050 — long-run rental-demand tailwind backs the buy-and-hold thesis.
- At projected returns (1.5% appreciation + 3.0% rent growth), your $29k cash investment doubles in ~7 years — after that, you're playing with house money.
Negotiation context
- It's been on market 15 days — a 2% lower offer ($103k) is reasonable based on typical stale-listing flexibility.
Questions for the listing agent
- Built in 1975 — when were the roof, HVAC, electrical panel, plumbing, and water heater last replaced?
- Is there a deadline driving the sale (1031 exchange, divorce, estate, relocation)? That informs how much negotiation room exists.
- Schools are B-rated — typically a magnet for longer-tenancy family renters. What's the average tenant stay here, and is there a school-zone premium baked into asking?
- What's the average days-on-market for RENTAL listings here right now (not sales)? A rising rental-DOM trend means longer vacancies and softer asking-rent achievability than the comps imply.
- What's the recent tenant-quality profile in this submarket — average credit score on applications, eviction rate, late-payment / NSF rate, and stable-employment percentage? A property-management company in the area should have these aggregated.
- How much new for-sale + rental construction is in the pipeline within 1–3 miles? Heavy new supply typically softens prices + rents 12–24 months out; constrained supply supports both.
Investment metrics
- 1% rule
- 0.95% ✗
- Cap rate
- 7.54%
- Cash-on-cash
- 4.47%
- DSCR
- 1.20
- GRM
- 8.8
CMA / ARV
No comps found within radius.
Projected returns pro-forma
1.52% appreciation · 3.0% rent growth · sell at horizon
- IRR
- 7.5%
- Equity multiple
- 1.40×
- Total profit
- $11,638
- Equity at exit
- $38,738
- IRR
- 11.2%
- Equity multiple
- 2.44×
- Total profit
- $42,195
- Equity at exit
- $53,797
Cash invested: $29,400 (down + closing). Projections, not guarantees.
Landlord ↔ Tenant lean methodology
- Overall (STATE)
- 86 Strongly Landlord-Friendly
- State Utah
- 86 Strongly Landlord-Friendly · R+15
- County
- — inherits STATE
- City
- — inherits STATE
ZIP-level market 84046
- Home prices YoY
- 1.4%
- Active inventory
- 26
- Price-to-rent
- 8.8×
Monthly cashflow live
- Estimated rent
- $999 medium interval (Pro) →
- Mortgage (P&I)
- −$551
- Tax from tax record
- −$85 /mo · $1,024/yr
- Insurance
- −$44
- HOA
- −$0
- Vacancy / Maint / Mgmt
- −$210
- Net cashflow
- $109
Break-even live
UW: 25.0% down · 7.5% · 30yr · 1.5% tax · 5.0% vac · 8.0% maint · 8.0% mgmt
Financing live
Cash to close
- Down payment
- $26,250
- Closing costs
- $3,150
- Reserves months
- —
- Total cash needed
- —
Loan-product check · same deal, 3 products live
Conventional
25% down · 7.5% · 30yr
- Down + closing
- —
- Monthly P&I
- —
- Monthly cashflow
- —
- DSCR
- —
- Eligible?
- —
Personal DTI + credit; lowest rate.
DSCR
20% down · 8.5% · 30yr
- Down + closing
- —
- Monthly P&I
- —
- Monthly cashflow
- —
- DSCR
- —
- Eligible?
- —
No personal income docs; deal must DSCR.
Hard money
10% down · 12.0% · 12mo
- Down + closing
- —
- Monthly P&I
- —
- Monthly cashflow
- —
- DSCR
- —
- Eligible?
- —
Short-term bridge; refi at stabilization.
Listing history 11 events
-
2026-06-19days on market $105,000 Active 15 DOM
-
2026-06-18days on market $105,000 Active 14 DOM
-
2026-06-17days on market $105,000 Active 13 DOM
-
2026-06-16days on market $105,000 Active 12 DOM
-
2026-06-15days on market $105,000 Active 11 DOM
-
2026-06-14days on market $105,000 Active 9 DOM
-
2026-06-12days on market $105,000 Active 8 DOM
-
2026-06-09days on market $105,000 Active 5 DOM
-
2026-06-08days on market $105,000 Active 4 DOM
-
2026-06-07remarks 686-char remark
-
2026-06-07$105,000 Active 3 DOM
ⓘ Source: listings_history table (triggers on properties + properties_extension) + one-shot
backfill from property_details.listing_events for pre-trigger history.
Tax reassessment forecast UT · Resets to sale price
- Current annual tax
- $1,024 · $85/mo
- Projected year-2 tax
- $1,024 · $85/mo
- Expected delta
- $0/yr ($0/mo · 0.0%)
ⓘ Screening estimate from a state-policy table — verify with the county assessor before closing.
Climate risk First Street
- Flood 1/10 Low 0% chance over 30 yrs
- Wildfire 4/10 Moderate
- Heat 2/10 Low 7 d/yr ≥89°F today · 18 d/yr by 30 yrs out
- Wind 1/10 Low
- Air quality 1/10 Low 0 unhealthy d/yr today · 0 by 30 yrs out
Nearby sold comps map
Loading sold comps map…
Walkable amenities ~0.75 mi
Loading nearby amenities…
Taxation est. · year 1
- Rental income
- $11,987
- − Mortgage interest
- −$5,882
- − Property taxes
- −$1,024
- − Insurance
- −$525
- − Repairs & maintenance
- −$959
- − Management
- −$959
- − Depreciation
- −$3,055
- Taxable loss
- −$416
- Est. tax savings @ 24.0%
- +$100
- After-tax cash flow
- $1,413/yr
For passive investors: Depreciation is non-cash, so a rental often shows a tax loss while cash-flowing — sheltering income. Rental losses are passive: they offset passive income freely, and up to $25,000/yr can offset ordinary (W-2) income if you actively participate and your MAGI is under $100k (phasing out to $0 by $150k); unused losses carry forward. On sale, claimed depreciation is recaptured at up to 25%, and gains may owe capital-gains tax (a 1031 exchange can defer both). Figures are a year-1 estimate at your 24.0% rate — not tax advice; consult a CPA.
Schools (NCES district)
- District
- Daggett District
- NCES district ID
- 4900180
- Math proficiency
- 45% ▬ 0.00%
- Reading proficiency
- 55% ▬ 0.00%
- Median HH income
- $51,980
- Composite
- 44.97/100
- National rank
- #5870
- State rank
- #44 of 110 in UT
Livability — Manila
- Score
- 61/100
- State rank
- #221
- US rank
- #18432
Category grades
Schools grade is shown separately in the Schools card above.
Census & demographics
- Census place
- Manila, UT
- Population (ZIP)
- 651
Population outlook (Daggett County) Hauer SSP2
- Today (2025)
- 1,247 people
- By 2030
- 1,302 · +4.4%
- By 2040
- 1,385 · +11.1%
- By 2050
- 1,444 · +15.8%
- By 2075
- 1,541 · +23.6%
- By 2100
- 1,362 · +9.2%
Race, ethnicity, and origin ACS 2023
- Neighborhood character
- Predominantly White (92%)
- Race & ethnicity
- White 92% Two or more races 6% Hispanic / Latino 3% Native American 2%
- Common ancestry
- Slovak 9% Italian 2% Lithuanian 2%
- Foreign-born
- 1% · Canada
- Languages at home
- 97% English-only · Spanish 1%
Political lean MEDSL · Daggett
- 2024 margin
- Solid R (+62.2) · D 18.4% · R 80.5% · Other 1.1%
- 2008→2024 swing
- -24.4pp toward R · 2008: -37.8pp · 2024: -62.2pp
- All cycles
- 2024: R+62.2 2020: R+62.2 2016: R+54.0 2012: R+60.5 2008: R+37.8
Not yet ingested
- Civics
- —
Market trends
- HPI YoY
- ▲ 1.52%
- Current HPI
- 111.1561
- Rent YoY
- —
- Metro
- —
- State GDP YoY
- ▲ 3.54%
- F500 in state
- 2
Industry mix (Fortune 500 HQ in UT)
| Industry | F500 HQs | Revenue |
|---|---|---|
| Financial Services | 1 | $3B |
|
||
Price history
1 event — show timeline
- 2026-06-04 Listed $105,000 ForSaleByOwner.com
Property tax history
+4.7%/yrLatest (2025): $1,024 · +3.4% YoY. Source: county tax records.
Cash-flow waterfall
monthlySold comps — $/sqft
last 12 mo · ≤1 miLoading sold comps…