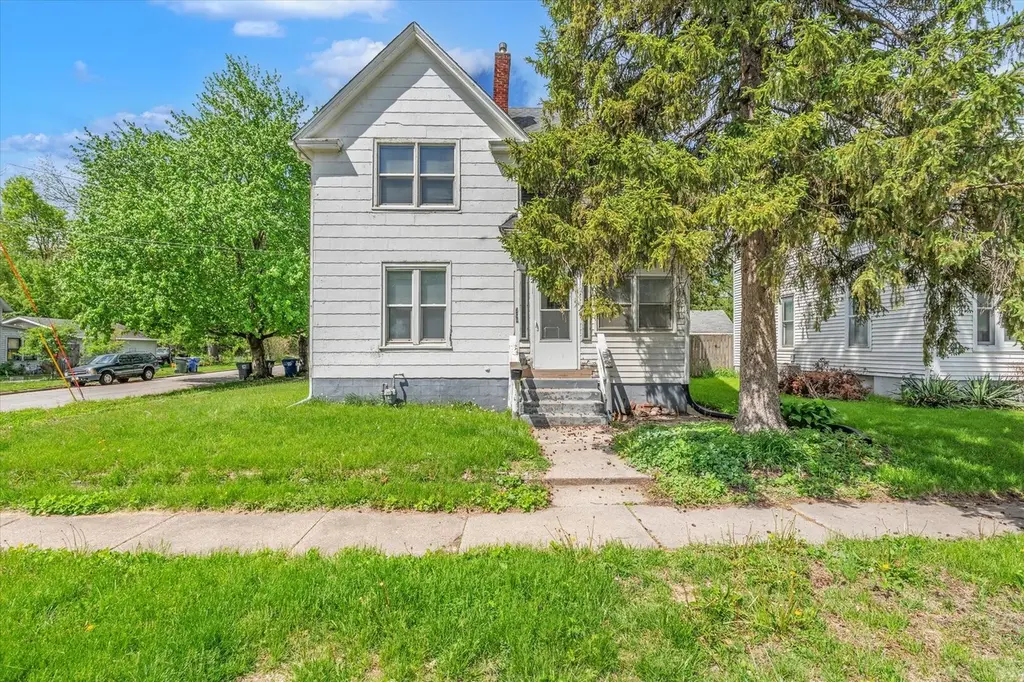
706 N Howell St · Davenport, IA
Flood risk 1/10 · Minimal
- FEMA flood zone
- X (unshaded)
- Chance of flooding over 30 yrs
- 0.0%
- Est. flood insurance / yr
- $473 – $860
Fire risk 1/10 · Minimal
- Est. fire insurance / yr
- $902 – $1,676
Heat risk 3/10 · Minor
- Hot days now (above 103°F)
- 7 days/yr
- Hot days in 30 yrs
- 16 days/yr
Wind risk 2/10 · Minimal
- Chance of severe wind over 30 yrs
- —
Air-quality risk 3/10 · Minor
- Unhealthy air days now
- 2 days/yr
- Unhealthy air days in 30 yrs
- 3 days/yr
Risk factors via First Street. Map © Google.
Why this score? — see what drove the B+ grade
The composite is a weighted blend of 9 inputs, each scored 0–100. Each bar is that input's sub-score; the figure is the points it added to the 100-point composite (weight × sub-score).
- Cash flow +28.7/30.0
- ARV discount +15.0/15.0
- DSCR +10.0/10.0
- 1% rule +8.7/10.0
- Livability +4.0/5.0
- Schools +3.9/10.0
- Rent growth +2.5/5.0
- Condition / age +2.5/5.0
- Appreciation +0.0/10.0
$90,000
🖨 Deal sheet 📄 Offer letter ✓ Due diligence
Listing remarks
Investor opportunity at 706 N Howell! This two-story home offers approximately 1,300 square feet with three bedrooms and one full bathroom. Featuring solid bones and plenty of potential, this property is ready for your personal touch. With some TLC and cosmetic updates, it could shine again-ideal for investors or buyers looking to build equity.
Key facts
- 4,791 sq ft lot
- Garage
- Built 1902
Property features AI
Finance
- Other: Property assessed/reported living area source: assessor; Built before 1978
- HOA & community: No master association fee required
Exterior
- Parking: Detached garage (1 garage space, 1 total parking space)
- Utilities: Public water; Public sewer
- Home design: Detached single-family home; Two-story; Fee simple ownership; Built more than 100 years ago; Shingle-style asphalt roof
- Construction: Block and brick/mortar foundation; Asphalt roof; Approximately 1,384 finished square feet (total finished/unfinished ~2,100 sq ft)
- Exterior features: Corner lot; Lot dimensions approximately 45 x 110; Lot smaller than 0.25 acre
Interior
- Kitchen: Kitchen on main level
- Bedrooms: Three bedrooms (master and two additional bedrooms located on the second floor)
- Flooring: Other flooring throughout
- Bathrooms: One full bathroom
- Heating & cooling: Natural gas heating; Central air conditioning
- Interior features: Five rooms total; Unfinished partial basement
- Laundry & utility: Dedicated laundry room
Neighborhood map
What this means for you Summary
Snapshot
- This is a 3-bed/2.0-bath single-family listed at $90k.
Deal economics
- At list price, monthly cash flow is $301 ($4k/yr) — positive.
- The deal already cash-flows at list — no discount required.
- Meets the 1% rule at list price ($1k rent vs $90k).
- Recommended offer: $87k (3.0% below list) — sets the bar for market timing.
- Cap rate 10.3% vs local median 4.4% in Davenport — top-decile yield for the area; either an underpriced asset or a hidden risk that comps aren't pricing in. Stress-test before assuming the spread holds.
Location & tenants
- Location reads 79/100 on livability (#126 in IA, #2,312 nationally) — a middle-class / working-renter tenant base. Strengths: cost of living A+, housing A+, health & safety A+; Watch: employment C-, crime F.
- Davenport Community School District (urban): math 43% / reading 50% proficiency, ranked #288 of 289 in IA (top 100%) — families likely to look elsewhere, expect single-tenant / working-renter base with shorter leases.
- Market conditions: 68 active listings in the ZIP; 17 comparable units currently listed for rent nearby; rentals at typical pace (median 21d on market — plan ~3-4 weeks tenant-placement turnaround); 47% of comp listings sitting > 30 days — soft ceiling on asking rent; 805 units permitted in Scott County in 2024 (479 in 5+ unit buildings).
Forward outlook
- Local home prices are declining (-3.0%/yr); year-one equity from $622 of loan paydown is wiped out by about $3k of value loss. Plan a longer hold.
- Scott County population projected at +19% by 2050 — long-run rental-demand tailwind backs the buy-and-hold thesis.
- At projected returns (-3.0% appreciation + 3.0% rent growth), your $25k cash investment doubles in ~9 years — after that, you're playing with house money.
Negotiation context
- It's been on market 50 days — a 3% lower offer ($87k) is reasonable based on typical stale-listing flexibility.
- 7 sale attempts since 23y ago; this cycle's ask has dropped $20k (18%) from the opening price — seller is motivated, your offer sets the floor, not the list.
Risks & watch-outs
- Watch-outs: built in 1902 — expect roof / HVAC / electrical / plumbing capex.
Questions for the listing agent
- It's been on market 50 days. Have you received any prior offers? Is the seller open to a 3% concession, seller financing, or rate buy-down credit?
- Built in 1902 — when were the roof, HVAC, electrical panel, plumbing, and water heater last replaced?
- Is there a deadline driving the sale (1031 exchange, divorce, estate, relocation)? That informs how much negotiation room exists.
- Crime grade is F in this area — have there been break-ins, vandalism, or insurance claims at this property in the last 3 years? What carrier currently insures it and at what premium?
- What's the average days-on-market for RENTAL listings here right now (not sales)? A rising rental-DOM trend means longer vacancies and softer asking-rent achievability than the comps imply.
- What's the recent tenant-quality profile in this submarket — average credit score on applications, eviction rate, late-payment / NSF rate, and stable-employment percentage? A property-management company in the area should have these aggregated.
- How much new for-sale + rental construction is in the pipeline within 1–3 miles? Heavy new supply typically softens prices + rents 12–24 months out; constrained supply supports both.
Investment metrics
- 1% rule
- 1.37% ✓
- Cap rate
- 10.30%
- Cash-on-cash
- 14.31%
- DSCR
- 1.64
- GRM
- 6.1
CMA / ARV
- ARV (median comp)
- $115,699
- List price
- $90,000
- Delta
- -22.21%
- Verdict
- UNDERPRICED
- Comps
- 20 within 1.0 mi
Show comp detail 12 sales within ~0.75 mi
| Address | Dist | Beds/Ba | Sqft | Sold | Price | $/sf | Match |
|---|---|---|---|---|---|---|---|
| 1854 W 8th St | 0.12mi | 3/1.0 | 1,417 (+2%) | 2mo | $49,500 | $35 | 85 |
| 2243 W 4th St | 0.47mi | 3/1.5 | 1,408 (+2%) | 0mo | $22,500 | $16 | 73 |
| 1716 W 7th St | 0.25mi | 4/1.0 (+1) | 1,483 (+7%) | 3mo | $63,500 | $43 | 65 |
| 2422 Dugan Ct | 0.67mi | 3/2.0 | 1,364 (-1%) | 3mo | $192,000 | $141 | 64 |
| 314 Washington St | 0.51mi | 3/2.0 | 1,275 (-8%) | 1mo | $109,900 | $86 | 62 |
| 926 Cimarron Dr Dr | 0.44mi | 3/1.5 | 1,478 (+7%) | 5mo | $167,500 | $113 | 62 |
| 2006 Claussen St | 0.54mi | 3/1.5 | 1,253 (-10%) | 5mo | $125,000 | $100 | 53 |
| 2217 W 13th St | 0.46mi | 3/1.0 | 1,200 (-13%) | 2mo | $157,000 | $131 | 51 |
| 1527 N Division St | 0.65mi | 3/1.5 | 1,558 (+13%) | 1mo | $185,000 | $119 | 46 |
| 1219 W 8th St | 0.70mi | 2/2.0 (-1) | 1,260 (-9%) | 2mo | $129,000 | $102 | 46 |
| 2102 W 18th St | 0.74mi | 3/1.0 | 1,236 (-11%) | 1mo | $155,000 | $125 | 42 |
| 435 Waverly Rd | 0.53mi | 3/1.0 | 1,206 (-13%) | 9mo | $123,800 | $103 | 42 |
Match score weights: distance 35% · size 25% · config 20% · recency 20%. Top-matched comps best support the ARV.
Projected returns pro-forma
-3.0% appreciation · 3.0% rent growth · sell at horizon
- IRR
- 4.7%
- Equity multiple
- 1.18×
- Total profit
- $4,611
- Equity at exit
- $13,419
- IRR
- 14.2%
- Equity multiple
- 2.15×
- Total profit
- $28,870
- Equity at exit
- $7,782
Cash invested: $25,200 (down + closing). Projections, not guarantees.
Landlord ↔ Tenant lean methodology
- Overall (STATE)
- 83 Strongly Landlord-Friendly
- State Iowa
- 83 Strongly Landlord-Friendly · R+6
- County
- — inherits STATE
- City
- — inherits STATE
ZIP-level market 52802
- Home prices YoY
- -28.3%
- Active inventory
- 68
- Price-to-rent
- 6.1×
Monthly cashflow live
- Estimated rent
- $1,232 high interval (Pro) →
- Mortgage (P&I)
- −$472
- Tax from tax record
- −$164 /mo · $1,962/yr
- Insurance
- −$38
- HOA
- −$0
- Vacancy / Maint / Mgmt
- −$259
- Net cashflow
- $301
Break-even live
UW: 25.0% down · 7.5% · 30yr · 1.5% tax · 5.0% vac · 8.0% maint · 8.0% mgmt
Financing live
Cash to close
- Down payment
- $22,500
- Closing costs
- $2,700
- Reserves months
- —
- Total cash needed
- —
Loan-product check · same deal, 3 products live
Conventional
25% down · 7.5% · 30yr
- Down + closing
- —
- Monthly P&I
- —
- Monthly cashflow
- —
- DSCR
- —
- Eligible?
- —
Personal DTI + credit; lowest rate.
DSCR
20% down · 8.5% · 30yr
- Down + closing
- —
- Monthly P&I
- —
- Monthly cashflow
- —
- DSCR
- —
- Eligible?
- —
No personal income docs; deal must DSCR.
Hard money
10% down · 12.0% · 12mo
- Down + closing
- —
- Monthly P&I
- —
- Monthly cashflow
- —
- DSCR
- —
- Eligible?
- —
Short-term bridge; refi at stabilization.
Rent comps 17 comps
| Address | Beds | Baths | Sqft | Rent | $/sqft | DOM | Units | Dist |
|---|---|---|---|---|---|---|---|---|
| 1716 W 7th St Davenport, IA | 4.0 | 1.0 | 1278 | $1,712 | $1.34 | 13d | 1 | 0.23mi |
| 1607 W 12th St Davenport, IA | 1.0–2.0 | 1.0 | 800 | $740 | $0.93 | 43d | 3 | 0.41mi |
| 1912 Dixwell St Davenport, IA | 4.0 | 2.0 | 1116 | $1,300 | $1.16 | 43d | 1 | 0.54mi |
| 445 Waverly Rd Davenport, IA | 2.0 | 1.0 | 980 | $1,200 | $1.22 | 43d | 1 | 0.54mi |
| 1455 W 12th St Davenport, IA | 3.0 | 1.0 | 942 | $1,095 | $1.16 | 13d | 1 | 0.56mi |
| 1341 W 4th St Davenport, IA | 3.0 | 1.5 | 979 | $1,394 | $1.42 | 43d | 1 | 0.64mi |
| 1723 W Locust St Davenport, IA | 3.0 | 1.0 | 1690 | $1,395 | $0.83 | 43d | 1 | 0.78mi |
| 510 S Lincoln Ave Davenport, IA | 2.0 | 1.0 | 1184 | $1,195 | $1.01 | 21d | 1 | 0.82mi |
| 301 S Thornwood Ave Davenport, IA | 3.0 | 1.0 | 1242 | $1,395 | $1.12 | 13d | 1 | 0.84mi |
| 730 Brown St Unit 3 Davenport, IA | 2.0 | 1.0 | 1000 | $800 | $0.80 | 43d | 1 | 1.06mi |
| 915 W 14th St Davenport, IA | 3.0 | 1.0 | 1390 | $900 | $0.65 | 43d | 1 | 1.07mi |
| 1318 1/2 Brown St Davenport, IA | 2.0 | 1.0 | 900 | $875 | $0.97 | 21d | 1 | 1.15mi |
| 1315 Brown St Unit 2 Davenport, IA | 3.0 | 1.0 | 1300 | $1,250 | $0.96 | 21d | 1 | 1.17mi |
| 1323 N Gaines St Davenport, IA | 4.0 | 2.0 | 1733 | $1,350 | $0.78 | 21d | 1 | 1.25mi |
| 901 W 15th St Davenport, IA | 1.0–2.0 | 1.0–2.0 | 950 | $895 | $0.94 | 13d | 1 | 1.30mi |
| 621 W 15th St Davenport, IA | 4.0 | 2.0 | 1833 | $1,500 | $0.82 | 13d | 1 | 1.30mi |
| 537 W 16th St Davenport, IA | 3.0 | 1.0 | 1311 | $1,400 | $1.07 | 43d | 1 | 1.37mi |
Listing history 34 events
-
2026-06-18days on market $90,000 Active 50 DOM
-
2026-06-17pricedays on market $90,000 Active 49 DOM
-
2026-06-16days on market $110,000 Active 48 DOM
-
2026-06-15days on market $110,000 Active 47 DOM
-
2026-06-14days on market $110,000 Active 45 DOM
-
2026-06-13days on market $110,000 Active 44 DOM
-
2026-06-10days on market $110,000 Active 42 DOM
-
2026-06-09days on market $110,000 Active 41 DOM
-
2026-06-08days on market $110,000 Active 40 DOM
-
2026-06-07days on market $110,000 Active 39 DOM
-
2026-06-03days on market $110,000 Active 35 DOM
-
2026-06-02days on market $110,000 Active 34 DOM
-
2026-06-01days on market $110,000 Active 33 DOM
-
2026-05-31days on market $110,000 Active 32 DOM
-
2026-05-30days on market $110,000 Active 31 DOM
-
2026-04-29$110,000 Active 346-char remark
-
2021-08-06historical
-
2021-08-06historical
-
2021-08-06historical
-
2018-06-20soldstatus $100,500
-
2018-06-15soldstatus $100,500
-
2018-06-15soldstatus $100,500
-
2018-06-15$100,500
-
2018-06-15$100,500
-
2018-06-04soldstatus $79,000
-
2016-09-07soldstatus $30,500
-
2016-09-07soldstatus $30,500
-
2016-06-01$34,500
-
2016-06-01$34,500
-
2006-08-02soldstatus $59,000
-
2006-07-31soldstatus $58,600
-
2006-03-14$59,900
-
2004-02-27soldstatus $47,000
-
2003-12-30$44,000
ⓘ Source: listings_history table (triggers on properties + properties_extension) + one-shot
backfill from property_details.listing_events for pre-trigger history.
Tax reassessment forecast IA · Partial reset (capped growth)
- Current annual tax
- $1,962 · $164/mo
- Projected year-2 tax
- $1,962 · $164/mo
- Expected delta
- $0/yr ($0/mo · 0.0%)
ⓘ Screening estimate from a state-policy table — verify with the county assessor before closing.
Climate risk First Street
- Flood 1/10 Low FEMA zone X (unshaded) · 0% chance over 30 yrs
- Wildfire 1/10 Low
- Heat 3/10 Moderate 7 d/yr ≥103°F today · 16 d/yr by 30 yrs out
- Wind 2/10 Low
- Air quality 3/10 Moderate 2 unhealthy d/yr today · 3 by 30 yrs out
Nearby sold comps map
Loading sold comps map…
Walkable amenities ~0.75 mi
Loading nearby amenities…
Taxation est. · year 1
- Rental income
- $14,788
- − Mortgage interest
- −$5,041
- − Property taxes
- −$1,962
- − Insurance
- −$450
- − Repairs & maintenance
- −$1,183
- − Management
- −$1,183
- − Depreciation
- −$2,618
- Taxable income
- $2,351
- Est. tax owed @ 24.0%
- −$564
- After-tax cash flow
- $3,043/yr
For passive investors: Depreciation is non-cash, so a rental often shows a tax loss while cash-flowing — sheltering income. Rental losses are passive: they offset passive income freely, and up to $25,000/yr can offset ordinary (W-2) income if you actively participate and your MAGI is under $100k (phasing out to $0 by $150k); unused losses carry forward. On sale, claimed depreciation is recaptured at up to 25%, and gains may owe capital-gains tax (a 1031 exchange can defer both). Figures are a year-1 estimate at your 24.0% rate — not tax advice; consult a CPA.
Schools (NCES district)
- District
- Davenport Community School District
- NCES district ID
- 1908580
- Math proficiency
- 43% ▼ -11.00%
- Reading proficiency
- 50% ▼ -3.00%
- Median HH income
- $46,157
- Composite
- 39.49/100
- National rank
- #3951
- State rank
- #288 of 289 in IA
Livability — Davenport
- Score
- 79/100
- State rank
- #126
- US rank
- #2312
Category grades
Schools grade is shown separately in the Schools card above.
Census & demographics
- Census place
- Davenport, IA
- County
- Scott County · 144,583 people
- City population
- 103,319
- Metro
- Davenport-Moline-Rock Island, IA-IL
- Population (ZIP)
- 9,466
- Household income
- $54,380
- Rent vs Own
- Severe rent burden
- 244.0
Population outlook (Scott County) Hauer SSP2
- Today (2025)
- 188,878 people
- By 2030
- 196,648 · +4.1%
- By 2040
- 210,860 · +11.6%
- By 2050
- 224,359 · +18.8%
- By 2075
- 258,884 · +37.1%
- By 2100
- 286,447 · +51.7%
Race, ethnicity, and origin ACS 2023
- Neighborhood character
- Predominantly White (71%)
- Race & ethnicity
- White 71% Hispanic / Latino 14% Two or more races 10% Black 5% Asian 1%
- Hispanic origin (detail)
- Mexican 13%
- Common ancestry
- Romanian 2% Lithuanian 1% Italian 1%
- Foreign-born
- 4% · Canada, Vietnam
- Languages at home
- 92% English-only · Spanish 7%
Political lean MEDSL · Scott
- 2024 margin
- Toss-up / Even · D 47.3% · R 51.2% · Other 1.4%
- 2008→2024 swing
- -18.4pp toward R · 2008: 14.6pp · 2024: -3.9pp
- All cycles
- 2024: R+3.9 2020: D+3.5 2016: D+1.4 2012: D+13.8 2008: D+14.6
Not yet ingested
- Civics
- —
Market trends
- HPI YoY
- ▼ -59.59%
- Current HPI
- 151.2076
- Rent YoY
- —
- Metro
- Davenport-Moline-Rock Island, IA-IL
- State GDP YoY
- ▲ 2.48%
- F500 in state
- 4
Industry mix (Fortune 500 HQ in IA)
| Industry | F500 HQs | Revenue |
|---|---|---|
| Financial Services | 1 | $16B |
|
||
| Retail / Convenience | 1 | $15B |
|
||
Price history
+104.5% since first listed20 events — show timeline
- 2026-06-16 Price Changed $90,000 MRED as Distributed by MLS Grid
- 2026-04-29 Listed $110,000 MRED as Distributed by MLS Grid
- 2021-08-06 Listing Removed — RMLSA as Distributed by MLS Grid
- 2021-08-06 Listing Removed — RMLSA as Distributed by MLS Grid
- 2021-08-06 Listing Removed — RMLSA as Distributed by MLS Grid
- 2018-06-20 Sold (Public Records) $100,500 Public Records
- 2018-06-15 Listed $100,500 RMLSA as Distributed by MLS Grid
- 2018-06-15 Listed $100,500 MRED as Distributed by MLS Grid
- 2018-06-15 Sold (MLS) $100,500 RMLSA as Distributed by MLS Grid
- 2018-06-15 Sold (MLS) $100,500 MRED as Distributed by MLS Grid
- 2018-06-04 Sold (Public Records) $79,000 Public Records
- 2016-09-07 Sold (MLS) $30,500 RMLSA as Distributed by MLS Grid
- 2016-09-07 Sold (MLS) $30,500 MRED as Distributed by MLS Grid
- 2016-06-01 Listed $34,500 RMLSA as Distributed by MLS Grid
- 2016-06-01 Listed $34,500 MRED as Distributed by MLS Grid
- 2006-08-02 Sold (Public Records) $59,000 Public Records
- 2006-07-31 Sold (MLS) $58,600 RMLSA as Distributed by MLS Grid
- 2006-03-14 Listed $59,900 RMLSA as Distributed by MLS Grid
- 2004-02-27 Sold (MLS) $47,000 RMLSA as Distributed by MLS Grid
- 2003-12-30 Listed $44,000 RMLSA as Distributed by MLS Grid
Property tax history
+4.3%/yrLatest (2025): $1,962 · -8.1% YoY. Source: county tax records.
Cash-flow waterfall
monthlySold comps — $/sqft
last 12 mo · ≤1 miLoading sold comps…