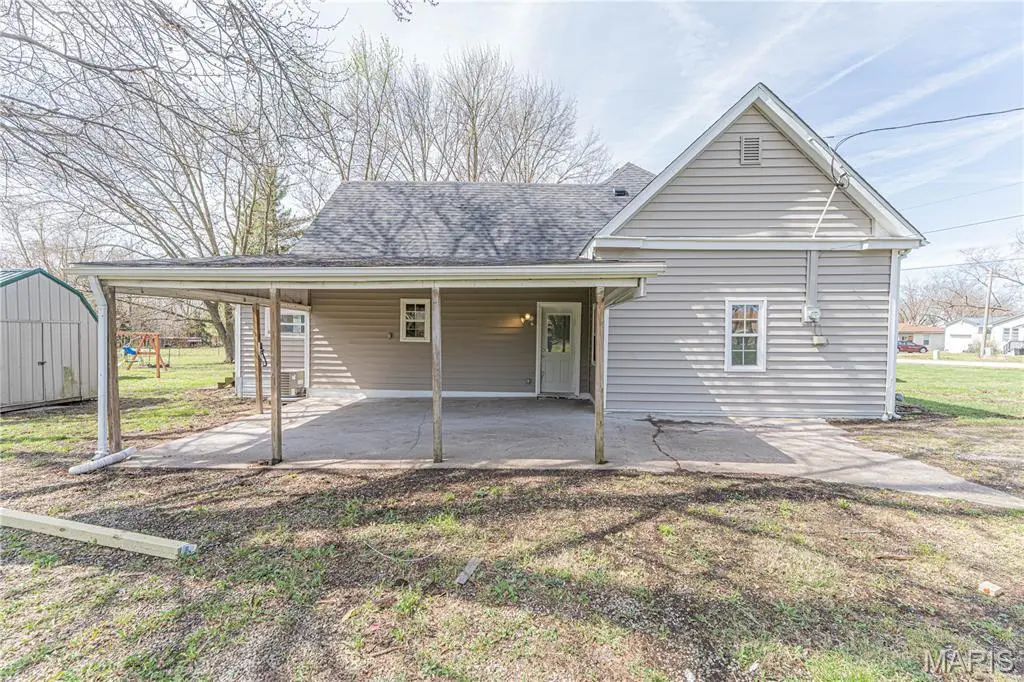
202 W Canada St · Sturgeon, MO
Flood risk No data
- FEMA flood zone
- —
- Chance of flooding over 30 yrs
- —
- Est. flood insurance / yr
- —
Fire risk No data
- Est. fire insurance / yr
- —
Heat risk No data
- Hot days now (above threshold)
- —
- Hot days in 30 yrs
- —
Wind risk No data
- Chance of severe wind over 30 yrs
- —
Air-quality risk No data
- Unhealthy air days now
- —
- Unhealthy air days in 30 yrs
- —
Risk factors via First Street. Map © Google.
Why this score? — see what drove the B- grade
The composite is a weighted blend of 9 inputs, each scored 0–100. Each bar is that input's sub-score; the figure is the points it added to the 100-point composite (weight × sub-score).
- Cash flow +20.5/30.0
- ARV discount +15.0/15.0
- Appreciation +10.0/10.0
- DSCR +6.5/10.0
- 1% rule +4.3/10.0
- Livability +3.4/5.0
- Schools +3.0/10.0
- Rent growth +2.5/5.0
- Condition / age +2.5/5.0
$130,000
🖨 Deal sheet 📄 Offer letter ✓ Due diligence
Listing remarks MLS
This is now active! Fresh paint and laminate flooring. New shingles on the roof. Home inspection in hand - will need work on the crawlspace so it is being sold as-is at a new price of 130K. Prefer cash or conventional financing.
Key facts
- 0.6 acre lot
- Built 1920
- Listed 30 days
Neighborhood map
What this means for you Summary
Snapshot
- This is a 3-bed/2.0-bath single-family listed at $130k.
Deal economics
- At list price, monthly cash flow is $172 ($2k/yr) — positive.
- The deal already cash-flows at list — no discount required.
- To meet the 1% rule (rent ≥ 1% of price), the offer needs to be $121k (7.1% below list).
- Recommended offer: $121k (7.1% below list) — sets the bar for 1% rule.
Location & tenants
- Location reads 68/100 on livability (#183 in MO) — a middle-class / working-renter tenant base. Strengths: cost of living A+, housing A+, crime A; Watch: amenities F, commute F, health & safety F.
- Sturgeon R-V (rural): math 22% / reading 46% proficiency, ranked #212 of 324 in MO (top 65%) — families likely to look elsewhere, expect single-tenant / working-renter base with shorter leases.
- Market conditions: 79 active listings in the ZIP; 1,303 units permitted in Boone County in 2024 (549 in 5+ unit buildings).
Forward outlook
- In year one you build about $14k of equity ($899 loan paydown + $13k appreciation (10.0% local appreciation)).
- Boone County population projected at +36% by 2050 — long-run rental-demand tailwind backs the buy-and-hold thesis.
- At projected returns (10.0% appreciation + 3.0% rent growth), your $36k cash investment doubles in ~3 years — after that, you're playing with house money.
- By year 3, paydown + projected appreciation supports a ~$35k cash-out refi (75% LTV) — recoverable capital for the next deal without selling this one.
Negotiation context
- It's been on market 30 days — a 2% lower offer ($128k) is reasonable based on typical stale-listing flexibility.
- 6 sale attempts since 7y ago; this cycle's ask has dropped $20k (13%) from the opening price — seller is motivated, your offer sets the floor, not the list.
Risks & watch-outs
- Watch-outs: built in 1920 — expect roof / HVAC / electrical / plumbing capex.
Questions for the listing agent
- Built in 1920 — when were the roof, HVAC, electrical panel, plumbing, and water heater last replaced?
- Is there a deadline driving the sale (1031 exchange, divorce, estate, relocation)? That informs how much negotiation room exists.
- What's the average days-on-market for RENTAL listings here right now (not sales)? A rising rental-DOM trend means longer vacancies and softer asking-rent achievability than the comps imply.
- What's the recent tenant-quality profile in this submarket — average credit score on applications, eviction rate, late-payment / NSF rate, and stable-employment percentage? A property-management company in the area should have these aggregated.
- How much new for-sale + rental construction is in the pipeline within 1–3 miles? Heavy new supply typically softens prices + rents 12–24 months out; constrained supply supports both.
Investment metrics
- 1% rule
- 0.93% ✗
- Cap rate
- 7.88%
- Cash-on-cash
- 5.68%
- DSCR
- 1.25
- GRM
- 9.0
CMA / ARV
- ARV (median comp)
- $230,215
- List price
- $130,000
- Delta
- -43.53%
- Verdict
- UNDERPRICED
- Comps
- 20 within 1.0 mi
Show comp detail 12 sales within ~0.75 mi
| Address | Dist | Beds/Ba | Sqft | Sold | Price | $/sf | Match |
|---|---|---|---|---|---|---|---|
| 307 E Mcdowell St | 0.31mi | 3/2.0 | 1,650 (+2%) | 14mo | $298,900 | $181 | 71 |
| 23365 N Lark Song Ln | 0.57mi | 3/2.0 | 1,673 (+3%) | 4mo | $390,000 | $233 | 65 |
| 311 W Francis St | 0.68mi | 3/2.0 | 1,591 (-2%) | 7mo | $339,900 | $214 | 59 |
| 23330 N Tumbleweed Ln | 0.64mi | 3/2.5 | 1,700 (+5%) | 4mo | $449,000 | $264 | 57 |
| 412 W Jaxon St | 0.74mi | 3/2.0 | 1,534 (-6%) | 1mo | $349,900 | $228 | 56 |
| 301 W Francis St | 0.68mi | 3/2.0 | 1,501 (-8%) | 2mo | $318,000 | $212 | 54 |
| 307 W Harris St | 0.46mi | 4/2.0 (+1) | 1,756 (+8%) | 8mo | $249,000 | $142 | 54 |
| 415 W Francis St | 0.71mi | 3/2.0 | 1,672 (+3%) | 11mo | $364,900 | $218 | 53 |
| 202 N Fairgrounds Rd | 0.42mi | 3/2.0 | 1,402 (-14%) | 8mo | $299,900 | $214 | 51 |
| 307 W Francis St | 0.68mi | 3/2.0 | 1,534 (-6%) | 12mo | $337,900 | $220 | 49 |
| 412 N Ogden St | 0.55mi | 3/2.0 | 1,380 (-15%) | 3mo | $277,900 | $201 | 47 |
| 409 W Smith St | 0.42mi | 3/2.0 | 1,400 (-14%) | 15mo | $283,900 | $203 | 45 |
Match score weights: distance 35% · size 25% · config 20% · recency 20%. Top-matched comps best support the ARV.
Projected returns pro-forma
10.0% appreciation · 3.0% rent growth · sell at horizon
- IRR
- 28.4%
- Equity multiple
- 3.24×
- Total profit
- $81,715
- Equity at exit
- $117,114
- IRR
- 24.7%
- Equity multiple
- 7.37×
- Total profit
- $231,907
- Equity at exit
- $252,561
Cash invested: $36,400 (down + closing). Projections, not guarantees.
Landlord ↔ Tenant lean methodology
- Overall (STATE)
- 81 Strongly Landlord-Friendly
- State Missouri
- 81 Strongly Landlord-Friendly · R+10
- County
- — inherits STATE
- City
- — inherits STATE
ZIP-level market 65284
- Home prices YoY
- 8.3%
- Active inventory
- 79
- Price-to-rent
- 9.0×
Monthly cashflow live
- Estimated rent
- $1,208 medium interval (Pro) →
- Mortgage (P&I)
- −$682
- Tax from tax record
- −$46 /mo · $556/yr
- Insurance
- −$54
- HOA
- −$0
- Vacancy / Maint / Mgmt
- −$254
- Net cashflow
- $172
Break-even live
UW: 25.0% down · 7.5% · 30yr · 1.5% tax · 5.0% vac · 8.0% maint · 8.0% mgmt
Financing live
Cash to close
- Down payment
- $32,500
- Closing costs
- $3,900
- Reserves months
- —
- Total cash needed
- —
Loan-product check · same deal, 3 products live
Conventional
25% down · 7.5% · 30yr
- Down + closing
- —
- Monthly P&I
- —
- Monthly cashflow
- —
- DSCR
- —
- Eligible?
- —
Personal DTI + credit; lowest rate.
DSCR
20% down · 8.5% · 30yr
- Down + closing
- —
- Monthly P&I
- —
- Monthly cashflow
- —
- DSCR
- —
- Eligible?
- —
No personal income docs; deal must DSCR.
Hard money
10% down · 12.0% · 12mo
- Down + closing
- —
- Monthly P&I
- —
- Monthly cashflow
- —
- DSCR
- —
- Eligible?
- —
Short-term bridge; refi at stabilization.
Listing history 16 events
-
2026-04-24status Active 230-char remark
Show marketing remark (230 chars)
This is now active! Fresh paint and laminate flooring. New shingles on the roof. Home inspection in hand - will need work on the crawlspace so it is being sold as-is at a new price of 130K. Prefer cash or conventional financing.
-
2026-04-24price $130,000 230-char remark
Show marketing remark (230 chars)
This is now active! Fresh paint and laminate flooring. New shingles on the roof. Home inspection in hand - will need work on the crawlspace so it is being sold as-is at a new price of 130K. Prefer cash or conventional financing.
-
2026-04-06status Pending 230-char remark
Show marketing remark (230 chars)
This is now active! Fresh paint and laminate flooring. New shingles on the roof. Home inspection in hand - will need work on the crawlspace so it is being sold as-is at a new price of 130K. Prefer cash or conventional financing.
-
2026-04-03$150,000 Active 230-char remark
Show marketing remark (230 chars)
This is now active! Fresh paint and laminate flooring. New shingles on the roof. Home inspection in hand - will need work on the crawlspace so it is being sold as-is at a new price of 130K. Prefer cash or conventional financing.
-
2026-03-29historical $150,000 230-char remark
Show marketing remark (230 chars)
This is now active! Fresh paint and laminate flooring. New shingles on the roof. Home inspection in hand - will need work on the crawlspace so it is being sold as-is at a new price of 130K. Prefer cash or conventional financing.
-
2026-02-09status Active
-
2026-01-22status Pending
-
2025-12-05price $149,900
-
2025-07-22price $159,900
-
2025-06-30$160,500 Active
-
2021-04-16soldstatus
-
2021-03-02$139,900
-
2019-07-31soldstatus
-
2019-07-05$119,900
-
2011-12-05soldstatus
-
2008-12-08soldstatus
ⓘ Source: listings_history table (triggers on properties + properties_extension) + one-shot
backfill from property_details.listing_events for pre-trigger history.
Tax reassessment forecast MO · Resets to sale price
- Current annual tax
- $556 · $46/mo
- Projected year-2 tax
- $1,261 · $105/mo
- Expected delta
- +$705/yr (+$59/mo · 127.0%)
ⓘ Screening estimate from a state-policy table — verify with the county assessor before closing.
Nearby sold comps map
Loading sold comps map…
Walkable amenities ~0.75 mi
Loading nearby amenities…
Taxation est. · year 1
- Rental income
- $14,497
- − Mortgage interest
- −$7,282
- − Property taxes
- −$556
- − Insurance
- −$650
- − Repairs & maintenance
- −$1,160
- − Management
- −$1,160
- − Depreciation
- −$3,782
- Taxable loss
- −$92
- Est. tax savings @ 24.0%
- +$22
- After-tax cash flow
- $2,088/yr
For passive investors: Depreciation is non-cash, so a rental often shows a tax loss while cash-flowing — sheltering income. Rental losses are passive: they offset passive income freely, and up to $25,000/yr can offset ordinary (W-2) income if you actively participate and your MAGI is under $100k (phasing out to $0 by $150k); unused losses carry forward. On sale, claimed depreciation is recaptured at up to 25%, and gains may owe capital-gains tax (a 1031 exchange can defer both). Figures are a year-1 estimate at your 24.0% rate — not tax advice; consult a CPA.
Schools (NCES district)
- District
- Sturgeon R-V
- NCES district ID
- 2929700
- Math proficiency
- 22% ▼ -16.00%
- Reading proficiency
- 46% ▼ -7.00%
- Median HH income
- $54,851
- Composite
- 29.89/100
- National rank
- #6396
- State rank
- #212 of 324 in MO
Livability — Sturgeon
- Score
- 68/100
- State rank
- #183
- US rank
- #9697
Category grades
Schools grade is shown separately in the Schools card above.
Census & demographics
- Census place
- Sturgeon, MO
- Population (ZIP)
- 2,172
Population outlook (Boone County) Hauer SSP2
- Today (2025)
- 202,891 people
- By 2030
- 217,799 · +7.3%
- By 2040
- 246,789 · +21.6%
- By 2050
- 276,116 · +36.1%
- By 2075
- 348,426 · +71.7%
- By 2100
- 400,856 · +97.6%
Race, ethnicity, and origin ACS 2023
- Neighborhood character
- Predominantly White (90%)
- Race & ethnicity
- White 90% Hispanic / Latino 5% Two or more races 5%
- Hispanic origin (detail)
- Mexican 4%
- Common ancestry
- Russian 2% Lithuanian 2% Italian 2%
- Foreign-born
- 2% · Canada, Dominican Republic
- Languages at home
- 96% English-only · German/W. Germanic 2% Spanish 2%
Political lean MEDSL · Boone
- 2024 margin
- Lean D (+9.8) · D 53.9% · R 44.1% · Other 2.1%
- 2008→2024 swing
- -2.2pp toward R · 2008: 12.0pp · 2024: 9.8pp
- All cycles
- 2024: D+9.8 2020: D+12.5 2016: D+5.9 2012: D+3.1 2008: D+12.0
Not yet ingested
- Civics
- —
Market trends
- HPI YoY
- ▲ 24.55%
- Current HPI
- 321.3924
- Rent YoY
- —
- Metro
- —
- State GDP YoY
- ▲ 1.84%
- F500 in state
- 20
Industry mix (Fortune 500 HQ in MO)
| Industry | F500 HQs | Revenue |
|---|---|---|
| Healthcare | 1 | $163B |
|
||
| Insurance | 1 | $21B |
|
||
| Industrial Technology | 1 | $17B |
|
||
| Retail | 1 | $16B |
|
||
| Industrial Distribution | 1 | $10B |
|
||
| Utilities | 1 | $9B |
|
||
Price history
+8.4% since first listed16 events — show timeline
- 2026-04-24 Relisted — MARIS as Distributed by MLS Grid
- 2026-04-24 Price Changed $130,000 MARIS as Distributed by MLS Grid
- 2026-04-06 Pending — MARIS as Distributed by MLS Grid
- 2026-04-03 Listed $150,000 MARIS as Distributed by MLS Grid
- 2026-03-29 Coming Soon $150,000 MARIS as Distributed by MLS Grid
- 2026-02-09 Relisted — CBORMLS
- 2026-01-22 Pending — CBORMLS
- 2025-12-05 Price Changed $149,900 CBORMLS
- 2025-07-22 Price Changed $159,900 CBORMLS
- 2025-06-30 Listed $160,500 CBORMLS
- 2021-04-16 Sold (MLS) — CBORMLS
- 2021-03-02 Listed $139,900 CBORMLS
- 2019-07-31 Sold (MLS) — CBORMLS
- 2019-07-05 Listed $119,900 CBORMLS
- 2011-12-05 Sold (Public Records) — Public Records
- 2008-12-08 Sold (Public Records) — Public Records
Property tax history
+5.6%/yrLatest (2025): $556 · +42.5% YoY. Source: county tax records.
Cash-flow waterfall
monthlySold comps — $/sqft
last 12 mo · ≤1 miLoading sold comps…