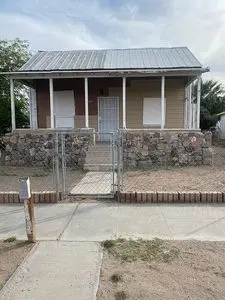
1215 Front St · Needles, CA
Flood risk 1/10 · Minimal
- FEMA flood zone
- X (unshaded)
- Chance of flooding over 30 yrs
- 0.0%
- Est. flood insurance / yr
- $507 – $1,088
Fire risk 4/10 · Minor
- Est. fire insurance / yr
- $659 – $1,223
Heat risk 9/10 · Severe
- Hot days now (above 116°F)
- 7 days/yr
- Hot days in 30 yrs
- 16 days/yr
Wind risk 1/10 · Minimal
- Chance of severe wind over 30 yrs
- —
Air-quality risk 1/10 · Minimal
- Unhealthy air days now
- 0 days/yr
- Unhealthy air days in 30 yrs
- 0 days/yr
Risk factors via First Street. Map © Google.
Why this score? — see what drove the B- grade
The composite is a weighted blend of 9 inputs, each scored 0–100. Each bar is that input's sub-score; the figure is the points it added to the 100-point composite (weight × sub-score).
- Cash flow +28.3/30.0
- DSCR +10.0/10.0
- ARV discount +7.5/15.0
- 1% rule +7.3/10.0
- Appreciation +5.8/10.0
- Livability +3.1/5.0
- Rent growth +2.5/5.0
- Condition / age +2.5/5.0
- Schools +2.3/10.0
$65,000
🖨 Deal sheet (PDF) 📄 Offer letter ✓ Due diligence
Listing remarks MLS
3 bedroom 1 bath fixer uper
Key facts
- Garage
- Built 1905
- Listed 24 days
Neighborhood map
What this means for you Summary
Snapshot
- This is a 3-bed/1.0-bath single-family listed at $65k.
Deal economics
- At list price, monthly cash flow is $208 ($2k/yr) — positive.
- The deal already cash-flows at list — no discount required.
- Meets the 1% rule at list price ($800 rent vs $65k).
- Recommended offer: $64k (1.5% below list) — sets the bar for market timing.
- Cap rate 10.1% vs local median 5.1% in Needles — top-decile yield for the area; either an underpriced asset or a hidden risk that comps aren't pricing in. Stress-test before assuming the spread holds.
Location & tenants
- Location reads 62/100 on livability (#492 in CA) — a middle-class / working-renter tenant base. Strengths: commute A+, cost of living A+, housing A+; Watch: health & safety C-, crime F, amenities F.
- Needles Unified (town): math 22% / reading 28% proficiency, ranked #1,194 of 1,400 in CA (top 85%) — low school quality limits family demand, transient renter base, plan for 1-2y turnover; 68% free/reduced lunch — lower-income household profile, screen leases tightly.
- Zoned schools: Needles Middle (math 12% / reading 27%, grade F, #419 of 498 statewide, top 85%, 192 students, 80% FRL).
- Market conditions: 161 active listings in the ZIP; 1 comparable units currently listed for rent nearby; 5,458 units permitted in San Bernardino County in 2024 (1,500 in 5+ unit buildings).
Forward outlook
- In year one you build about $2k of equity ($449 loan paydown + $1k appreciation (1.6% local appreciation)).
- San Bernardino County population projected at +15% by 2050 — modest demand growth; plan on rents tracking national, not racing it.
- At projected returns (1.6% appreciation + 3.0% rent growth), your $18k cash investment doubles in ~5 years — after that, you're playing with house money.
Negotiation context
- It's been on market 24 days — a 2% lower offer ($64k) is reasonable based on typical stale-listing flexibility.
- 7 sale attempts since 2y ago with the ask held roughly flat each time — persistent listings suggest the price (not the market) is what's stuck; bring a comps-based counter.
- Current owner paid $35k; list at $65k implies a 86% gain — meaningful room to come down on a strong offer.
Risks & watch-outs
- Watch-outs: built in 1905 — expect roof / HVAC / electrical / plumbing capex.
- Climate carrying-cost: extreme-heat days projected 7→16/yr by 2055 (HVAC capex compounding) — expect insurance premiums to compound above CPI over the hold.
Questions for the listing agent
- Built in 1905 — when were the roof, HVAC, electrical panel, plumbing, and water heater last replaced?
- Is there a deadline driving the sale (1031 exchange, divorce, estate, relocation)? That informs how much negotiation room exists.
- Schools are D-rated, which usually means shorter tenancies and higher turnover. Who's the typical renter profile here, and what's been the actual vacancy rate?
- Crime grade is F in this area — have there been break-ins, vandalism, or insurance claims at this property in the last 3 years? What carrier currently insures it and at what premium?
- What's the average days-on-market for RENTAL listings here right now (not sales)? A rising rental-DOM trend means longer vacancies and softer asking-rent achievability than the comps imply.
- What's the recent tenant-quality profile in this submarket — average credit score on applications, eviction rate, late-payment / NSF rate, and stable-employment percentage? A property-management company in the area should have these aggregated.
- How much new for-sale + rental construction is in the pipeline within 1–3 miles? Heavy new supply typically softens prices + rents 12–24 months out; constrained supply supports both.
Investment metrics
- 1% rule
- 1.23% ✓
- Cap rate
- 10.13%
- Cash-on-cash
- 13.72%
- DSCR
- 1.61
- GRM
- 6.8
CMA / ARV
- ARV (on-the-fly)
- $35,148
- Comps found
- 1
Show comp detail 1 sale within ~0.75 mi
| Address | Dist | Beds/Ba | Sqft | Sold | Price | $/sf | Match |
|---|---|---|---|---|---|---|---|
| 1215 Front St | 0.00mi | 3/1.0 | 606 (0%) | 12mo | $35,000 | $58 | 90 |
Match score weights: distance 35% · size 25% · config 20% · recency 20%. Top-matched comps best support the ARV.
Projected returns pro-forma
1.64% appreciation · 3.0% rent growth · sell at horizon
- IRR
- 17.2%
- Equity multiple
- 1.91×
- Total profit
- $16,536
- Equity at exit
- $24,397
- IRR
- 19.8%
- Equity multiple
- 3.54×
- Total profit
- $46,276
- Equity at exit
- $34,203
Cash invested: $18,200 (down + closing). Projections, not guarantees.
Landlord ↔ Tenant lean methodology
- Overall (STATE)
- 18 Strongly Tenant-Friendly
- State California
- 18 Strongly Tenant-Friendly · D+13
- County
- — inherits STATE
- City
- — inherits STATE
ZIP-level market 92363
- Home prices YoY
- 0.6%
- Active inventory
- 161
- Price-to-rent
- 6.8×
Monthly cashflow live
- Estimated rent
- $800 medium interval (Pro) →
- Mortgage (P&I)
- −$341
- Tax from tax record
- −$56 /mo · $672/yr
- Insurance
- −$27
- HOA
- −$0
- Vacancy / Maint / Mgmt
- −$168
- Net cashflow
- $208
Break-even live
Sensitivity live
| Price | -10% $245 | -5% $226 | +0% $208 | +5% $190 | +10% $171 |
|---|---|---|---|---|---|
| Rent | -10% $145 | -5% $176 | +0% $208 | +5% $240 | +10% $271 |
| Rate | -1.0pp $241 | -0.5pp $225 | base $208 | +0.5pp $191 | +1.0pp $174 |
UW: 25.0% down · 7.5% · 30yr · 1.5% tax · 5.0% vac · 8.0% maint · 8.0% mgmt
Financing live
Cash to close
- Down payment
- $16,250
- Closing costs
- $1,950
- Reserves months
- —
- Total cash needed
- —
Loan-product check · same deal, 3 products live
Conventional
25% down · 7.5% · 30yr
- Down + closing
- —
- Monthly P&I
- —
- Monthly cashflow
- —
- DSCR
- —
- Eligible?
- —
Personal DTI + credit; lowest rate.
DSCR
20% down · 8.5% · 30yr
- Down + closing
- —
- Monthly P&I
- —
- Monthly cashflow
- —
- DSCR
- —
- Eligible?
- —
No personal income docs; deal must DSCR.
Hard money
10% down · 12.0% · 12mo
- Down + closing
- —
- Monthly P&I
- —
- Monthly cashflow
- —
- DSCR
- —
- Eligible?
- —
Short-term bridge; refi at stabilization.
Rent comps 1 comps
| Address | Beds | Baths | Sqft | Rent | $/sqft | DOM | Units | Dist |
|---|---|---|---|---|---|---|---|---|
| 110 S L St Needles, CA | 2.0 | 1.0 | 700 | $800 | $1.14 | 45d | 1 | 0.17mi |
Listing history 36 events
-
2026-06-22days on market $65,000 Active 24 DOM
-
2026-06-19days on market $65,000 Active 22 DOM
-
2026-06-18days on market $65,000 Active 21 DOM
-
2026-06-17days on market $65,000 Active 20 DOM
-
2026-06-16days on market $65,000 Active 19 DOM
-
2026-06-15days on market $65,000 Active 18 DOM
-
2026-06-14days on market $65,000 Active 16 DOM
-
2026-06-13days on market $65,000 Active 15 DOM
-
2026-06-10days on market $65,000 Active 13 DOM
-
2026-06-09days on market $65,000 Active 12 DOM
-
2026-06-08days on market $65,000 Active 11 DOM
-
2026-06-07days on market $65,000 Active 10 DOM
-
2026-06-05days on market $65,000 Active 7 DOM
-
2026-06-02days on market $65,000 Active 5 DOM
-
2026-06-01days on market $65,000 Active 4 DOM
-
2026-05-31days on market $65,000 Active 3 DOM
-
2026-05-30days on market $65,000 Active 2 DOM
-
2026-05-14$65,000 Active 27-char remark
Show marketing remark (27 chars)
3 bedroom 1 bath fixer uper
-
2025-06-12soldstatus $35,000 Closed Sale 238-char remark
Show marketing remark (238 chars)
Investors dream! Perfect opportunity to flip or keep for as a rental property, due to it's close proximity to the river just 5 minutes away. Also just 30 minutes from Laughlin just across river, there you'll find all the casinos and more!
-
2025-06-09status Pending Sale 238-char remark
Show marketing remark (238 chars)
Investors dream! Perfect opportunity to flip or keep for as a rental property, due to it's close proximity to the river just 5 minutes away. Also just 30 minutes from Laughlin just across river, there you'll find all the casinos and more!
-
2025-06-04Active Under Contract 238-char remark
Show marketing remark (238 chars)
Investors dream! Perfect opportunity to flip or keep for as a rental property, due to it's close proximity to the river just 5 minutes away. Also just 30 minutes from Laughlin just across river, there you'll find all the casinos and more!
-
2025-06-03$35,000 238-char remark
Show marketing remark (238 chars)
Investors dream! Perfect opportunity to flip or keep for as a rental property, due to it's close proximity to the river just 5 minutes away. Also just 30 minutes from Laughlin just across river, there you'll find all the casinos and more!
-
2025-04-14soldstatus $30,000 Closed Sale
-
2025-04-07status Pending Sale
-
2025-04-01historical Active Under Contract
-
2025-03-27price $33,000
-
2025-03-03status Active
-
2025-02-27historical Active Under Contract
-
2024-11-11price $45,000
-
2024-11-01status Active
-
2024-10-25historical Active Under Contract
-
2024-10-19price $55,000
-
2024-09-07price $65,000
-
2024-08-20$70,000 Active
-
2012-06-18soldstatus $36,000
-
1991-01-22soldstatus $23,000
ⓘ Source: listings_history table (triggers on properties + properties_extension) + one-shot
backfill from property_details.listing_events for pre-trigger history.
Tax reassessment forecast CA · Resets to sale price
- Current annual tax
- $672 · $56/mo
- Projected year-2 tax
- $672 · $56/mo
- Expected delta
- $0/yr ($0/mo · 0.0%)
ⓘ Screening estimate from a state-policy table — verify with the county assessor before closing.
Climate risk First Street
- Flood 1/10 Low FEMA zone X (unshaded) · 0% chance over 30 yrs
- Wildfire 4/10 Moderate
- Heat 9/10 Extreme 7 d/yr ≥116°F today · 16 d/yr by 30 yrs out
- Wind 1/10 Low
- Air quality 1/10 Low 0 unhealthy d/yr today · 0 by 30 yrs out
Nearby sold comps map
Loading sold comps map…
Walkable amenities ~0.75 mi
Loading nearby amenities…
Taxation est. · year 1
- Rental income
- $9,600
- − Mortgage interest
- −$3,641
- − Property taxes
- −$672
- − Insurance
- −$325
- − Repairs & maintenance
- −$768
- − Management
- −$768
- − Depreciation
- −$1,891
- Taxable income
- $1,535
- Est. tax owed @ 24.0%
- −$368
- After-tax cash flow
- $2,128/yr
For passive investors: Depreciation is non-cash, so a rental often shows a tax loss while cash-flowing — sheltering income. Rental losses are passive: they offset passive income freely, and up to $25,000/yr can offset ordinary (W-2) income if you actively participate and your MAGI is under $100k (phasing out to $0 by $150k); unused losses carry forward. On sale, claimed depreciation is recaptured at up to 25%, and gains may owe capital-gains tax (a 1031 exchange can defer both). Figures are a year-1 estimate at your 24.0% rate — not tax advice; consult a CPA.
Schools (NCES district)
- District
- Needles Unified
- NCES district ID
- 0626760
- Math proficiency
- 22% ▼ -2.00%
- Reading proficiency
- 28% ▼ -1.00%
- Median HH income
- $31,795
- Composite
- 23.35/100
- National rank
- #13305
- State rank
- #1194 of 1400 in CA
Livability — Needles
- Score
- 62/100
- State rank
- #492
- US rank
- #16661
Category grades
Schools grade is shown separately in the Schools card above.
Census & demographics
- Census place
- Needles, CA
- Population (ZIP)
- 5,392
Population outlook (San Bernardino County) Hauer SSP2
- Today (2025)
- 2,300,329 people
- By 2030
- 2,378,907 · +3.4%
- By 2040
- 2,523,137 · +9.7%
- By 2050
- 2,642,388 · +14.9%
- By 2075
- 2,880,769 · +25.2%
- By 2100
- 2,909,436 · +26.5%
Race, ethnicity, and origin ACS 2023
- Neighborhood character
- Diverse neighborhood (Simpson 0.63)
- Race & ethnicity
- White 54% Hispanic / Latino 29% Two or more races 16% Native American 11% Black 3%
- Hispanic origin (detail)
- Mexican 24% Puerto Rican 2%
- Common ancestry
- Romanian 3% Iranian 3% Lithuanian 2%
- Foreign-born
- 3% · Canada, China
- Languages at home
- 89% English-only · Spanish 9% Chinese 1%
Political lean MEDSL · San Bernardino
- 2024 margin
- Toss-up / Even · D 47.5% · R 49.7% · Other 2.8%
- 2008→2024 swing
- -8.5pp toward R · 2008: 6.3pp · 2024: -2.1pp
- All cycles
- 2024: R+2.1 2020: D+10.7 2016: D+9.8 2012: D+5.4 2008: D+6.3
Not yet ingested
- Civics
- —
Market trends
- HPI YoY
- ▲ 1.64%
- Current HPI
- 279.7931
- Rent YoY
- —
- Metro
- —
- State GDP YoY
- ▲ 3.21%
- F500 in state
- 116
Industry mix (Fortune 500 HQ in CA)
| Industry | F500 HQs | Revenue |
|---|---|---|
| Technology | 27 | $1,492B |
|
||
| Financial Services | 3 | $174B |
|
||
| Retail | 3 | $44B |
|
||
| Insurance | 3 | $26B |
|
||
| Media / Entertainment | 2 | $115B |
|
||
| Pharmaceuticals / Biotech | 2 | $62B |
|
||
Price history
+182.6% since first listed20 events — show timeline
- 2026-05-20 Listed $65,000 Fizber.com
- 2026-05-14 Listed $65,000 FSBO.com
- 2025-06-12 Sold (MLS) $35,000 CRMLS
- 2025-06-09 Pending — CRMLS
- 2025-06-04 Listed — CRMLS
- 2025-06-03 Listed $35,000 CRMLS
- 2025-04-14 Sold (MLS) $30,000 CRMLS
- 2025-04-07 Pending — CRMLS
- 2025-04-01 Contingent — CRMLS
- 2025-03-27 Price Changed $33,000 CRMLS
- 2025-03-03 Relisted — CRMLS
- 2025-02-27 Contingent — CRMLS
- 2024-11-11 Price Changed $45,000 CRMLS
- 2024-11-01 Relisted — CRMLS
- 2024-10-25 Contingent — CRMLS
- 2024-10-19 Price Changed $55,000 CRMLS
- 2024-09-07 Price Changed $65,000 CRMLS
- 2024-08-20 Listed $70,000 CRMLS
- 2012-06-18 Sold (Public Records) $36,000 Public Records
- 1991-01-22 Sold (Public Records) $23,000 Public Records
Property tax history
+4.4%/yrLatest (2025): $672 · +1.9% YoY. Source: county tax records.
Cash-flow waterfall
monthlySold comps — $/sqft
last 12 mo · ≤1 miLoading sold comps…