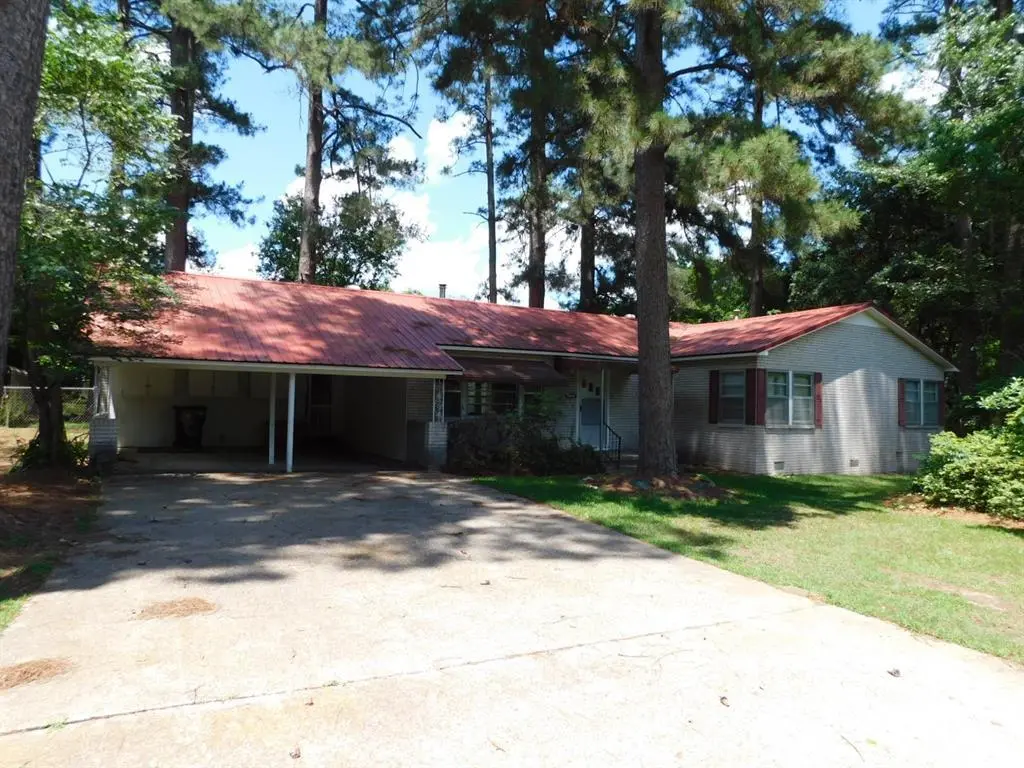
24044 Highway 157 Hwy · Springhill, LA
Flood risk 1/10 · Minimal
- FEMA flood zone
- X (unshaded)
- Chance of flooding over 30 yrs
- 0.0%
- Est. flood insurance / yr
- $507 – $1,088
Fire risk 4/10 · Minor
- Est. fire insurance / yr
- $1,269 – $2,357
Heat risk 7/10 · Major
- Hot days now (above 113°F)
- 7 days/yr
- Hot days in 30 yrs
- 21 days/yr
Wind risk 6/10 · Moderate
- Chance of severe wind over 30 yrs
- 51.0%
Air-quality risk 1/10 · Minimal
- Unhealthy air days now
- 0 days/yr
- Unhealthy air days in 30 yrs
- 0 days/yr
Risk factors via First Street. Map © Google.
Why this score? — see what drove the D+ grade
The composite is a weighted blend of 9 inputs, each scored 0–100. Each bar is that input's sub-score; the figure is the points it added to the 100-point composite (weight × sub-score).
- Cash flow +16.4/30.0
- ARV discount +7.5/15.0
- Appreciation +6.8/10.0
- DSCR +5.1/10.0
- 1% rule +3.8/10.0
- Livability +3.2/5.0
- Rent growth +2.5/5.0
- Condition / age +2.5/5.0
- Schools +1.8/10.0
$134,900
🖨 Deal sheet 📄 Offer letter ✓ Due diligence
Listing remarks
BRING YOUR DUCKS OR CATFISH TO SWIM IN THE PRIVATE POND WITH AERATOR IN THE BACKYARD OF THIS COUNTRY HOME! THIS 3 BEDROOM 2 BATHROOM HOME WITH APPROXIMATELY 1,885 SQUARE FEET OF LIVING AREA SITS ON A 1.19 ACRE COUNTRY LOT. HOME FEAURES A LOT OF PANELING, HARD WOOD FLOORS, A WOOD BURNING HEATER STOVE AND A WONDERFUL SUN PORCH THAT FACES THE FENCED IN BACKYARD. HOME ALSO CENTRAL HEAT & AIR, A DOUBLE CARPORT AND RED METAL ROOF.
Key facts
- Sun porch
- Fenced in backyard
- Red metal roof
Tags
Property features AI
Finance
- Financial info: Treat as clear loan type; No second mortgage
- HOA & community: No association
Exterior
- Parking: Attached carport; 2 covered parking spaces; 2 carport spaces
- Utilities: City water; Septic; Power and utilities available via standard connections
- Home design: Single family residence; One-story; Built in 1950; Not attached to another property
- Construction: Metal roof; Pillar/post/pier foundation; Construction materials: Unknown/Other
- Exterior features: All-weather road access; Asphalt access; City water; Septic system; Rural setting; Lot about 1.19 acres
Interior
- Kitchen: Gas Range
- Bedrooms: 3 bedrooms (primary bedroom on level 1)
- Flooring: Ceramic tile; Vinyl; Wood
- Bathrooms: 2 full bathrooms
- Heating & cooling: Central heating; Central air conditioning; Wood burning stove (fireplace)
- Interior features: Paneling; Other interior features
- Laundry & utility: Utility room
Neighborhood map
What this means for you Summary
Snapshot
- This is a 3-bed/2.0-bath single-family listed at $135k.
Deal economics
- At list price, monthly cash flow is $77 ($928/yr) — positive.
- The deal already cash-flows at list — no discount required.
- To meet the 1% rule (rent ≥ 1% of price), the offer needs to be $119k (11.8% below list).
- Recommended offer: $119k (11.8% below list) — sets the bar for 1% rule.
Location & tenants
- Location reads 65/100 on livability (#139 in LA) — a middle-class / working-renter tenant base. Strengths: cost of living A+, crime A-, health & safety A-; Watch: amenities F, commute F, employment F.
- Webster Parish (town): math 17% / reading 26% proficiency, ranked #67 of 98 in LA (top 68%) — low school quality limits family demand, transient renter base, plan for 1-2y turnover; 61% free/reduced lunch — lower-income household profile, screen leases tightly.
- Market conditions: 44 active listings in the ZIP; 36 units permitted in Webster Parish in 2024 (0 in 5+ unit buildings).
Forward outlook
- In year one you build about $6k of equity ($933 loan paydown + $5k appreciation (3.6% local appreciation)).
- Webster County population projected at -21% by 2050 — secular population decline; favor cash flow + early exit over multi-decade hold.
- At projected returns (3.6% appreciation + 3.0% rent growth), your $38k cash investment doubles in ~5 years — after that, you're playing with house money.
- By year 6, paydown + projected appreciation supports a ~$30k cash-out refi (75% LTV) — recoverable capital for the next deal without selling this one.
Negotiation context
- It's been on market 24 days — a 2% lower offer ($133k) is reasonable based on typical stale-listing flexibility.
Risks & watch-outs
- Watch-outs: built in 1950 — expect roof / HVAC / electrical / plumbing capex.
- Climate carrying-cost: major wind risk, 51% chance of damaging wind over 30y; extreme-heat days projected 7→21/yr by 2055 (HVAC capex compounding) — expect insurance premiums to compound above CPI over the hold.
Questions for the listing agent
- Built in 1950 — when were the roof, HVAC, electrical panel, plumbing, and water heater last replaced?
- Is there a deadline driving the sale (1031 exchange, divorce, estate, relocation)? That informs how much negotiation room exists.
- The area grade is low — what's the realistic commute time and amenity access for the typical tenant pool here? Any planned neighborhood developments (good or bad) we should know about?
- What's the average days-on-market for RENTAL listings here right now (not sales)? A rising rental-DOM trend means longer vacancies and softer asking-rent achievability than the comps imply.
- What's the recent tenant-quality profile in this submarket — average credit score on applications, eviction rate, late-payment / NSF rate, and stable-employment percentage? A property-management company in the area should have these aggregated.
- How much new for-sale + rental construction is in the pipeline within 1–3 miles? Heavy new supply typically softens prices + rents 12–24 months out; constrained supply supports both.
Investment metrics
- 1% rule
- 0.88% ✗
- Cap rate
- 6.98%
- Cash-on-cash
- 2.46%
- DSCR
- 1.11
- GRM
- 9.4
CMA / ARV
No comps found within radius.
Projected returns pro-forma
3.57% appreciation · 3.0% rent growth · sell at horizon
- IRR
- 11.3%
- Equity multiple
- 1.67×
- Total profit
- $25,241
- Equity at exit
- $65,007
- IRR
- 13.1%
- Equity multiple
- 3.06×
- Total profit
- $77,994
- Equity at exit
- $103,707
Cash invested: $37,772 (down + closing). Projections, not guarantees.
Landlord ↔ Tenant lean methodology
- Overall (STATE)
- 90 Strongly Landlord-Friendly
- State Louisiana
- 90 Strongly Landlord-Friendly · R+12
- County
- — inherits STATE
- City
- — inherits STATE
ZIP-level market 71075
- Home prices YoY
- 4.1%
- Active inventory
- 44
- Price-to-rent
- 9.4×
Monthly cashflow live
- Estimated rent
- $1,190 medium interval (Pro) →
- Mortgage (P&I)
- −$707
- Tax from tax record
- −$99 /mo · $1,189/yr
- Insurance
- −$56
- HOA
- −$0
- Vacancy / Maint / Mgmt
- −$250
- Net cashflow
- $77
Break-even live
UW: 25.0% down · 7.5% · 30yr · 1.5% tax · 5.0% vac · 8.0% maint · 8.0% mgmt
Financing live
Cash to close
- Down payment
- $33,725
- Closing costs
- $4,047
- Reserves months
- —
- Total cash needed
- —
Loan-product check · same deal, 3 products live
Conventional
25% down · 7.5% · 30yr
- Down + closing
- —
- Monthly P&I
- —
- Monthly cashflow
- —
- DSCR
- —
- Eligible?
- —
Personal DTI + credit; lowest rate.
DSCR
20% down · 8.5% · 30yr
- Down + closing
- —
- Monthly P&I
- —
- Monthly cashflow
- —
- DSCR
- —
- Eligible?
- —
No personal income docs; deal must DSCR.
Hard money
10% down · 12.0% · 12mo
- Down + closing
- —
- Monthly P&I
- —
- Monthly cashflow
- —
- DSCR
- —
- Eligible?
- —
Short-term bridge; refi at stabilization.
Listing history 15 events
-
2026-06-18days on market $134,900 Active 24 DOM
-
2026-06-17days on market $134,900 Active 23 DOM
-
2026-06-16days on market $134,900 Active 22 DOM
-
2026-06-15days on market $134,900 Active 21 DOM
-
2026-06-14days on market $134,900 Active 19 DOM
-
2026-06-13days on market $134,900 Active 18 DOM
-
2026-06-10days on market $134,900 Active 16 DOM
-
2026-06-09days on market $134,900 Active 15 DOM
-
2026-06-08days on market $134,900 Active 14 DOM
-
2026-06-07days on market $134,900 Active 13 DOM
-
2026-06-02days on market $134,900 Active 8 DOM
-
2026-06-01days on market $134,900 Active 7 DOM
-
2026-05-31days on market $134,900 Active 6 DOM
-
2026-05-30days on market $134,900 Active 5 DOM
-
2026-05-25$134,900 Active
ⓘ Source: listings_history table (triggers on properties + properties_extension) + one-shot
backfill from property_details.listing_events for pre-trigger history.
Tax reassessment forecast LA · Resets to sale price
- Current annual tax
- $1,189 · $99/mo
- Projected year-2 tax
- $1,189 · $99/mo
- Expected delta
- $0/yr ($0/mo · 0.0%)
ⓘ Screening estimate from a state-policy table — verify with the county assessor before closing.
Climate risk First Street
- Flood 1/10 Low FEMA zone X (unshaded) · 0% chance over 30 yrs
- Wildfire 4/10 Moderate
- Heat 7/10 Severe 7 d/yr ≥113°F today · 21 d/yr by 30 yrs out
- Wind 6/10 Major 51% chance of damaging wind over 30 yrs
- Air quality 1/10 Low 0 unhealthy d/yr today · 0 by 30 yrs out
Nearby sold comps map
Loading sold comps map…
Walkable amenities ~0.75 mi
Loading nearby amenities…
Taxation est. · year 1
- Rental income
- $14,280
- − Mortgage interest
- −$7,556
- − Property taxes
- −$1,189
- − Insurance
- −$674
- − Repairs & maintenance
- −$1,142
- − Management
- −$1,142
- − Depreciation
- −$3,924
- Taxable loss
- −$1,350
- Est. tax savings @ 24.0%
- +$324
- After-tax cash flow
- $1,252/yr
For passive investors: Depreciation is non-cash, so a rental often shows a tax loss while cash-flowing — sheltering income. Rental losses are passive: they offset passive income freely, and up to $25,000/yr can offset ordinary (W-2) income if you actively participate and your MAGI is under $100k (phasing out to $0 by $150k); unused losses carry forward. On sale, claimed depreciation is recaptured at up to 25%, and gains may owe capital-gains tax (a 1031 exchange can defer both). Figures are a year-1 estimate at your 24.0% rate — not tax advice; consult a CPA.
Schools (NCES district)
- District
- Webster Parish
- NCES district ID
- 2201890
- Math proficiency
- 17% ▼ -39.00%
- Reading proficiency
- 26% ▼ -38.00%
- Median HH income
- $33,011
- Composite
- 17.5/100
- National rank
- #9055
- State rank
- #67 of 98 in LA
Livability — Springhill
- Score
- 65/100
- State rank
- #139
- US rank
- #12517
Category grades
Schools grade is shown separately in the Schools card above.
Census & demographics
- Population (ZIP)
- 5,417
Population outlook (Webster County) Hauer SSP2
- Today (2025)
- 37,736 people
- By 2030
- 36,203 · -4.1%
- By 2040
- 32,988 · -12.6%
- By 2050
- 29,743 · -21.2%
- By 2075
- 22,346 · -40.8%
- By 2100
- 15,045 · -60.1%
Race, ethnicity, and origin ACS 2023
- Neighborhood character
- Diverse neighborhood (Simpson 0.56)
- Race & ethnicity
- White 56% Black 34% Hispanic / Latino 6% Two or more races 2% Native American 2%
- Hispanic origin (detail)
- Mexican 4%
- Common ancestry
- Iranian 4% Slovak 3% Lithuanian 2%
- Foreign-born
- 1% · Canada
- Languages at home
- 99% English-only · French/Haitian/Cajun 1% Spanish 1%
Political lean MEDSL · Webster
- 2024 margin
- Solid R (+36.5) · D 31.2% · R 67.7% · Other 1.1%
- 2008→2024 swing
- -10.2pp toward R · 2008: -26.3pp · 2024: -36.5pp
- All cycles
- 2024: R+36.5 2020: R+31.1 2016: R+29.1 2012: R+25.0 2008: R+26.3
Not yet ingested
- Civics
- —
Market trends
- HPI YoY
- ▲ 3.57%
- Current HPI
- 90.8938
- Rent YoY
- —
- Metro
- —
- State GDP YoY
- ▲ 3.29%
- F500 in state
- 10
Industry mix (Fortune 500 HQ in LA)
| Industry | F500 HQs | Revenue |
|---|---|---|
| Telecommunications | 2 | $23B |
|
||
| Utilities | 1 | $12B |
|
||
| Wholesale / Distribution | 1 | $5B |
|
||
| Advertising | 1 | $2B |
|
||
Price history
1 event — show timeline
- 2026-05-25 Listed $134,900 NTREIS
Property tax history
+2.1%/yrLatest (2025): $1,189 · +1.9% YoY. Source: county tax records.
Cash-flow waterfall
monthlySold comps — $/sqft
last 12 mo · ≤1 miLoading sold comps…