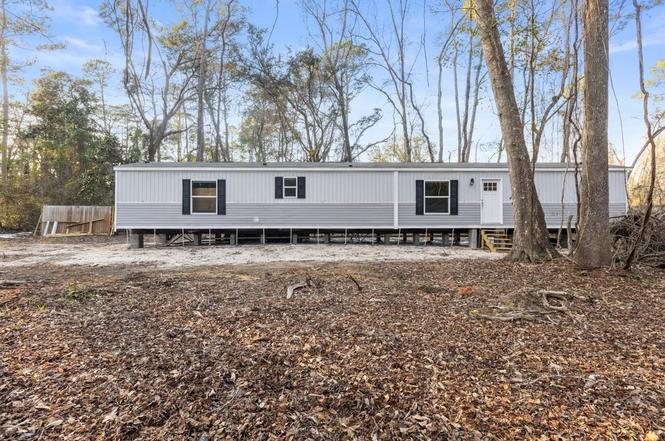
295 W J Hatchett Rd · Monticello, FL
Flood risk 1/10 · Minimal
- FEMA flood zone
- X (unshaded)
- Chance of flooding over 30 yrs
- 0.0%
- Est. flood insurance / yr
- $507 – $1,088
Fire risk 4/10 · Minor
- Est. fire insurance / yr
- $947 – $1,759
Heat risk 7/10 · Major
- Hot days now (above 107°F)
- 7 days/yr
- Hot days in 30 yrs
- 18 days/yr
Wind risk 9/10 · Severe
- Chance of severe wind over 30 yrs
- 99.0%
Air-quality risk 4/10 · Minor
- Unhealthy air days now
- 7 days/yr
- Unhealthy air days in 30 yrs
- 7 days/yr
Risk factors via First Street. Map © Google.
Why this score? — see what drove the B grade
The composite is a weighted blend of 9 inputs, each scored 0–100. Each bar is that input's sub-score; the figure is the points it added to the 100-point composite (weight × sub-score).
- Cash flow +30.0/30.0
- DSCR +10.0/10.0
- 1% rule +8.8/10.0
- ARV discount +7.5/15.0
- Appreciation +7.4/10.0
- Livability +3.6/5.0
- Rent growth +2.5/5.0
- Schools +2.5/10.0
- Condition / age +2.5/5.0
$80,000
🖨 Deal sheet 📄 Offer letter ✓ Due diligence
Listing remarks
Investor special with great potential! Situated on approximately . 75 acres in Jefferson County, this 2022 mobile home offers a fantastic opportunity for the right buyer to complete the final steps and make it their own. Conveniently located just minutes from I-10 for easy access to Tallahassee and only about 10 minutes to downtown Monticello, the property combines rural space with excellent connectivity. The home features 3 bedrooms and 2 bathrooms with a functional split-bedroom style layout. Inside, the bright and open floor plan includes a spacious kitchen with a large island and bar seating that flows directly into the living room, creating a welcoming space for everyday living or gath
Key facts
- Spacious kitchen
- Large island
- Bar seating
Tags
Property features AI
Finance
- Financial info: Offered for sale
Exterior
- Parking: Driveway
- Utilities: Has heating and cooling
- Home design: Single-story home; Single wide mobile home
- Construction: Vinyl siding
- Exterior features: Paved road access; Publicly maintained road
Interior
- Kitchen: Dishwasher; Oven; Range; Refrigerator
- Bedrooms: Bedroom 2 (9 x 10); Bedroom 3 (9 x 10)
- Flooring: Plank flooring; Vinyl flooring
- Bathrooms: 2 full bathrooms
- Heating & cooling: Central heating (electric); Central air; Ceiling fan(s)
- Interior features: Split bedroom layout; No additional interior features listed
- Laundry & utility: Utility room
Neighborhood map
What this means for you Summary
Snapshot
- This is a 3-bed/2.0-bath manufactured listed at $80k.
Deal economics
- At list price, monthly cash flow is $321 ($4k/yr) — positive.
- The deal already cash-flows at list — no discount required.
- Meets the 1% rule at list price ($1k rent vs $80k).
- Recommended offer: $73k (9.0% below list) — sets the bar for market timing.
- Cap rate 11.1% vs local median 2.8% in Monticello — top-decile yield for the area; either an underpriced asset or a hidden risk that comps aren't pricing in. Stress-test before assuming the spread holds.
Location & tenants
- Location reads 72/100 on livability (#356 in FL) — a middle-class / working-renter tenant base. Strengths: crime A+, cost of living A+, health & safety A+; Watch: schools D, amenities D-, commute F.
- Jefferson (rural): math 28% / reading 30% proficiency, ranked #71 of 73 in FL (top 97%) — low school quality limits family demand, transient renter base, plan for 1-2y turnover; 74% free/reduced lunch — lower-income household profile, screen leases tightly.
- Market conditions: 11 active listings in the ZIP; 64 units permitted in Jefferson County in 2024 (0 in 5+ unit buildings).
Forward outlook
- In year one you build about $4k of equity ($553 loan paydown + $4k appreciation (4.7% local appreciation)).
- Jefferson County population projected at -34% by 2050 — secular population decline; favor cash flow + early exit over multi-decade hold.
- At projected returns (4.7% appreciation + 3.0% rent growth), your $22k cash investment doubles in ~3 years — after that, you're playing with house money.
- By year 8, paydown + projected appreciation supports a ~$33k cash-out refi (75% LTV) — recoverable capital for the next deal without selling this one.
Negotiation context
- It's been on market 100 days — a 9% lower offer ($73k) is reasonable based on typical stale-listing flexibility.
Risks & watch-outs
- Climate carrying-cost: severe wind risk, 99% chance of damaging wind over 30y; extreme-heat days projected 7→18/yr by 2055 (HVAC capex compounding) — expect insurance premiums to compound above CPI over the hold.
Questions for the listing agent
- It's been on market 100 days. Have you received any prior offers? Is the seller open to a 9% concession, seller financing, or rate buy-down credit?
- Why hasn't it sold? Are there any deal-killer items the seller is aware of (foundation, flood, title, zoning, code violations)?
- Is there a deadline driving the sale (1031 exchange, divorce, estate, relocation)? That informs how much negotiation room exists.
- Schools are D-rated, which usually means shorter tenancies and higher turnover. Who's the typical renter profile here, and what's been the actual vacancy rate?
- What's the average days-on-market for RENTAL listings here right now (not sales)? A rising rental-DOM trend means longer vacancies and softer asking-rent achievability than the comps imply.
- What's the recent tenant-quality profile in this submarket — average credit score on applications, eviction rate, late-payment / NSF rate, and stable-employment percentage? A property-management company in the area should have these aggregated.
- How much new for-sale + rental construction is in the pipeline within 1–3 miles? Heavy new supply typically softens prices + rents 12–24 months out; constrained supply supports both.
Investment metrics
- 1% rule
- 1.38% ✓
- Cap rate
- 11.11%
- Cash-on-cash
- 17.19%
- DSCR
- 1.76
- GRM
- 6.0
CMA / ARV
No comps found within radius.
Projected returns pro-forma
4.72% appreciation · 3.0% rent growth · sell at horizon
- IRR
- 27.2%
- Equity multiple
- 2.68×
- Total profit
- $37,618
- Equity at exit
- $43,982
- IRR
- 26.4%
- Equity multiple
- 5.32×
- Total profit
- $96,721
- Equity at exit
- $74,812
Cash invested: $22,400 (down + closing). Projections, not guarantees.
Landlord ↔ Tenant lean methodology
- Overall (STATE)
- 87 Strongly Landlord-Friendly
- State Florida
- 87 Strongly Landlord-Friendly · R+3
- County
- — inherits STATE
- City
- — inherits STATE
ZIP-level market 32336
- Home prices YoY
- 2.5%
- Active inventory
- 11
- Price-to-rent
- 6.0×
Monthly cashflow live
- Estimated rent
- $1,106 medium interval (Pro) →
- Mortgage (P&I)
- −$420
- Tax est. 1.5%
- −$100 /mo · $1,200/yr
- Insurance
- −$33
- HOA
- −$0
- Vacancy / Maint / Mgmt
- −$232
- Net cashflow
- $321
Break-even live
UW: 25.0% down · 7.5% · 30yr · 1.5% tax · 5.0% vac · 8.0% maint · 8.0% mgmt
Financing live
Cash to close
- Down payment
- $20,000
- Closing costs
- $2,400
- Reserves months
- —
- Total cash needed
- —
Loan-product check · same deal, 3 products live
Conventional
25% down · 7.5% · 30yr
- Down + closing
- —
- Monthly P&I
- —
- Monthly cashflow
- —
- DSCR
- —
- Eligible?
- —
Personal DTI + credit; lowest rate.
DSCR
20% down · 8.5% · 30yr
- Down + closing
- —
- Monthly P&I
- —
- Monthly cashflow
- —
- DSCR
- —
- Eligible?
- —
No personal income docs; deal must DSCR.
Hard money
10% down · 12.0% · 12mo
- Down + closing
- —
- Monthly P&I
- —
- Monthly cashflow
- —
- DSCR
- —
- Eligible?
- —
Short-term bridge; refi at stabilization.
Listing history 17 events
-
2026-06-18days on market $80,000 Active 100 DOM
-
2026-06-17days on market $80,000 Active 99 DOM
-
2026-06-16days on market $80,000 Active 98 DOM
-
2026-06-15days on market $80,000 Active 97 DOM
-
2026-06-14days on market $80,000 Active 95 DOM
-
2026-06-13days on market $80,000 Active 94 DOM
-
2026-06-10days on market $80,000 Active 92 DOM
-
2026-06-09days on market $80,000 Active 91 DOM
-
2026-06-08days on market $80,000 Active 90 DOM
-
2026-06-07days on market $80,000 Active 89 DOM
-
2026-06-03days on market $80,000 Active 85 DOM
-
2026-06-02days on market $80,000 Active 84 DOM
-
2026-06-01days on market $80,000 Active 83 DOM
-
2026-05-31days on market $80,000 Active 82 DOM
-
2026-05-30days on market $80,000 Active 81 DOM
-
2026-05-11price $80,000
-
2026-03-10$95,000 Active
ⓘ Source: listings_history table (triggers on properties + properties_extension) + one-shot
backfill from property_details.listing_events for pre-trigger history.
Climate risk First Street
- Flood 1/10 Low FEMA zone X (unshaded) · 0% chance over 30 yrs
- Wildfire 4/10 Moderate
- Heat 7/10 Severe 7 d/yr ≥107°F today · 18 d/yr by 30 yrs out
- Wind 9/10 Extreme 99% chance of damaging wind over 30 yrs
- Air quality 4/10 Moderate 7 unhealthy d/yr today · 7 by 30 yrs out
Nearby sold comps map
Loading sold comps map…
Walkable amenities ~0.75 mi
Loading nearby amenities…
Taxation est. · year 1
- Rental income
- $13,271
- − Mortgage interest
- −$4,481
- − Property taxes
- −$1,200
- − Insurance
- −$400
- − Repairs & maintenance
- −$1,062
- − Management
- −$1,062
- − Depreciation
- −$2,327
- Taxable income
- $2,739
- Est. tax owed @ 24.0%
- −$657
- After-tax cash flow
- $3,193/yr
For passive investors: Depreciation is non-cash, so a rental often shows a tax loss while cash-flowing — sheltering income. Rental losses are passive: they offset passive income freely, and up to $25,000/yr can offset ordinary (W-2) income if you actively participate and your MAGI is under $100k (phasing out to $0 by $150k); unused losses carry forward. On sale, claimed depreciation is recaptured at up to 25%, and gains may owe capital-gains tax (a 1031 exchange can defer both). Figures are a year-1 estimate at your 24.0% rate — not tax advice; consult a CPA.
Schools (NCES district)
- District
- Jefferson
- NCES district ID
- 1200990
- Math proficiency
- 28% ▼ -10.00%
- Reading proficiency
- 30% ▼ -3.00%
- Median HH income
- $43,356
- Composite
- 24.74/100
- National rank
- #7605
- State rank
- #71 of 73 in FL
Livability — Monticello
- Score
- 72/100
- State rank
- #356
- US rank
- #6199
Category grades
Schools grade is shown separately in the Schools card above.
Census & demographics
- Population (ZIP)
- 1,218
Population outlook (Jefferson County) Hauer SSP2
- Today (2025)
- 12,681 people
- By 2030
- 11,811 · -6.9%
- By 2040
- 9,968 · -21.4%
- By 2050
- 8,319 · -34.4%
- By 2075
- 5,406 · -57.4%
- By 2100
- 3,278 · -74.2%
Race, ethnicity, and origin ACS 2023
- Race & ethnicity
- White 50% Black 47% Two or more races 2% Hispanic / Latino 1%
- Common ancestry
- Lithuanian 5% Slovak 4% Italian 2%
- Foreign-born
- 1%
- Languages at home
- 98% English-only · German/W. Germanic 1% Spanish 1%
Political lean MEDSL · Jefferson
- 2024 margin
- R (+18.6) · D 40.3% · R 58.9%
- 2008→2024 swing
- -22.3pp toward R · 2008: 3.7pp · 2024: -18.6pp
- All cycles
- 2024: R+18.6 2020: R+6.9 2016: R+5.1 2012: D+1.8 2008: D+3.7
Not yet ingested
- Civics
- —
Market trends
- HPI YoY
- ▲ 4.72%
- Current HPI
- 193.5779
- Rent YoY
- —
- Metro
- —
- State GDP YoY
- ▲ 3.28%
- F500 in state
- 36
Industry mix (Fortune 500 HQ in FL)
| Industry | F500 HQs | Revenue |
|---|---|---|
| Industrial Technology | 2 | $29B |
|
||
| Insurance | 2 | $17B |
|
||
| Retail | 1 | $60B |
|
||
| Technology Distribution | 1 | $58B |
|
||
| Homebuilding | 1 | $35B |
|
||
| Technology Manufacturing | 1 | $35B |
|
||
Price history
-15.8% since first listed2 events — show timeline
- 2026-05-11 Price Changed $80,000 CATRS
- 2026-03-10 Listed $95,000 CATRS
Cash-flow waterfall
monthlySold comps — $/sqft
last 12 mo · ≤1 miLoading sold comps…