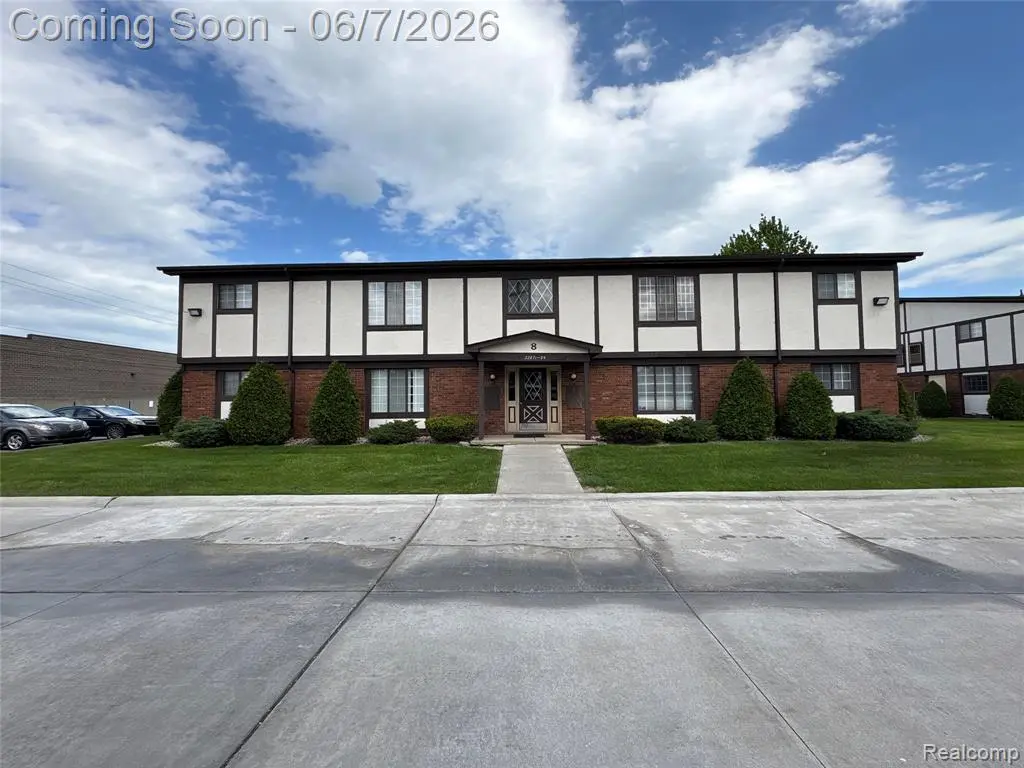
22871 Grove Street St #57 · St. Clair Shores, MI
Flood risk 1/10 · Minimal
- FEMA flood zone
- X (unshaded)
- Chance of flooding over 30 yrs
- 0.0%
- Est. flood insurance / yr
- $473 – $860
Fire risk 1/10 · Minimal
- Est. fire insurance / yr
- $784 – $1,456
Heat risk 3/10 · Minor
- Hot days now (above 96°F)
- 7 days/yr
- Hot days in 30 yrs
- 15 days/yr
Wind risk 1/10 · Minimal
- Chance of severe wind over 30 yrs
- —
Air-quality risk 4/10 · Minor
- Unhealthy air days now
- 4 days/yr
- Unhealthy air days in 30 yrs
- 5 days/yr
Risk factors via First Street. Map © Google.
Why this score? — see what drove the D grade
The composite is a weighted blend of 9 inputs, each scored 0–100. Each bar is that input's sub-score; the figure is the points it added to the 100-point composite (weight × sub-score).
- Cash flow +11.7/30.0
- 1% rule +9.7/10.0
- ARV discount +7.5/15.0
- DSCR +3.4/10.0
- Rent growth +2.5/5.0
- Livability +2.5/5.0
- Condition / age +2.5/5.0
- Schools +1.7/10.0
- Appreciation +0.0/10.0
$79,900
🖨 Deal sheet 📄 Offer letter ✓ Due diligence
Listing remarks
Recently remodeled, this inviting Saint Clair Shores condo offers stylish updates, comfortable living, and a convenient location near shopping, dining, and waterfront attractions! Buyers can also take advantage of special financing available, our exclusive Buy This Home, We’ll Buy Yours Guarantee * , and 24-Month Buyback Guarantee * for added confidence and peace of mind.
Key facts
- $350 HOA
- Built 1973
Property features AI
Finance
- Other: Pet restrictions: call for details; City: Macomb Twp (mailing city Saint Clair Shores)
- Financial info: Land contract available (360 months, 8% interest, approximate payment $528/month)
- HOA & community: Monthly association fee of $350; Association fee includes gas, trash removal, and water/sewer; Association phone available
Exterior
- Utilities: Public water
- Home design: Condominium; One-story; Built in 1973; Unit number 57
- Construction: Brick exterior; Slab foundation; Built in 1973
- Exterior features: Brick construction; Paved street
Interior
- Kitchen: Entry-level kitchen (13 x 8); Range/Oven; Refrigerator
- Bedrooms: Primary bedroom on the entry level (17 x 11)
- Bathrooms: One full bathroom on the entry level (8 x 5)
- Heating & cooling: Forced air heating; Central air conditioning; Natural gas heat/fuel
- Interior features: Total of 4 rooms; Range/Oven; Refrigerator
Neighborhood map
What this means for you Summary
Snapshot
- This is a 1-bed/1.0-bath condo listed at $80k.
Deal economics
- At list price, monthly cash flow is $-23 ($-280/yr) — negative.
- To cash-flow at today's rent, offer at most $76k (5.2% below list).
- Meets the 1% rule at list price ($1k rent vs $80k).
- Recommended offer: $76k (5.2% below list) — sets the bar for cash-flow.
- Cap rate 5.9% vs local median 4.2% in St. Clair Shores — top-decile yield for the area; either an underpriced asset or a hidden risk that comps aren't pricing in. Stress-test before assuming the spread holds.
Location & tenants
- Location reads: area grade D — affects rentability + tenant quality, not the cash-flow math above.
- South Lake Schools (suburban): math 11% / reading 26% proficiency, ranked #470 of 540 in MI (top 87%) — low school quality limits family demand, transient renter base, plan for 1-2y turnover.
- Market conditions: 161 active listings in the ZIP; 3 comparable units currently listed for rent nearby; rentals at typical pace (median 20d on market — plan ~3-4 weeks tenant-placement turnaround); 1,321 units permitted in Macomb County in 2024 (86 in 5+ unit buildings).
Forward outlook
- Local home prices are declining (-3.0%/yr); year-one equity from $552 of loan paydown is wiped out by about $2k of value loss. Plan a longer hold.
- Macomb County population projected at +9% by 2050 — modest demand growth; plan on rents tracking national, not racing it.
Negotiation context
- Only 1 days on market — expect competitive offers; lowballing is unlikely to land.
- Current owner paid $41k; list at $80k implies a 95% gain — meaningful room to come down on a strong offer.
Risks & watch-outs
- Watch-outs: HOA is 30% of rent.
Questions for the listing agent
- What do current leases actually rent for vs. the listed asking? Can we see a recent rent roll and the last 12 months of T-12 income?
- Built in 1973 — when were the roof, HVAC, electrical panel, plumbing, and water heater last replaced?
- What does the HOA fee cover, when was the last increase, and are there any pending special assessments or reserve-fund shortfalls?
- Any open or pending special assessments — roof, HVAC, plumbing, elevator, façade? What's the per-unit balance and payoff schedule, and is the seller paying it off at close or rolling it to the buyer?
- Is there a deadline driving the sale (1031 exchange, divorce, estate, relocation)? That informs how much negotiation room exists.
- The area grade is low — what's the realistic commute time and amenity access for the typical tenant pool here? Any planned neighborhood developments (good or bad) we should know about?
- What's the average days-on-market for RENTAL listings here right now (not sales)? A rising rental-DOM trend means longer vacancies and softer asking-rent achievability than the comps imply.
- What's the recent tenant-quality profile in this submarket — average credit score on applications, eviction rate, late-payment / NSF rate, and stable-employment percentage? A property-management company in the area should have these aggregated.
- How much new apartment / multifamily construction is in the pipeline within 1–3 miles? Heavy new supply (>2% of stock underway) typically softens rents 12–24 months out; light construction supports rent growth.
Investment metrics
- 1% rule
- 1.47% ✓
- Cap rate
- 5.94%
- Cash-on-cash
- -1.25%
- DSCR
- 0.94
- GRM
- 5.7
CMA / ARV
No comps found within radius.
Projected returns pro-forma
-3.0% appreciation · 3.0% rent growth · sell at horizon
- IRR
- -17.9%
- Equity multiple
- 0.37×
- Total profit
- $-14,169
- Equity at exit
- $11,913
- IRR
- -9.4%
- Equity multiple
- 0.41×
- Total profit
- $-13,177
- Equity at exit
- $6,908
Cash invested: $22,372 (down + closing). Projections, not guarantees.
Landlord ↔ Tenant lean methodology
- Overall (STATE)
- 62 Landlord-Friendly
- State Michigan
- 62 Landlord-Friendly · EVEN
- County
- — inherits STATE
- City
- — inherits STATE
ZIP-level market 48080
- Active inventory
- 161
- Price-to-rent
- 5.7×
Monthly cashflow live
- Estimated rent
- $1,178 medium interval (Pro) →
- Mortgage (P&I)
- −$419
- Tax from tax record
- −$151 /mo · $1,815/yr
- Insurance
- −$33
- HOA
- −$350
- Vacancy / Maint / Mgmt
- −$247
- Net cashflow
- $-23
Break-even live
UW: 25.0% down · 7.5% · 30yr · 1.5% tax · 5.0% vac · 8.0% maint · 8.0% mgmt
Financing live
Cash to close
- Down payment
- $19,975
- Closing costs
- $2,397
- Reserves months
- —
- Total cash needed
- —
Loan-product check · same deal, 3 products live
Conventional
25% down · 7.5% · 30yr
- Down + closing
- —
- Monthly P&I
- —
- Monthly cashflow
- —
- DSCR
- —
- Eligible?
- —
Personal DTI + credit; lowest rate.
DSCR
20% down · 8.5% · 30yr
- Down + closing
- —
- Monthly P&I
- —
- Monthly cashflow
- —
- DSCR
- —
- Eligible?
- —
No personal income docs; deal must DSCR.
Hard money
10% down · 12.0% · 12mo
- Down + closing
- —
- Monthly P&I
- —
- Monthly cashflow
- —
- DSCR
- —
- Eligible?
- —
Short-term bridge; refi at stabilization.
Rent comps 3 comps
| Address | Beds | Baths | Sqft | Rent | $/sqft | DOM | Units | Dist |
|---|---|---|---|---|---|---|---|---|
| 22843 Grove St #47 Saint Clair Shores, MI | 1.0 | 1.0 | 700 | $1,100 | $1.57 | 19d | 1 | 0.01mi |
| 21601 E 10 Mile Rd St Clair Shores, MI | 1.0 | 1.0 | 750 | $985 | $1.31 | 24d | 1 | 1.28mi |
| 24901 Jefferson Ave Unit 210 St Clair Shores, MI | 2.0 | 1.0 | 700 | $1,300 | $1.86 | 5d | 1 | 1.39mi |
HOA detail condo
- Monthly dues
- $350 · $4,200/yr
- Likely covers
- water
- Assessments
- None detected in remarks — confirm with the listing agent.
Listing history 4 events
-
2026-06-07statusdays on market $79,900 Active 1 DOM
-
2026-06-04days on market $79,900 Coming Soon 2 DOM
-
2026-06-02remarks 375-char remark
-
2026-06-02$79,900 Coming Soon 1 DOM
ⓘ Source: listings_history table (triggers on properties + properties_extension) + one-shot
backfill from property_details.listing_events for pre-trigger history.
Tax reassessment forecast MI · Partial reset (capped growth)
- Current annual tax
- $1,815 · $151/mo
- Projected year-2 tax
- $1,815 · $151/mo
- Expected delta
- $0/yr ($0/mo · 0.0%)
ⓘ Screening estimate from a state-policy table — verify with the county assessor before closing.
Climate risk First Street
- Flood 1/10 Low FEMA zone X (unshaded) · 0% chance over 30 yrs
- Wildfire 1/10 Low
- Heat 3/10 Moderate 7 d/yr ≥96°F today · 15 d/yr by 30 yrs out
- Wind 1/10 Low
- Air quality 4/10 Moderate 4 unhealthy d/yr today · 5 by 30 yrs out
Nearby sold comps map
Loading sold comps map…
Walkable amenities ~0.75 mi
Loading nearby amenities…
Taxation est. · year 1
- Rental income
- $14,130
- − Mortgage interest
- −$4,476
- − Property taxes
- −$1,815
- − Insurance
- −$400
- − Repairs & maintenance
- −$1,130
- − Management
- −$1,130
- − HOA
- −$4,200
- − Depreciation
- −$2,324
- Taxable loss
- −$1,345
- Est. tax savings @ 24.0%
- +$323
- After-tax cash flow
- $43/yr
For passive investors: Depreciation is non-cash, so a rental often shows a tax loss while cash-flowing — sheltering income. Rental losses are passive: they offset passive income freely, and up to $25,000/yr can offset ordinary (W-2) income if you actively participate and your MAGI is under $100k (phasing out to $0 by $150k); unused losses carry forward. On sale, claimed depreciation is recaptured at up to 25%, and gains may owe capital-gains tax (a 1031 exchange can defer both). Figures are a year-1 estimate at your 24.0% rate — not tax advice; consult a CPA.
Schools (NCES district)
- District
- South Lake Schools
- NCES district ID
- 2632220
- Math proficiency
- 11% ▼ -10.00%
- Reading proficiency
- 26% ▼ -12.00%
- Median HH income
- $51,594
- Composite
- 16.76/100
- National rank
- #9159
- State rank
- #470 of 540 in MI
Livability — St. Clair Shores
No livability data for this city. (Only ~50 U.S. cities are tracked.)
Census & demographics
- Census place
- St. Clair Shores, MI
- County
- Macomb County · 638,552 people
- City population
- 58,217
- Metro
- Detroit-Warren-Dearborn, MI
- Population (ZIP)
- 21,561
- Household income
- $66,986
- Rent vs Own
- Severe rent burden
- 530.0
Population outlook (Macomb County) Hauer SSP2
- Today (2025)
- 925,296 people
- By 2030
- 948,226 · +2.5%
- By 2040
- 983,961 · +6.3%
- By 2050
- 1,010,200 · +9.2%
- By 2075
- 1,076,222 · +16.3%
- By 2100
- 1,077,065 · +16.4%
Race, ethnicity, and origin ACS 2023
- Neighborhood character
- Predominantly White (83%)
- Race & ethnicity
- White 83% Black 8% Two or more races 6% Hispanic / Latino 4% Asian 2%
- Common ancestry
- Romanian 14% Lithuanian 5% Slovak 2%
- Foreign-born
- 6% · Canada, Jamaica
- Languages at home
- 92% English-only · Other Indo-European 3% Spanish 2% Russian/Polish/Slavic 1%
Political lean MEDSL · Macomb
- 2024 margin
- R (+13.7) · D 42.2% · R 55.9% · Other 1.9%
- 2008→2024 swing
- -22.3pp toward R · 2008: 8.6pp · 2024: -13.7pp
- All cycles
- 2024: R+13.7 2020: R+8.1 2016: R+11.6 2012: D+4.0 2008: D+8.6
Not yet ingested
- Civics
- —
Market trends
- HPI YoY
- ▼ -236.99%
- Current HPI
- 231.507
- Rent YoY
- —
- Metro
- Detroit-Warren-Dearborn, MI
- State GDP YoY
- ▲ 1.37%
- F500 in state
- 28
Industry mix (Fortune 500 HQ in MI)
| Industry | F500 HQs | Revenue |
|---|---|---|
| Automotive Parts | 3 | $48B |
|
||
| Automotive | 2 | $372B |
|
||
| Chemicals | 1 | $45B |
|
||
| Automotive Retail | 1 | $29B |
|
||
| Healthcare / Medical Devices | 1 | $23B |
|
||
| Automotive Technology | 1 | $20B |
|
||
Price history
+128.3% since first listed5 events — show timeline
- 2026-06-02 Coming Soon $79,900 MiRealSource-MiMLS
- 2018-11-07 Sold (Public Records) $41,000 Public Records
- 2013-09-10 Sold (Public Records) $16,500 Public Records
- 1989-12-04 Sold (Public Records) $30,000 Public Records
- 1989-12-01 Sold (Public Records) $35,000 Public Records
Property tax history
+13.8%/yrLatest (2025): $1,815 · +4.8% YoY. Source: county tax records.
Cash-flow waterfall
monthlySold comps — $/sqft
last 12 mo · ≤1 miLoading sold comps…