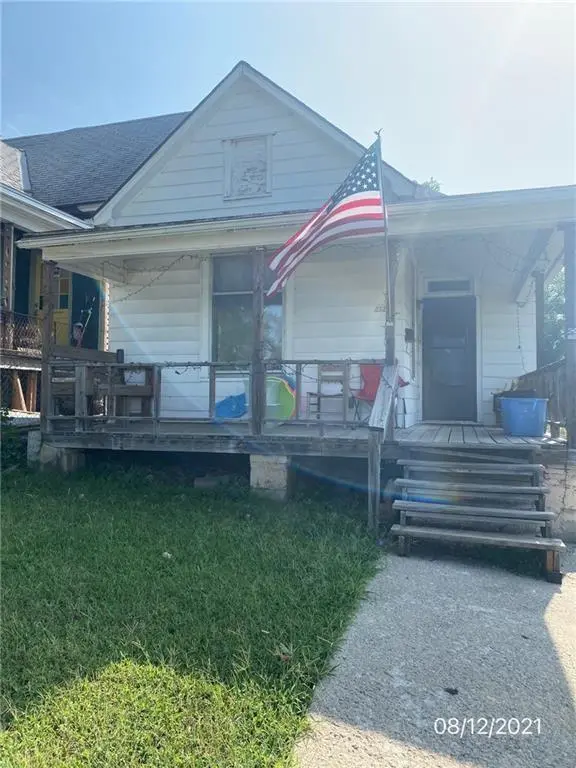
2325 Fairmount Ave · Kansas City, MO
Flood risk 1/10 · Minimal
- FEMA flood zone
- X (unshaded)
- Chance of flooding over 30 yrs
- 0.0%
- Est. flood insurance / yr
- $473 – $860
Fire risk 1/10 · Minimal
- Est. fire insurance / yr
- $1,054 – $1,958
Heat risk 4/10 · Minor
- Hot days now (above 106°F)
- 7 days/yr
- Hot days in 30 yrs
- 17 days/yr
Wind risk 2/10 · Minimal
- Chance of severe wind over 30 yrs
- —
Air-quality risk 3/10 · Minor
- Unhealthy air days now
- 2 days/yr
- Unhealthy air days in 30 yrs
- 3 days/yr
Risk factors via First Street. Map © Google.
Why this score? — see what drove the B+ grade
The composite is a weighted blend of 9 inputs, each scored 0–100. Each bar is that input's sub-score; the figure is the points it added to the 100-point composite (weight × sub-score).
- Cash flow +30.0/30.0
- ARV discount +15.0/15.0
- 1% rule +10.0/10.0
- DSCR +10.0/10.0
- Livability +3.9/5.0
- Rent growth +2.6/5.0
- Condition / age +2.5/5.0
- Schools +1.5/10.0
- Appreciation +0.0/10.0
$135,000
🖨 Deal sheet 📄 Offer letter ✓ Due diligence
Listing remarks MLS
West End Treasure: 2 bedroom, one bath , bungalow nice size living , dinning, and kitchen. Laundry on the main level. Home backs up to a 6500 sq ft lot with its own address and utilities, located on a dead end street. Located close to the Crossroads Art District, River Market, Downtown, Crown Center, Liberty Memorial and The Plaza.
Key facts
- 3,250 sq ft lot
- Built 1910
- Listed 144 days
Neighborhood map
What this means for you Summary
Snapshot
- This is a 2-bed/1.0-bath single-family listed at $135k.
Deal economics
- At list price, monthly cash flow is $684 ($8k/yr) — positive.
- The deal already cash-flows at list — no discount required.
- Meets the 1% rule at list price ($2k rent vs $135k).
- Recommended offer: $119k (12.0% below list) — sets the bar for market timing.
- Cap rate 12.4% vs local median 3.9% in Kansas City — top-decile yield for the area; either an underpriced asset or a hidden risk that comps aren't pricing in. Stress-test before assuming the spread holds.
Location & tenants
- Location reads 78/100 on livability (#28 in MO, #2,671 nationally) — a middle-class / working-renter tenant base. Strengths: amenities A+, commute A+, cost of living A+; Watch: schools C-, crime F.
- Kansas City 33 (urban): math 12% / reading 24% proficiency, ranked #308 of 324 in MO (top 95%) — low school quality limits family demand, transient renter base, plan for 1-2y turnover; 75% free/reduced lunch — lower-income household profile, screen leases tightly.
- Market conditions: Rents flat; 96 active listings in the ZIP; 40 comparable units currently listed for rent nearby; rentals leasing fast (median 11d on market — plan ~1-2 weeks tenant-placement turnaround); solid renter incomes; 4,002 units permitted in Jackson County in 2024 (2,271 in 5+ unit buildings).
- This rent runs 30% of the median local income ($81k/yr) — at the standard rent-burdened threshold; future hikes will face affordability resistance.
Forward outlook
- Local home prices are declining (-3.0%/yr); year-one equity from $933 of loan paydown is wiped out by about $4k of value loss. Plan a longer hold.
- Jackson County population projected at +4% by 2050 — modest demand growth; plan on rents tracking national, not racing it.
- At projected returns (-3.0% appreciation + 0.4% rent growth), your $38k cash investment doubles in ~7 years — after that, you're playing with house money.
Negotiation context
- It's been on market 145 days — a 12% lower offer ($119k) is reasonable based on typical stale-listing flexibility.
- 2 sale attempts since 5y ago; this cycle's ask has dropped $115k (46%) from the opening price — seller is motivated, your offer sets the floor, not the list.
Risks & watch-outs
- Watch-outs: built in 1910 — expect roof / HVAC / electrical / plumbing capex.
Questions for the listing agent
- It's been on market 145 days. Have you received any prior offers? Is the seller open to a 12% concession, seller financing, or rate buy-down credit?
- Built in 1910 — when were the roof, HVAC, electrical panel, plumbing, and water heater last replaced?
- Why hasn't it sold? Are there any deal-killer items the seller is aware of (foundation, flood, title, zoning, code violations)?
- Is there a deadline driving the sale (1031 exchange, divorce, estate, relocation)? That informs how much negotiation room exists.
- Crime grade is F in this area — have there been break-ins, vandalism, or insurance claims at this property in the last 3 years? What carrier currently insures it and at what premium?
- What's the average days-on-market for RENTAL listings here right now (not sales)? A rising rental-DOM trend means longer vacancies and softer asking-rent achievability than the comps imply.
- What's the recent tenant-quality profile in this submarket — average credit score on applications, eviction rate, late-payment / NSF rate, and stable-employment percentage? A property-management company in the area should have these aggregated.
- How much new for-sale + rental construction is in the pipeline within 1–3 miles? Heavy new supply typically softens prices + rents 12–24 months out; constrained supply supports both.
Investment metrics
- 1% rule
- 1.50% ✓
- Cap rate
- 12.37%
- Cash-on-cash
- 21.71%
- DSCR
- 1.97
- GRM
- 5.6
CMA / ARV
- ARV (median comp)
- $207,070
- List price
- $135,000
- Delta
- -34.80%
- Verdict
- UNDERPRICED
- Comps
- 20 within 1.0 mi
Show comp detail 3 sales within ~0.75 mi
| Address | Dist | Beds/Ba | Sqft | Sold | Price | $/sf | Match |
|---|---|---|---|---|---|---|---|
| 2624 Jarboe St | 0.43mi | 2/1.0 | 937 (-0%) | 13mo | $184,900 | $197 | 69 |
| 2331 Belleview Ave | 0.31mi | 2/1.0 | 840 (-10%) | 11mo | $99,900 | $119 | 59 |
| 2009 Summit St | 0.52mi | 2/1.0 | 805 (-14%) | 18mo | $279,000 | $347 | 37 |
Match score weights: distance 35% · size 25% · config 20% · recency 20%. Top-matched comps best support the ARV.
Projected returns pro-forma
-3.0% appreciation · 0.44% rent growth · sell at horizon
- IRR
- 11.4%
- Equity multiple
- 1.44×
- Total profit
- $16,627
- Equity at exit
- $20,129
- IRR
- 18.3%
- Equity multiple
- 2.35×
- Total profit
- $50,862
- Equity at exit
- $11,672
Cash invested: $37,800 (down + closing). Projections, not guarantees.
Landlord ↔ Tenant lean methodology
- Overall (STATE)
- 81 Strongly Landlord-Friendly
- State Missouri
- 81 Strongly Landlord-Friendly · R+10
- County
- — inherits STATE
- City
- — inherits STATE
ZIP-level market 64108
- Home prices YoY
- -25.2%
- Rents YoY
- 0.4%
- Active inventory
- 96
- Price-to-rent
- 5.6×
Monthly cashflow live
- Estimated rent
- $2,020 high interval (Pro) →
- Mortgage (P&I)
- −$708
- Tax from tax record
- −$148 /mo · $1,771/yr
- Insurance
- −$56
- HOA
- −$0
- Vacancy / Maint / Mgmt
- −$424
- Net cashflow
- $684
Break-even live
UW: 25.0% down · 7.5% · 30yr · 1.5% tax · 5.0% vac · 8.0% maint · 8.0% mgmt
Financing live
Cash to close
- Down payment
- $33,750
- Closing costs
- $4,050
- Reserves months
- —
- Total cash needed
- —
Loan-product check · same deal, 3 products live
Conventional
25% down · 7.5% · 30yr
- Down + closing
- —
- Monthly P&I
- —
- Monthly cashflow
- —
- DSCR
- —
- Eligible?
- —
Personal DTI + credit; lowest rate.
DSCR
20% down · 8.5% · 30yr
- Down + closing
- —
- Monthly P&I
- —
- Monthly cashflow
- —
- DSCR
- —
- Eligible?
- —
No personal income docs; deal must DSCR.
Hard money
10% down · 12.0% · 12mo
- Down + closing
- —
- Monthly P&I
- —
- Monthly cashflow
- —
- DSCR
- —
- Eligible?
- —
Short-term bridge; refi at stabilization.
Rent comps 40 comps
| Address | Beds | Baths | Sqft | Rent | $/sqft | DOM | Units | Dist |
|---|---|---|---|---|---|---|---|---|
| 2728 Holly St Kansas City, MO | 2.0 | 1.0 | 800 | $1,800 | $2.25 | 3d | 1 | 0.54mi |
| 1936 Summit St Kansas City, MO | 1.0–2.0 | 1.0 | 1234 | $1,805 | $1.46 | 43d | 1 | 0.54mi |
| 601 Avenida Cesar E Chavez Kansas City, MO | 1.0–2.0 | 1.0–2.0 | 933 | $2,260 | $2.42 | 1d | 15 | 0.55mi |
| 1829 Madison Ave Kansas City, MO | 1.0 | 1.0 | 743 | $1,545 | $2.08 | 43d | 1 | 0.56mi |
| 200 S James St Kansas City, KS | 2.0 | 1.0–2.0 | 806 | $2,149 | $2.66 | 17d | 18 | 0.64mi |
| 1660 Genessee St Kansas City, MO | 2.0 | 1.0–2.0 | 817 | $1,780 | $2.18 | 1d | 17 | 0.66mi |
| 1923 Broadway Blvd Unit 302 Kansas City, MO | 1.0 | 1.0 | 711 | $1,742 | $2.45 | 43d | 1 | 0.79mi |
| 2121 Central St Kansas City, MO | 1.0–2.0 | 1.0–2.0 | 1815 | $3,095 | $1.71 | 1d | 3 | 0.79mi |
| 1648 Jefferson St Kansas City, MO | 2.0 | 1.0 | 777 | $1,495 | $1.92 | 16d | 1 | 0.80mi |
| 311 W 22nd St Kansas City, MO | 3.0 | 1.0–2.0 | 1009 | $3,319 | $3.29 | 1d | 60 | 0.81mi |
| 217 W Pershing Rd Kansas City, MO | 1.0 | 1.0 | 662 | $1,764 | $2.66 | 23d | 1 | 0.82mi |
| 2100 Wyandotte St Kansas City, MO | 2.0 | 1.0–2.0 | 820 | $2,515 | $3.07 | 1d | 12 | 0.86mi |
| 117 W 20th St Kansas City, MO | 1.0–2.0 | 1.0–2.0 | 1130 | $5,416 | $4.79 | 10d | 1 | 0.91mi |
| 2525 Main St #704 Kansas City, MO | 1.0 | 1.0 | 631 | $1,350 | $2.14 | 10d | 1 | 1.01mi |
| 1914 Main St Kansas City, MO | 1.0 | 1.0 | 792 | $1,500 | $1.89 | 1d | 4 | 1.02mi |
| 1819 Baltimore Ave Kansas City, MO | 1.0 | 1.0 | 975 | $2,350 | $2.41 | 14d | 1 | 1.03mi |
| 1989 Main St Kansas City, MO | 2.0 | 1.0–2.0 | 770 | $2,465 | $3.20 | 1d | 15 | 1.05mi |
| 1800 Walnut St Kansas City, MO | 1.0 | 1.0 | 913 | $2,684 | $2.94 | 1d | 16 | 1.13mi |
| 2107 Grand Blvd #903 Kansas City, MO | 1.0 | 1.0 | 920 | $1,500 | $1.63 | 21d | 1 | 1.13mi |
| 2107 Grand Blvd Kansas City, MO | 1.0 | 1.0 | 616 | $1,590 | $2.58 | 43d | 1 | 1.13mi |
| 2107 Grand Blvd #1207 Kansas City, MO | 1.0 | 1.5 | 900 | $2,250 | $2.50 | 7d | 1 | 1.13mi |
| 2029 Grand Blvd Kansas City, MO | 1.0 | 1.0 | 706 | $1,400 | $1.98 | 43d | 1 | 1.13mi |
| 2980 Baltimore Ave Kansas City, MO | 2.0 | 2.0 | 1225 | $2,354 | $1.92 | 43d | 5 | 1.19mi |
| 1200 Washington St Kansas City, MO | 1.0–2.0 | 1.0–2.0 | 1011 | $2,257 | $2.23 | 43d | 17 | 1.20mi |
| 1200 Washington St Kansas City, MO | 1.0–2.0 | 1.0–2.0 | 1093 | $2,324 | $2.13 | 2d | 16 | 1.20mi |
| 104 E 28 Ter Kansas City, MO | 1.0–2.0 | 1.0–2.5 | 1087 | $2,699 | $2.48 | 3d | 12 | 1.20mi |
| 103 E 28 Ter Kansas City, MO | 2.0 | 2.0 | 980 | $1,979 | $2.02 | 43d | 1 | 1.21mi |
| 3040 Baltimore Ave Kansas City, MO | 2.0 | 1.0–2.0 | 1363 | $5,999 | $4.40 | 1d | 75 | 1.24mi |
| 1601 Walnut St Kansas City, MO | 1.0 | 1.0 | 780 | $1,450 | $1.86 | 2d | 3 | 1.24mi |
| 1522 Walnut St Kansas City, MO | 1.0 | 1.0 | 659 | $1,378 | $2.09 | 23d | 3 | 1.25mi |
| 106 W 14th St Kansas City, MO | 1.0–2.0 | 1.0–2.0 | 1046 | $3,792 | $3.63 | 1d | 27 | 1.27mi |
| 1600 Grand Blvd Kansas City, MO | 2.0 | 2.0 | 1100 | $1,800 | $1.64 | 23d | 1 | 1.27mi |
| 1050 Jefferson St Kansas City, MO | 1.0–2.0 | 1.0–2.0 | 1166 | $2,683 | $2.30 | 2d | 17 | 1.28mi |
| 1050 Jefferson St Kansas City, MO | 1.0–2.0 | 1.0–2.0 | 1166 | $2,558 | $2.19 | 43d | 17 | 1.28mi |
| 1477 Main St Kansas City, MO | 2.0 | 1.0–2.5 | 1177 | $7,180 | $6.10 | 1d | 15 | 1.28mi |
| 2705 McGee Trfy Kansas City, MO | 3.0 | 1.0–2.0 | 1000 | $2,419 | $2.42 | 1d | 13 | 1.29mi |
| 105 E 30th St Unit 1C Kansas City, MO | 1.0 | 1.0 | 700 | $850 | $1.21 | 17d | 1 | 1.30mi |
| 1300 Baltimore Ave Kansas City, MO | 1.0 | 1.0 | 848 | $1,897 | $2.24 | 43d | 1 | 1.31mi |
| 1515 W 9th St Kansas City, MO | 2.0 | 1.0–2.0 | 706 | $1,675 | $2.37 | 1d | 49 | 1.32mi |
| 1918 Locust St Kansas City, MO | 2.0 | 1.0–2.0 | 734 | $1,957 | $2.67 | 1d | 32 | 1.32mi |
Listing history 20 events
-
2026-06-18days on market $135,000 Active 145 DOM
-
2026-06-17days on market $135,000 Active 144 DOM
-
2026-06-16days on market $135,000 Active 143 DOM
-
2026-06-15days on market $135,000 Active 142 DOM
-
2026-06-13remarks 493-char remark
-
2026-06-13days on market $135,000 Active 140 DOM
-
2026-06-09days on market $135,000 Active 136 DOM
-
2026-06-08days on market $135,000 Active 135 DOM
-
2026-06-07days on market $135,000 Active 134 DOM
-
2026-06-05days on market $135,000 Active 131 DOM
-
2026-06-03days on market $135,000 Active 130 DOM
-
2026-06-02days on market $135,000 Active 129 DOM
-
2026-06-01days on market $135,000 Active 128 DOM
-
2026-05-31days on market $135,000 Active 127 DOM
-
2026-04-13price $135,000 335-char remark
Show marketing remark (335 chars)
West End Treasure: 2 bedroom, one bath , bungalow nice size living , dinning, and kitchen. Laundry on the main level. Home backs up to a 6500 sq ft lot with its own address and utilities, located on a dead end street. Located close to the Crossroads Art District, River Market, Downtown, Crown Center, Liberty Memorial and The Plaza.
-
2026-01-25$250,000 Active 335-char remark
Show marketing remark (335 chars)
West End Treasure: 2 bedroom, one bath , bungalow nice size living , dinning, and kitchen. Laundry on the main level. Home backs up to a 6500 sq ft lot with its own address and utilities, located on a dead end street. Located close to the Crossroads Art District, River Market, Downtown, Crown Center, Liberty Memorial and The Plaza.
-
2026-01-17historical $250,000 335-char remark
Show marketing remark (335 chars)
West End Treasure: 2 bedroom, one bath , bungalow nice size living , dinning, and kitchen. Laundry on the main level. Home backs up to a 6500 sq ft lot with its own address and utilities, located on a dead end street. Located close to the Crossroads Art District, River Market, Downtown, Crown Center, Liberty Memorial and The Plaza.
-
2021-08-25status Pending 366-char remark
Show marketing remark (366 chars)
Listing includes 2322 Terrace Street Lot 12 and 13. The lots are located behind the house. A great place to build a garage. The Properties are being sold as is with no repairs. House currently rented and excellent tenant would like to stay. Current Tenant is paying $500 a month. Please follow the KCR Virus guidelines: Mask must be worn at time of interior showing.
-
2021-08-25historical 366-char remark
Show marketing remark (366 chars)
Listing includes 2322 Terrace Street Lot 12 and 13. The lots are located behind the house. A great place to build a garage. The Properties are being sold as is with no repairs. House currently rented and excellent tenant would like to stay. Current Tenant is paying $500 a month. Please follow the KCR Virus guidelines: Mask must be worn at time of interior showing.
-
2021-08-10$110,000 Active 366-char remark
Show marketing remark (366 chars)
Listing includes 2322 Terrace Street Lot 12 and 13. The lots are located behind the house. A great place to build a garage. The Properties are being sold as is with no repairs. House currently rented and excellent tenant would like to stay. Current Tenant is paying $500 a month. Please follow the KCR Virus guidelines: Mask must be worn at time of interior showing.
ⓘ Source: listings_history table (triggers on properties + properties_extension) + one-shot
backfill from property_details.listing_events for pre-trigger history.
Tax reassessment forecast MO · Resets to sale price
- Current annual tax
- $1,771 · $148/mo
- Projected year-2 tax
- $1,771 · $148/mo
- Expected delta
- $0/yr ($0/mo · 0.0%)
ⓘ Screening estimate from a state-policy table — verify with the county assessor before closing.
Climate risk First Street
- Flood 1/10 Low FEMA zone X (unshaded) · 0% chance over 30 yrs
- Wildfire 1/10 Low
- Heat 4/10 Moderate 7 d/yr ≥106°F today · 17 d/yr by 30 yrs out
- Wind 2/10 Low
- Air quality 3/10 Moderate 2 unhealthy d/yr today · 3 by 30 yrs out
Nearby sold comps map
Loading sold comps map…
Walkable amenities ~0.75 mi
Loading nearby amenities…
Taxation est. · year 1
- Rental income
- $24,238
- − Mortgage interest
- −$7,562
- − Property taxes
- −$1,771
- − Insurance
- −$675
- − Repairs & maintenance
- −$1,939
- − Management
- −$1,939
- − Depreciation
- −$3,927
- Taxable income
- $6,425
- Est. tax owed @ 24.0%
- −$1,542
- After-tax cash flow
- $6,665/yr
For passive investors: Depreciation is non-cash, so a rental often shows a tax loss while cash-flowing — sheltering income. Rental losses are passive: they offset passive income freely, and up to $25,000/yr can offset ordinary (W-2) income if you actively participate and your MAGI is under $100k (phasing out to $0 by $150k); unused losses carry forward. On sale, claimed depreciation is recaptured at up to 25%, and gains may owe capital-gains tax (a 1031 exchange can defer both). Figures are a year-1 estimate at your 24.0% rate — not tax advice; consult a CPA.
Schools (NCES district)
- District
- Kansas City 33
- NCES district ID
- 2916400
- Math proficiency
- 12% ▼ -8.00%
- Reading proficiency
- 24% ▬ 0.00%
- Median HH income
- $35,227
- Composite
- 14.8/100
- National rank
- #9387
- State rank
- #308 of 324 in MO
Livability — Kansas City
- Score
- 78/100
- State rank
- #28
- US rank
- #2671
Category grades
Schools grade is shown separately in the Schools card above.
Census & demographics
- Census place
- Kansas City, MO
- County
- Jackson County · 687,798 people
- City population
- 439,467
- Metro
- Kansas City, MO-KS
- Population (ZIP)
- 10,495
- Household income
- $80,551
- Rent vs Own
- Severe rent burden
- 864.0
Population outlook (Jackson County) Hauer SSP2
- Today (2025)
- 719,589 people
- By 2030
- 731,456 · +1.6%
- By 2040
- 746,689 · +3.8%
- By 2050
- 749,289 · +4.1%
- By 2075
- 736,227 · +2.3%
- By 2100
- 668,210 · -7.1%
Race, ethnicity, and origin ACS 2023
- Neighborhood character
- Diverse neighborhood (Simpson 0.65)
- Race & ethnicity
- White 50% Black 26% Hispanic / Latino 17% Two or more races 12% Asian 3%
- Hispanic origin (detail)
- Mexican 15%
- Common ancestry
- Italian 2% Lithuanian 2% Slovak 1%
- Foreign-born
- 6% · Canada
- Languages at home
- 88% English-only · Spanish 9% Arabic 1% French/Haitian/Cajun 1%
Political lean MEDSL · Jackson
- 2024 margin
- D (+19.3) · D 58.9% · R 39.5% · Other 1.6%
- 2008→2024 swing
- -6.1pp toward R · 2008: 25.4pp · 2024: 19.3pp
- All cycles
- 2024: D+19.3 2020: D+22.0 2016: D+16.6 2012: D+19.0 2008: D+25.4
Not yet ingested
- Civics
- —
Market trends
- HPI YoY
- ▼ -91.93%
- Current HPI
- 273.3599
- Rent YoY
- ▲ 0.44%
- Metro
- Kansas City, MO-KS
- State GDP YoY
- ▲ 1.84%
- F500 in state
- 20
Industry mix (Fortune 500 HQ in MO)
| Industry | F500 HQs | Revenue |
|---|---|---|
| Healthcare | 1 | $163B |
|
||
| Insurance | 1 | $21B |
|
||
| Industrial Technology | 1 | $17B |
|
||
| Retail | 1 | $16B |
|
||
| Industrial Distribution | 1 | $10B |
|
||
| Utilities | 1 | $9B |
|
||
Price history
+22.7% since first listed6 events — show timeline
- 2026-04-13 Price Changed $135,000 Heartland MLS as Distributed by MLS Grid
- 2026-01-25 Listed $250,000 Heartland MLS as Distributed by MLS Grid
- 2026-01-17 Coming Soon $250,000 Heartland MLS as Distributed by MLS Grid
- 2021-08-25 Pending — Heartland MLS as Distributed by MLS Grid
- 2021-08-25 Listing Removed — Heartland MLS as Distributed by MLS Grid
- 2021-08-10 Listed $110,000 Heartland MLS as Distributed by MLS Grid
Property tax history
+11.1%/yrLatest (2025): $1,771 · +13.7% YoY. Source: county tax records.
Cash-flow waterfall
monthlySold comps — $/sqft
last 12 mo · ≤1 miLoading sold comps…