 🏗️ New Construction
Barkley (Indian Oaks) Plan · Sellersburg, IN
Flood risk No data
- FEMA flood zone
- —
- Chance of flooding over 30 yrs
- —
- Est. flood insurance / yr
- —
Fire risk No data
- Est. fire insurance / yr
- —
Heat risk No data
- Hot days now (above threshold)
- —
- Hot days in 30 yrs
- —
Wind risk No data
- Chance of severe wind over 30 yrs
- —
Air-quality risk No data
- Unhealthy air days now
- —
- Unhealthy air days in 30 yrs
- —
Risk factors via First Street. Map © Google.
Why this score? — see what drove the D grade
The composite is a weighted blend of 9 inputs, each scored 0–100. Each bar is that input's sub-score; the figure is the points it added to the 100-point composite (weight × sub-score).
- 1% rule +10.0/10.0
- Cash flow +8.7/30.0
- ARV discount +7.5/15.0
- Schools +5.0/10.0
- Livability +3.7/5.0
- Rent growth +2.5/5.0
- DSCR +2.4/10.0
- Condition / age +1.0/5.0
- Appreciation +0.0/10.0
$65,995
🖨 Deal sheet (PDF) 📄 Offer letter ✓ Due diligence
Listing remarks MLS
Located just off the Salem exit of I-65 on the outskirts of Sellersburg, Indian Oaks Pointe is a community with lots of trees, character and charm that is just minutes from shopping, employment and schools Community Amenities Basketball Court, Clubhouse, and Playground Schools Silver Creek Elementary School, Silver Creek Middle School, and Silver Creek High School
Key facts
- Listed 237 days
Neighborhood map
What this means for you Summary
Snapshot
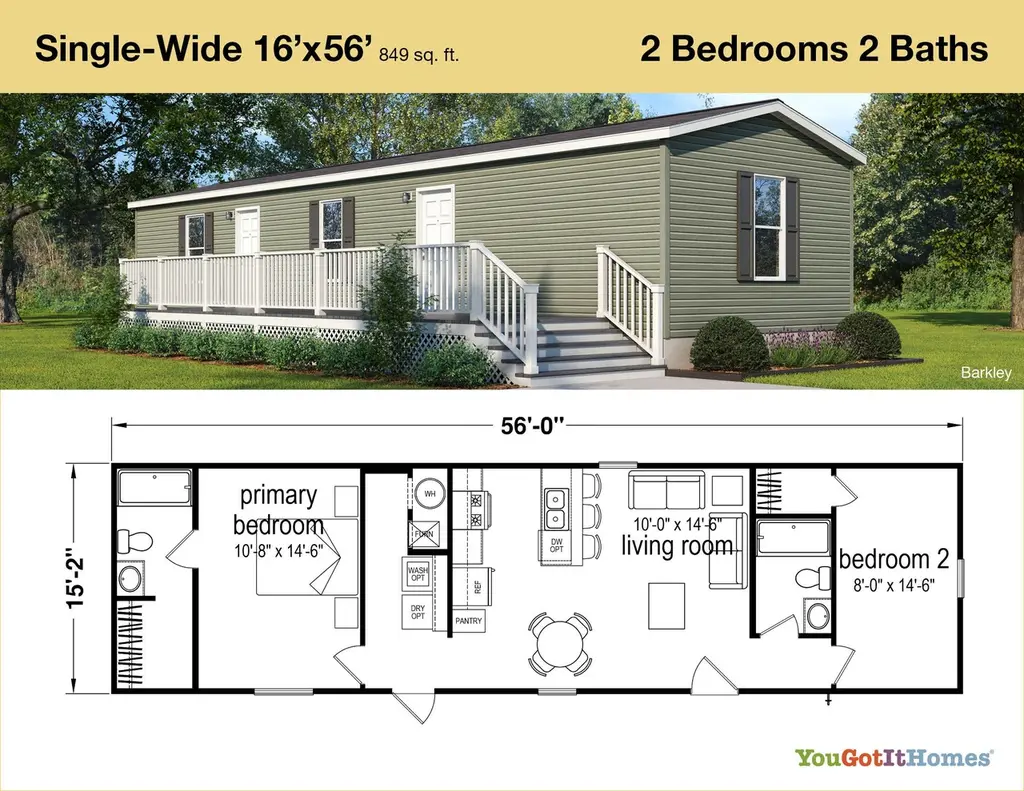
- This is a 2-bed/2.0-bath manufactured listed at $66k. Condition is rated poor.
Deal economics
- At list price, monthly cash flow is $-56 ($-671/yr) — negative.
- To cash-flow at today's rent, offer at most $58k (12.3% below list).
- Meets the 1% rule at list price ($1k rent vs $66k).
- Recommended offer: $58k (12.3% below list) — sets the bar for cash-flow.
- Cap rate 5.3% vs local median 3.9% in Sellersburg — top-decile yield for the area; either an underpriced asset or a hidden risk that comps aren't pricing in. Stress-test before assuming the spread holds.
Location & tenants
- Location reads 73/100 on livability (#85 in IN) — a middle-class / working-renter tenant base. Strengths: cost of living A+, housing A+, crime A-; Watch: commute D+, health & safety D+, amenities F.
- Zoned schools: Silver Creek Middle School (math 31% / reading 43%, grade F, #152 of 330 statewide, top 47%, 760 students, 33% FRL); Silver Creek High School (math 27% / reading 67%, grade D-, #143 of 369 statewide, top 44%, 935 students, 31% FRL).
- Market conditions: 149 active listings in the ZIP; 2 comparable units currently listed for rent nearby; solid renter incomes; 911 units permitted in Clark County in 2024 (133 in 5+ unit buildings).
- This rent is only 18% of the median local income ($83k/yr) — well below the 30% rent-burden line; pricing power to push rent on renewal without tenant pushback.
Forward outlook
- Local home prices are declining (-3.0%/yr); year-one equity from $456 of loan paydown is wiped out by about $2k of value loss. Plan a longer hold.
- Clark County population projected at +17% by 2050 — long-run rental-demand tailwind backs the buy-and-hold thesis.
Negotiation context
- It's been on market 237 days — a 12% lower offer ($58k) is reasonable based on typical stale-listing flexibility.
Risks & watch-outs
- Watch-outs: HOA is 46% of rent.
Questions for the listing agent
- What do current leases actually rent for vs. the listed asking? Can we see a recent rent roll and the last 12 months of T-12 income?
- It's been on market 237 days. Have you received any prior offers? Is the seller open to a 12% concession, seller financing, or rate buy-down credit?
- Have any recent inspections been done? Can we get a copy of the seller's disclosures and any deferred-maintenance estimates?
- What does the HOA fee cover, when was the last increase, and are there any pending special assessments or reserve-fund shortfalls?
- Why hasn't it sold? Are there any deal-killer items the seller is aware of (foundation, flood, title, zoning, code violations)?
- Is there a deadline driving the sale (1031 exchange, divorce, estate, relocation)? That informs how much negotiation room exists.
- Schools are D-rated, which usually means shorter tenancies and higher turnover. Who's the typical renter profile here, and what's been the actual vacancy rate?
- The area grade is low — what's the realistic commute time and amenity access for the typical tenant pool here? Any planned neighborhood developments (good or bad) we should know about?
- What's the average days-on-market for RENTAL listings here right now (not sales)? A rising rental-DOM trend means longer vacancies and softer asking-rent achievability than the comps imply.
- What's the recent tenant-quality profile in this submarket — average credit score on applications, eviction rate, late-payment / NSF rate, and stable-employment percentage? A property-management company in the area should have these aggregated.
- How much new for-sale + rental construction is in the pipeline within 1–3 miles? Heavy new supply typically softens prices + rents 12–24 months out; constrained supply supports both.
Investment metrics
- 1% rule
- 1.84% ✓
- Cap rate
- 5.28%
- Cash-on-cash
- -3.63%
- DSCR
- 0.84
- GRM
- 4.5
CMA / ARV
No comps found within radius.
Projected returns pro-forma
-3.0% appreciation · 3.0% rent growth · sell at horizon
- IRR
- -21.6%
- Equity multiple
- 0.25×
- Total profit
- $-13,892
- Equity at exit
- $9,840
- IRR
- -13.8%
- Equity multiple
- 0.18×
- Total profit
- $-15,209
- Equity at exit
- $5,706
Cash invested: $18,479 (down + closing). Projections, not guarantees.
Landlord ↔ Tenant lean methodology
- Overall (STATE)
- 90 Strongly Landlord-Friendly
- State Indiana
- 90 Strongly Landlord-Friendly · R+11
- County
- — inherits STATE
- City
- — inherits STATE
ZIP-level market 47172
- Active inventory
- 149
- Price-to-rent
- 4.5×
Monthly cashflow live
- Estimated rent
- $1,215 medium interval (Pro) →
- Mortgage (P&I)
- −$346
- Tax est. 1.5%
- −$82 /mo · $990/yr
- Insurance
- −$27
- HOA
- −$560
- Vacancy / Maint / Mgmt
- −$255
- Net cashflow
- $-56
Break-even live
Sensitivity live
| Price | -10% $-10 | -5% $-33 | +0% $-56 | +5% $-79 | +10% $-102 |
|---|---|---|---|---|---|
| Rent | -10% $-152 | -5% $-104 | +0% $-56 | +5% $-8 | +10% $40 |
| Rate | -1.0pp $-23 | -0.5pp $-39 | base $-56 | +0.5pp $-73 | +1.0pp $-90 |
UW: 25.0% down · 7.5% · 30yr · 1.5% tax · 5.0% vac · 8.0% maint · 8.0% mgmt
Financing live
Cash to close
- Down payment
- $16,499
- Closing costs
- $1,980
- Reserves months
- —
- Total cash needed
- —
Loan-product check · same deal, 3 products live
Conventional
25% down · 7.5% · 30yr
- Down + closing
- —
- Monthly P&I
- —
- Monthly cashflow
- —
- DSCR
- —
- Eligible?
- —
Personal DTI + credit; lowest rate.
DSCR
20% down · 8.5% · 30yr
- Down + closing
- —
- Monthly P&I
- —
- Monthly cashflow
- —
- DSCR
- —
- Eligible?
- —
No personal income docs; deal must DSCR.
Hard money
10% down · 12.0% · 12mo
- Down + closing
- —
- Monthly P&I
- —
- Monthly cashflow
- —
- DSCR
- —
- Eligible?
- —
Short-term bridge; refi at stabilization.
Rent comps 2 comps
| Address | Beds | Baths | Sqft | Rent | $/sqft | DOM | Units | Dist |
|---|---|---|---|---|---|---|---|---|
| 7000 Lake Dr Sellersburg, IN | 1.0–3.0 | 1.0–2.0 | 1004 | $1,156 | $1.15 | 3d | 1 | 0.57mi |
| 7722 Sellersburg, IN | 1.0–2.0 | 1.0–2.0 | 933 | $1,143 | $1.23 | 3d | 12 | 0.59mi |
HOA detail
- Monthly dues
- $560 · $6,720/yr
Listing history 15 events
-
2026-06-21days on market $65,995 Active 237 DOM
-
2026-06-18days on market $65,995 Active 234 DOM
-
2026-06-17days on market $65,995 Active 233 DOM
-
2026-06-16days on market $65,995 Active 232 DOM
-
2026-06-15days on market $65,995 Active 231 DOM
-
2026-06-13days on market $65,995 Active 229 DOM
-
2026-06-10days on market $65,995 Active 226 DOM
-
2026-06-09days on market $65,995 Active 225 DOM
-
2026-06-08days on market $65,995 Active 224 DOM
-
2026-06-07days on market $65,995 Active 223 DOM
-
2026-06-03days on market $65,995 Active 219 DOM
-
2026-06-02days on market $65,995 Active 218 DOM
-
2026-06-01days on market $65,995 Active 217 DOM
-
2026-05-31days on market $65,995 Active 216 DOM
-
2025-10-27$65,995 Active 368-char remark
Show marketing remark (368 chars)
Located just off the Salem exit of I-65 on the outskirts of Sellersburg, Indian Oaks Pointe is a community with lots of trees, character and charm that is just minutes from shopping, employment and schools Community Amenities Basketball Court, Clubhouse, and Playground Schools Silver Creek Elementary School, Silver Creek Middle School, and Silver Creek High School
ⓘ Source: listings_history table (triggers on properties + properties_extension) + one-shot
backfill from property_details.listing_events for pre-trigger history.
Nearby sold comps map
Loading sold comps map…
Walkable amenities ~0.75 mi
Loading nearby amenities…
Taxation est. · year 1
- Rental income
- $14,585
- − Mortgage interest
- −$3,697
- − Property taxes
- −$990
- − Insurance
- −$330
- − Repairs & maintenance
- −$1,167
- − Management
- −$1,167
- − HOA
- −$6,720
- − Depreciation
- −$1,920
- Taxable loss
- −$1,405
- Est. tax savings @ 24.0%
- +$337
- After-tax cash flow
- $-334/yr
For passive investors: Depreciation is non-cash, so a rental often shows a tax loss while cash-flowing — sheltering income. Rental losses are passive: they offset passive income freely, and up to $25,000/yr can offset ordinary (W-2) income if you actively participate and your MAGI is under $100k (phasing out to $0 by $150k); unused losses carry forward. On sale, claimed depreciation is recaptured at up to 25%, and gains may owe capital-gains tax (a 1031 exchange can defer both). Figures are a year-1 estimate at your 24.0% rate — not tax advice; consult a CPA.
Condition & rehab AI · 1 photo
This manufactured home requires extensive repairs and updates to bring it up to a livable condition. Significant structural and aesthetic issues need addressing to increase its resale or rental value.
Repairs flagged
- Major cabinets — Severe damage
- Major roof — Significant damage
- Major exterior siding — Severe peeling
- Major flooring — Worn and damaged
- Major paint — Dirty and peeling
- Major windows — Dirty and damaged
- Major HVAC — Exposed and damaged components
Value-add opportunities
- Both exterior painting and siding repair — Enhances curb appeal and value
- Both HVAC replacement — Improves comfort and energy efficiency
- Both kitchen and bathroom renovations — Updates key living spaces
Renovation cost estimate screening
| Repair item | Severity | Est. cost |
|---|---|---|
| cabinets · Severe damage | Major | $15,000–50,000 |
| roof · Significant damage | Major | $15,000–50,000 |
| exterior siding · Severe peeling | Major | $15,000–50,000 |
| flooring · Worn and damaged | Major | $15,000–50,000 |
| paint · Dirty and peeling | Major | $15,000–50,000 |
| windows · Dirty and damaged | Major | $15,000–50,000 |
| HVAC · Exposed and damaged components | Major | $15,000–50,000 |
| Total estimated repair cost · 7 items | $105,000–350,000 |
Value-add ROI direction
- Both exterior painting and siding repair — Enhances curb appeal and value ↑
- Both HVAC replacement — Improves comfort and energy efficiency ↑
- Both kitchen and bathroom renovations — Updates key living spaces ↑
ⓘ Cost ranges are severity-bucket heuristics (US national rule-of-thumb). Get contractor quotes + a written scope before underwriting a rehab budget.
Schools (NCES district)
No district data.
Livability — Sellersburg
- Score
- 73/100
- State rank
- #85
- US rank
- #5005
Category grades
Schools grade is shown separately in the Schools card above.
Census & demographics
- Census place
- Sellersburg, IN
- County
- Clark County · 108,879 people
- City population
- 21,045
- Metro
- Louisville/Jefferson County, KY-IN
- Population (ZIP)
- 21,045
- Household income
- $82,503
- Rent vs Own
- Severe rent burden
- 250.0
Population outlook (Clark County) Hauer SSP2
- Today (2025)
- 126,401 people
- By 2030
- 131,455 · +4.0%
- By 2040
- 140,471 · +11.1%
- By 2050
- 147,677 · +16.8%
- By 2075
- 161,702 · +27.9%
- By 2100
- 164,078 · +29.8%
Race, ethnicity, and origin ACS 2023
- Neighborhood character
- Predominantly White (90%)
- Race & ethnicity
- White 90% Two or more races 7% Hispanic / Latino 3% Asian 2%
- Common ancestry
- Romanian 2% Slovak 2% Italian 2%
- Foreign-born
- 3% · Canada
- Languages at home
- 96% English-only · Spanish 2% Vietnamese 1% Other Indo-European 1%
Political lean MEDSL · Clark
- 2024 margin
- Strong R (+20.4) · D 38.9% · R 59.3% · Other 1.8%
- 2008→2024 swing
- -13.3pp toward R · 2008: -7.1pp · 2024: -20.4pp
- All cycles
- 2024: R+20.4 2020: R+18.3 2016: R+22.0 2012: R+9.9 2008: R+7.1
Not yet ingested
- Civics
- —
Market trends
- HPI YoY
- ▼ -114.50%
- Current HPI
- 173.6209
- Rent YoY
- —
- Metro
- Louisville/Jefferson County, KY-IN
- State GDP YoY
- ▲ 2.90%
- F500 in state
- 18
Industry mix (Fortune 500 HQ in IN)
| Industry | F500 HQs | Revenue |
|---|---|---|
| Industrial Machinery | 2 | $37B |
|
||
| Healthcare | 1 | $177B |
|
||
| Pharmaceuticals | 1 | $45B |
|
||
| Metals / Steel | 1 | $18B |
|
||
| Agriculture | 1 | $17B |
|
||
| Packaging | 1 | $12B |
|
||
Price history
1 event — show timeline
- 2025-10-27 Listed $65,995 Zillow
Cash-flow waterfall
monthlySold comps — $/sqft
last 12 mo · ≤1 miLoading sold comps…