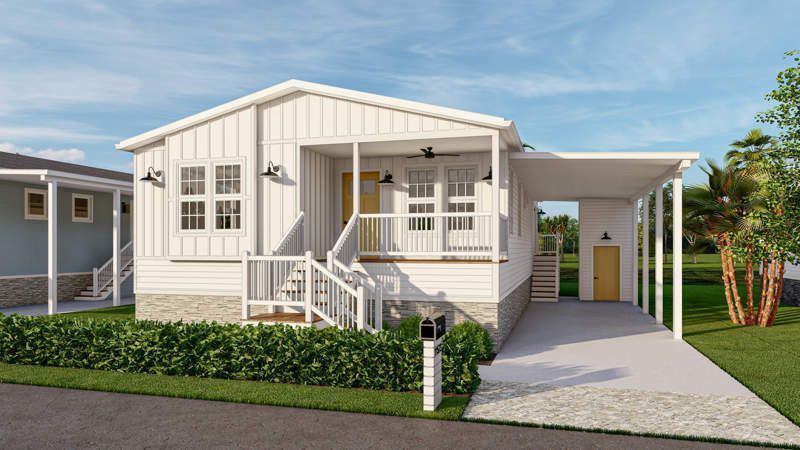
11550 Palm Dr · Iona, FL
Flood risk 9/10 · Severe
- FEMA flood zone
- AE
- Chance of flooding over 30 yrs
- 0.99%
- Est. flood insurance / yr
- $1,737 – $8,500
Fire risk 1/10 · Minimal
- Est. fire insurance / yr
- $947 – $1,759
Heat risk 10/10 · Severe
- Hot days now (above 107°F)
- 7 days/yr
- Hot days in 30 yrs
- 29 days/yr
Wind risk 10/10 · Severe
- Chance of severe wind over 30 yrs
- 99.0%
Air-quality risk 2/10 · Minimal
- Unhealthy air days now
- 1 days/yr
- Unhealthy air days in 30 yrs
- 1 days/yr
Risk factors via First Street. Map © Google.
Why this score? — see what drove the B- grade
The composite is a weighted blend of 9 inputs, each scored 0–100. Each bar is that input's sub-score; the figure is the points it added to the 100-point composite (weight × sub-score).
- Cash flow +30.0/30.0
- DSCR +10.0/10.0
- 1% rule +9.2/10.0
- ARV discount +7.5/15.0
- Schools +4.1/10.0
- Livability +3.6/5.0
- Condition / age +2.5/5.0
- Rent growth +2.2/5.0
- Appreciation +0.0/10.0
$194,900
🖨 Deal sheet 📄 Offer letter ✓ Due diligence
Key facts
- Built 2025
- Listed 355 days
Property features AI
Finance
- Financial info: List price $194,900
Exterior
- Home design: Single-family property (spec new construction); Address: 11550 Palm Dr, Fort Myers FL 33908
Interior
- Bedrooms: 2 bedrooms
- Bathrooms: 2 full bathrooms
- Interior features: Living area of 1415
Neighborhood map
What this means for you Summary
Snapshot
- This is a 2-bed/2.0-bath manufactured listed at $195k.
Deal economics
- At list price, monthly cash flow is $411 ($5k/yr) — positive.
- The deal already cash-flows at list — no discount required.
- Meets the 1% rule at list price ($3k rent vs $195k).
- Recommended offer: $172k (12.0% below list) — sets the bar for market timing.
- Cap rate 11.5% vs local median 2.1% in Iona — top-decile yield for the area; either an underpriced asset or a hidden risk that comps aren't pricing in. Stress-test before assuming the spread holds.
Location & tenants
- Location reads 72/100 on livability (#359 in FL) — a middle-class / working-renter tenant base. Strengths: crime A+, housing A, health & safety A; Watch: schools D-, amenities F, commute F.
- Lee (suburban): math 47% / reading 50% proficiency, ranked #42 of 73 in FL (top 58%) — families likely to look elsewhere, expect single-tenant / working-renter base with shorter leases.
- Market conditions: Rents soft (-1.2%/yr); 1244 active listings in the ZIP; 40 comparable units currently listed for rent nearby; rentals at typical pace (median 24d on market — plan ~3-4 weeks tenant-placement turnaround); solid renter incomes; 15,411 units permitted in Lee County in 2024 (4,686 in 5+ unit buildings).
- This rent runs 44% of the median local income ($75k/yr) — at the standard rent-burdened threshold; future hikes will face affordability resistance.
Forward outlook
- Local home prices are declining (-3.0%/yr); year-one equity from $1k of loan paydown is wiped out by about $6k of value loss. Plan a longer hold.
- Lee County population projected at +44% by 2050 — long-run rental-demand tailwind backs the buy-and-hold thesis.
Negotiation context
- It's been on market 355 days — a 12% lower offer ($172k) is reasonable based on typical stale-listing flexibility.
Risks & watch-outs
- Watch-outs: flood insurance adds $427/mo.
- Climate carrying-cost: in FEMA flood zone AE (mandatory federal flood insurance); severe wind risk, 99% chance of damaging wind over 30y; extreme-heat days projected 7→29/yr by 2055 (HVAC capex compounding) — expect insurance premiums to compound above CPI over the hold.
Questions for the listing agent
- It's been on market 355 days. Have you received any prior offers? Is the seller open to a 12% concession, seller financing, or rate buy-down credit?
- What's the actual annual flood-insurance premium (NFIP or private), and is the property in a SFHA with mandatory coverage?
- Why hasn't it sold? Are there any deal-killer items the seller is aware of (foundation, flood, title, zoning, code violations)?
- Is there a deadline driving the sale (1031 exchange, divorce, estate, relocation)? That informs how much negotiation room exists.
- Schools are D-rated, which usually means shorter tenancies and higher turnover. Who's the typical renter profile here, and what's been the actual vacancy rate?
- What's the average days-on-market for RENTAL listings here right now (not sales)? A rising rental-DOM trend means longer vacancies and softer asking-rent achievability than the comps imply.
- What's the recent tenant-quality profile in this submarket — average credit score on applications, eviction rate, late-payment / NSF rate, and stable-employment percentage? A property-management company in the area should have these aggregated.
- How much new for-sale + rental construction is in the pipeline within 1–3 miles? Heavy new supply typically softens prices + rents 12–24 months out; constrained supply supports both.
Investment metrics
- 1% rule
- 1.42% ✓
- Cap rate
- 11.45%
- Cash-on-cash
- 18.42%
- DSCR
- 1.82
- GRM
- 5.9
CMA / ARV
No comps found within radius.
Projected returns pro-forma
-3.0% appreciation · 0.0% rent growth · sell at horizon
- IRR
- -6.8%
- Equity multiple
- 0.76×
- Total profit
- $-13,195
- Equity at exit
- $29,060
- IRR
- -2.6%
- Equity multiple
- 0.86×
- Total profit
- $-7,854
- Equity at exit
- $16,851
Cash invested: $54,572 (down + closing). Projections, not guarantees.
Landlord ↔ Tenant lean methodology
- Overall (STATE)
- 87 Strongly Landlord-Friendly
- State Florida
- 87 Strongly Landlord-Friendly · R+3
- County
- — inherits STATE
- City
- — inherits STATE
ZIP-level market 33908
- Home prices YoY
- -32.8%
- Rents YoY
- -1.2%
- Active inventory
- 1244
- Price-to-rent
- 5.9×
Monthly cashflow live
- Estimated rent
- $2,765 high interval (Pro) →
- Mortgage (P&I)
- −$1,022
- Tax est. 1.5%
- −$244 /mo · $2,924/yr
- Insurance
- −$81
- Flood insurance flood zone
- −$427 /mo · $5,118/yr
- HOA
- −$0
- Vacancy / Maint / Mgmt
- −$581
- Net cashflow
- $411
Break-even live
UW: 25.0% down · 7.5% · 30yr · 1.5% tax · 5.0% vac · 8.0% maint · 8.0% mgmt
Financing live
Cash to close
- Down payment
- $48,725
- Closing costs
- $5,847
- Reserves months
- —
- Total cash needed
- —
Loan-product check · same deal, 3 products live
Conventional
25% down · 7.5% · 30yr
- Down + closing
- —
- Monthly P&I
- —
- Monthly cashflow
- —
- DSCR
- —
- Eligible?
- —
Personal DTI + credit; lowest rate.
DSCR
20% down · 8.5% · 30yr
- Down + closing
- —
- Monthly P&I
- —
- Monthly cashflow
- —
- DSCR
- —
- Eligible?
- —
No personal income docs; deal must DSCR.
Hard money
10% down · 12.0% · 12mo
- Down + closing
- —
- Monthly P&I
- —
- Monthly cashflow
- —
- DSCR
- —
- Eligible?
- —
Short-term bridge; refi at stabilization.
Rent comps 40 comps
| Address | Beds | Baths | Sqft | Rent | $/sqft | DOM | Units | Dist |
|---|---|---|---|---|---|---|---|---|
| 7 Birch Blvd Fort Myers, FL | 3.0 | 2.0 | 1280 | $1,600 | $1.25 | 23d | 1 | 0.22mi |
| 11596 Palm Dr Fort Myers, FL | 3.0 | 2.0 | 1394 | $2,450 | $1.76 | 23d | 1 | 0.24mi |
| 12641 Kelly Sands Way #225 Fort Myers, FL | 2.0 | 2.0 | 1069 | $5,000 | $4.68 | 23d | 1 | 0.37mi |
| 12621 Kelly Sands Way #305 Fort Myers, FL | 2.0 | 2.0 | 1106 | $5,000 | $4.52 | 23d | 1 | 0.39mi |
| 12540 Kelly Greens Blvd #331 Fort Myers, FL | 2.0 | 2.0 | 1440 | $2,100 | $1.46 | 23d | 1 | 0.45mi |
| 12396 Kelly Sands Way Fort Myers, FL | 2.0 | 2.0 | 1511 | $2,800 | $1.85 | 23d | 1 | 0.47mi |
| 12171 Kelly Sands Way #1577 Fort Myers, FL | 2.0 | 2.0 | 1160 | $4,500 | $3.88 | 23d | 1 | 0.55mi |
| 16252 Kelly Woods Dr Fort Myers, FL | 2.0 | 2.0 | 1515 | $6,000 | $3.96 | 23d | 1 | 0.59mi |
| 16301 Kelly Woods Dr #205 Fort Myers, FL | 2.0 | 2.0 | 1336 | $5,000 | $3.74 | 23d | 1 | 0.61mi |
| 12150 Kelly Sands Way Fort Myers, FL | 2.0 | 2.0 | 1087 | $3,325 | $3.06 | 3d | 3 | 0.63mi |
| 12150 Kelly Sands Way Fort Myers, FL | 2.0 | 2.0 | 1087 | $4,700 | $4.32 | 23d | 2 | 0.63mi |
| 12250 Kelly Greens Blvd #57 Fort Myers, FL | 2.0 | 2.0 | 1336 | $1,999 | $1.50 | 23d | 1 | 0.63mi |
| 16126 Kelly Woods Dr Fort Myers, FL | 3.0 | 2.0 | 1564 | $5,800 | $3.71 | 3d | 1 | 0.70mi |
| 16470 Kelly Cove Dr #2850 Fort Myers, FL | 2.0 | 2.0 | 1216 | $5,000 | $4.11 | 23d | 1 | 0.73mi |
| 16470 Kelly Cove Dr Fort Myers, FL | 2.0 | 2.0 | 1214 | $3,550 | $2.92 | 3d | 2 | 0.73mi |
| 16500 Kelly Cove Dr #2880 Fort Myers, FL | 2.0 | 2.0 | 1283 | $4,800 | $3.74 | 23d | 1 | 0.74mi |
| 16001 Bayside Pointe Fort Myers, FL | 1.0–3.0 | 1.0–2.0 | 1135 | $1,888 | $1.66 | 2d | 18 | 0.75mi |
| 16821 Sanibel Sunset Ct #203 Fort Myers, FL | 2.0 | 2.0 | 1271 | $1,750 | $1.38 | 10d | 1 | 0.76mi |
| 13502 Siesta Pines Ct #402 Fort Myers, FL | 2.0 | 2.0 | 955 | $1,475 | $1.54 | 14d | 1 | 0.77mi |
| 20021 Sanibel View Cir #105 Fort Myers, FL | 2.0 | 2.0 | 1417 | $4,800 | $3.39 | 23d | 1 | 0.80mi |
| 13426 Pine Needle Ln Fort Myers, FL | 2.0 | 1.0 | 922 | $1,275 | $1.38 | 21d | 1 | 0.80mi |
| 13430 Pine Needle Ln Fort Myers, FL | 2.0 | 1.0 | 922 | $1,200 | $1.30 | 3d | 1 | 0.80mi |
| 13527 Siesta Pines Ct Fort Myers, FL | 2.0 | 2.5 | 1244 | $1,900 | $1.53 | 23d | 1 | 0.82mi |
| 13460 Causeway Palms Cv Fort Myers, FL | 2.0 | 2.0 | 1509 | $3,400 | $2.25 | 23d | 1 | 0.83mi |
| 13533 Siesta Pines Ct Fort Myers, FL | 2.0 | 3.0 | 1246 | $1,800 | $1.44 | 23d | 1 | 0.83mi |
| 13420 Hidden Palms Cv Fort Myers, FL | 2.0 | 2.0 | 1450 | $1,600 | $1.10 | 23d | 1 | 0.84mi |
| 20031 Sanibel View Cir #106 Fort Myers, FL | 2.0 | 2.0 | 1591 | $3,700 | $2.33 | 3d | 1 | 0.84mi |
| 20031 Sanibel View Cir #106 Fort Myers, FL | 2.0 | 2.0 | 1591 | $3,450 | $2.17 | 3d | 1 | 0.84mi |
| 16881 Davis Rd Fort Myers, FL | 1.0–2.0 | 1.0–2.0 | 767 | $1,800 | $2.35 | 16d | 3 | 0.86mi |
| 16881 Davis Rd Fort Myers, FL | 2.0 | 1.0–2.0 | 837 | $1,600 | $1.91 | 3d | 2 | 0.86mi |
| 11861 Caraway Ln #116 Fort Myers, FL | 2.0 | 2.0 | 1056 | $1,995 | $1.89 | 19d | 1 | 0.89mi |
| 16120 Dublin Cir Unit A Fort Myers, FL | 2.0 | 2.0 | 1517 | $1,550 | $1.02 | 23d | 1 | 0.92mi |
| 11140 Caravel Cir #109 Fort Myers, FL | 2.0 | 2.0 | 1050 | $4,200 | $4.00 | 23d | 1 | 0.93mi |
| 15761 Windward Way Cir #3302 Fort Myers, FL | 2.0 | 2.0 | 1050 | $4,500 | $4.29 | 3d | 1 | 0.94mi |
| 15999 Mandolin Bay Dr #202 Fort Myers, FL | 2.0 | 2.0 | 1152 | $1,775 | $1.54 | 23d | 1 | 0.94mi |
| 11110 Caravel Cir #201 Fort Myers, FL | 2.0 | 2.0 | 1050 | $3,500 | $3.33 | 23d | 1 | 0.95mi |
| 15989 Mandolin Bay Dr Fort Myers, FL | 2.0 | 2.0 | 1152 | $1,695 | $1.47 | 23d | 1 | 0.96mi |
| 15770 Windward Way Cir #2205 Fort Myers, FL | 2.0 | 2.0 | 1050 | $1,600 | $1.52 | 23d | 1 | 0.97mi |
| 12866 Iona Rd Fort Myers, FL | 3.0 | 2.0 | 1666 | $2,850 | $1.71 | 13d | 1 | 1.02mi |
| 11701 Olivetti Ln Unit 210 Fort Myers, FL | 2.0 | 2.0 | 1305 | $4,500 | $3.45 | 23d | 1 | 1.02mi |
Climate risk First Street
- Flood 9/10 Extreme FEMA zone AE · 99% chance over 30 yrs
- Wildfire 1/10 Low
- Heat 10/10 Extreme 7 d/yr ≥107°F today · 29 d/yr by 30 yrs out
- Wind 10/10 Extreme 99% chance of damaging wind over 30 yrs
- Air quality 2/10 Low 1 unhealthy d/yr today · 1 by 30 yrs out
Nearby sold comps map
Loading sold comps map…
Walkable amenities ~0.75 mi
Loading nearby amenities…
Taxation est. · year 1
- Rental income
- $33,184
- − Mortgage interest
- −$10,917
- − Property taxes
- −$2,924
- − Insurance
- −$6,093
- − Repairs & maintenance
- −$2,655
- − Management
- −$2,655
- − Depreciation
- −$5,670
- Taxable income
- $2,271
- Est. tax owed @ 24.0%
- −$545
- After-tax cash flow
- $4,389/yr
For passive investors: Depreciation is non-cash, so a rental often shows a tax loss while cash-flowing — sheltering income. Rental losses are passive: they offset passive income freely, and up to $25,000/yr can offset ordinary (W-2) income if you actively participate and your MAGI is under $100k (phasing out to $0 by $150k); unused losses carry forward. On sale, claimed depreciation is recaptured at up to 25%, and gains may owe capital-gains tax (a 1031 exchange can defer both). Figures are a year-1 estimate at your 24.0% rate — not tax advice; consult a CPA.
Schools (NCES district)
- District
- Lee
- NCES district ID
- 1201080
- Math proficiency
- 47% ▼ -11.00%
- Reading proficiency
- 50% ▼ -4.00%
- Median HH income
- $49,518
- Composite
- 41.49/100
- National rank
- #3458
- State rank
- #42 of 73 in FL
Livability — Iona
- Score
- 72/100
- State rank
- #359
- US rank
- #6253
Category grades
Schools grade is shown separately in the Schools card above.
Census & demographics
- Census place
- Iona, FL
- County
- Lee County · 788,662 people
- Metro
- Cape Coral-Fort Myers, FL
- Population (ZIP)
- 37,423
- Household income
- $75,396
- Rent vs Own
- Severe rent burden
- 1944.0
Population outlook (Lee County) Hauer SSP2
- Today (2025)
- 871,946 people
- By 2030
- 955,468 · +9.6%
- By 2040
- 1,113,587 · +27.7%
- By 2050
- 1,256,891 · +44.1%
- By 2075
- 1,560,270 · +78.9%
- By 2100
- 1,726,848 · +98.0%
Race, ethnicity, and origin ACS 2023
- Neighborhood character
- Predominantly White (88%)
- Race & ethnicity
- White 88% Hispanic / Latino 6% Two or more races 5% Black 3% Asian 1%
- Hispanic origin (detail)
- Mexican 1% Puerto Rican 2%
- Common ancestry
- Romanian 5% Lithuanian 4% Slovak 3%
- Foreign-born
- 10% · Canada, Jamaica
- Languages at home
- 90% English-only · Spanish 4% Russian/Polish/Slavic 1% Other Indo-European 1%
Political lean MEDSL · Lee
- 2024 margin
- Strong R (+28.4) · D 35.5% · R 63.9%
- 2008→2024 swing
- -18.0pp toward R · 2008: -10.4pp · 2024: -28.4pp
- All cycles
- 2024: R+28.4 2020: R+19.2 2016: R+20.4 2012: R+16.6 2008: R+10.4
Not yet ingested
- Civics
- —
Market trends
- HPI YoY
- ▼ -102.22%
- Current HPI
- 209.7595
- Rent YoY
- ▼ -1.18%
- Metro
- Cape Coral-Fort Myers, FL
- State GDP YoY
- ▲ 3.28%
- F500 in state
- 36
Industry mix (Fortune 500 HQ in FL)
| Industry | F500 HQs | Revenue |
|---|---|---|
| Industrial Technology | 2 | $29B |
|
||
| Insurance | 2 | $17B |
|
||
| Retail | 1 | $60B |
|
||
| Technology Distribution | 1 | $58B |
|
||
| Homebuilding | 1 | $35B |
|
||
| Technology Manufacturing | 1 | $35B |
|
||
Cash-flow waterfall
monthlySold comps — $/sqft
last 12 mo · ≤1 miLoading sold comps…