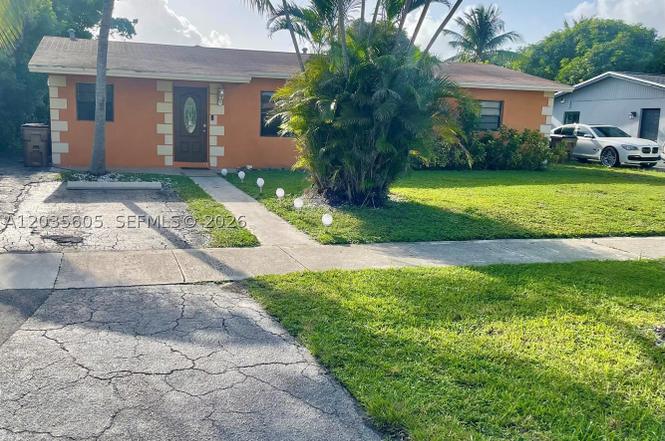
1260 SW 6th Ave · Deerfield Beach, FL
Flood risk 1/10 · Minimal
- FEMA flood zone
- X (shaded)
- Chance of flooding over 30 yrs
- 0.0%
- Est. flood insurance / yr
- $507 – $1,088
Fire risk 1/10 · Minimal
- Est. fire insurance / yr
- $947 – $1,759
Heat risk 10/10 · Severe
- Hot days now (above 107°F)
- 7 days/yr
- Hot days in 30 yrs
- 27 days/yr
Wind risk 10/10 · Severe
- Chance of severe wind over 30 yrs
- 99.0%
Air-quality risk 2/10 · Minimal
- Unhealthy air days now
- 1 days/yr
- Unhealthy air days in 30 yrs
- 3 days/yr
Risk factors via First Street. Map © Google.
Why this score? — see what drove the C- grade
The composite is a weighted blend of 9 inputs, each scored 0–100. Each bar is that input's sub-score; the figure is the points it added to the 100-point composite (weight × sub-score).
- ARV discount +15.0/15.0
- Cash flow +14.9/30.0
- DSCR +4.6/10.0
- Schools +4.1/10.0
- Livability +3.8/5.0
- 1% rule +3.2/10.0
- Rent growth +3.0/5.0
- Condition / age +2.5/5.0
- Appreciation +0.0/10.0
$345,000
🖨 Deal sheet (PDF) 📄 Offer letter ✓ Due diligence
Listing remarks
Great opportunity for investors, renovators, or buyers looking to add value. This home offers solid potential but requires repairs and updating. Property is being sold as-is, with seller making no repairs. Buyers are encouraged to conduct their own inspections and verify all information. NO FHA
Key facts
- 7,140 sq ft lot
- 2 parking spots
- Built 1973
Property features AI
Exterior
- Utilities: No utilities listed
- Home design: Single family residence; Single-story
- Construction: Concrete construction
- Exterior features: Not waterfront; No fixed-bridge waterfront features (property not waterfront)
Interior
- Kitchen: Dishwasher; Microwave; Refrigerator
- Bedrooms: 3 bedrooms on the main level
- Flooring: Wood flooring
- Bathrooms: 1 full bathroom
- Heating & cooling: Central heating; Central air; Ceiling fan(s)
- Interior features: No special interior features listed; Unfurnished
Neighborhood map
What this means for you Summary
Snapshot
- This is a 3-bed/3.0-bath single-family listed at $345k.
Deal economics
- At list price, monthly cash flow is $101 ($1k/yr) — positive.
- The deal already cash-flows at list — no discount required.
- To meet the 1% rule (rent ≥ 1% of price), the offer needs to be $284k (17.8% below list).
- Recommended offer: $284k (17.8% below list) — sets the bar for 1% rule.
- Cap rate 6.6% vs local median 4.1% in Deerfield Beach — top-decile yield for the area; either an underpriced asset or a hidden risk that comps aren't pricing in. Stress-test before assuming the spread holds.
Location & tenants
- Location reads 75/100 on livability (#250 in FL, #3,970 nationally) — a middle-class / working-renter tenant base. Strengths: housing A+, health & safety A+, cost of living A; Watch: amenities D-, employment D-.
- Broward (suburban): math 42% / reading 53% proficiency, ranked #46 of 73 in FL (top 63%) — families likely to look elsewhere, expect single-tenant / working-renter base with shorter leases.
- Zoned schools: Nova Blanche Forman Elementary (math 35% / reading 55%, grade D-, #1,271 of 2,144 statewide, top 60%, 769 students, 72% FRL); Nova Middle School (math 44% / reading 53%, grade C-, #274 of 571 statewide, top 50%, 1,284 students, 68% FRL); Deerfield Beach High School (math 12% / reading 37%, grade F, #505 of 667 statewide, top 79%, 2,251 students, 69% FRL) — zoned schools average 69% FRL vs 51% district-wide (18 pts higher); higher-poverty schools than district average — tighter screening recommended.
- Market conditions: Rents rising (+2.2%/yr); 300 active listings in the ZIP; 40 comparable units currently listed for rent nearby; rentals at typical pace (median 26d on market — plan ~3-4 weeks tenant-placement turnaround); 2,111 units permitted in Broward County in 2024 (1,265 in 5+ unit buildings).
- At $2,837/mo this rent would consume 58% of the median local household income ($59k/yr) (locally 2148% of renters already pay >50% of income on rent) — very limited rent-growth headroom before tenants either downsize or default.
Forward outlook
- Local home prices are declining (-3.0%/yr); year-one equity from $2k of loan paydown is wiped out by about $10k of value loss. Plan a longer hold.
- Broward County population projected at +34% by 2050 — long-run rental-demand tailwind backs the buy-and-hold thesis.
Negotiation context
- Only 9 days on market — expect competitive offers; lowballing is unlikely to land.
- Current owner paid $52k; list at $345k implies a 565% gain — meaningful room to come down on a strong offer.
Risks & watch-outs
- Climate carrying-cost: severe wind risk, 99% chance of damaging wind over 30y; extreme-heat days projected 7→27/yr by 2055 (HVAC capex compounding) — expect insurance premiums to compound above CPI over the hold.
Questions for the listing agent
- Built in 1973 — when were the roof, HVAC, electrical panel, plumbing, and water heater last replaced?
- Is there a deadline driving the sale (1031 exchange, divorce, estate, relocation)? That informs how much negotiation room exists.
- Schools are D-rated, which usually means shorter tenancies and higher turnover. Who's the typical renter profile here, and what's been the actual vacancy rate?
- What's the average days-on-market for RENTAL listings here right now (not sales)? A rising rental-DOM trend means longer vacancies and softer asking-rent achievability than the comps imply.
- What's the recent tenant-quality profile in this submarket — average credit score on applications, eviction rate, late-payment / NSF rate, and stable-employment percentage? A property-management company in the area should have these aggregated.
- How much new for-sale + rental construction is in the pipeline within 1–3 miles? Heavy new supply typically softens prices + rents 12–24 months out; constrained supply supports both.
Investment metrics
- 1% rule
- 0.82% ✗
- Cap rate
- 6.64%
- Cash-on-cash
- 1.25%
- DSCR
- 1.06
- GRM
- 10.1
CMA / ARV
- ARV (on-the-fly)
- $417,500
- Comps found
- 2
Show comp detail 2 sales within ~0.75 mi
| Address | Dist | Beds/Ba | Sqft | Sold | Price | $/sf | Match |
|---|---|---|---|---|---|---|---|
| 1411 SW 5th Ter | 0.14mi | 3/2.0 | 1,242 (-1%) | 2mo | $415,000 | $334 | 87 |
| 439 SW Natura Ave Unit A | 0.71mi | 2/2.0 (-1) | 1,230 (-2%) | 3mo | $175,000 | $142 | 52 |
Match score weights: distance 35% · size 25% · config 20% · recency 20%. Top-matched comps best support the ARV.
Projected returns pro-forma
-3.0% appreciation · 2.17% rent growth · sell at horizon
- IRR
- -15.2%
- Equity multiple
- 0.46×
- Total profit
- $-51,936
- Equity at exit
- $51,441
- IRR
- -8.0%
- Equity multiple
- 0.51×
- Total profit
- $-46,869
- Equity at exit
- $29,829
Cash invested: $96,600 (down + closing). Projections, not guarantees.
Landlord ↔ Tenant lean methodology
- Overall (STATE)
- 87 Strongly Landlord-Friendly
- State Florida
- 87 Strongly Landlord-Friendly · R+3
- County
- — inherits STATE
- City
- — inherits STATE
ZIP-level market 33441
- Rents YoY
- 2.2%
- Active inventory
- 300
- Price-to-rent
- 10.1×
Monthly cashflow live
- Estimated rent
- $2,837 high interval (Pro) →
- Mortgage (P&I)
- −$1,809
- Tax from tax record
- −$188 /mo · $2,251/yr
- Insurance
- −$144
- HOA
- −$0
- Vacancy / Maint / Mgmt
- −$596
- Net cashflow
- $101
Break-even live
Sensitivity live
| Price | -10% $296 | -5% $199 | +0% $101 | +5% $3 | +10% $-94 |
|---|---|---|---|---|---|
| Rent | -10% $-123 | -5% $-11 | +0% $101 | +5% $213 | +10% $325 |
| Rate | -1.0pp $275 | -0.5pp $189 | base $101 | +0.5pp $11 | +1.0pp $-79 |
UW: 25.0% down · 7.5% · 30yr · 1.5% tax · 5.0% vac · 8.0% maint · 8.0% mgmt
Financing live
Cash to close
- Down payment
- $86,250
- Closing costs
- $10,350
- Reserves months
- —
- Total cash needed
- —
Loan-product check · same deal, 3 products live
Conventional
25% down · 7.5% · 30yr
- Down + closing
- —
- Monthly P&I
- —
- Monthly cashflow
- —
- DSCR
- —
- Eligible?
- —
Personal DTI + credit; lowest rate.
DSCR
20% down · 8.5% · 30yr
- Down + closing
- —
- Monthly P&I
- —
- Monthly cashflow
- —
- DSCR
- —
- Eligible?
- —
No personal income docs; deal must DSCR.
Hard money
10% down · 12.0% · 12mo
- Down + closing
- —
- Monthly P&I
- —
- Monthly cashflow
- —
- DSCR
- —
- Eligible?
- —
Short-term bridge; refi at stabilization.
Rent comps 40 comps
| Address | Beds | Baths | Sqft | Rent | $/sqft | DOM | Units | Dist |
|---|---|---|---|---|---|---|---|---|
| 1230 SW 6th Ave Deerfield Beach, FL | 4.0 | 2.0 | 1236 | $2,965 | $2.40 | 4d | 1 | 0.05mi |
| 510 SW 13th Pl Deerfield Beach, FL | 4.0 | 2.0 | 1236 | $3,199 | $2.59 | 26d | 1 | 0.08mi |
| 401 SW 13th Pl Deerfield Beach, FL | 3.0 | 1.5 | 892 | $1,995 | $2.24 | 26d | 1 | 0.11mi |
| 401 SW 13th Pl Deerfield Beach, FL | 3.0 | 1.5 | 892 | $2,095 | $2.35 | 4d | 1 | 0.11mi |
| 521 SW 11th Dr Deerfield Beach, FL | 3.0 | 2.0 | 1298 | $2,950 | $2.27 | 24d | 1 | 0.12mi |
| 405 SW 13th Pl Deerfield Beach, FL | 3.0 | 1.5 | 892 | $2,095 | $2.35 | 26d | 1 | 0.13mi |
| 1335 S Dixie Hwy #404 Deerfield Beach, FL | 3.0 | 1.5 | 892 | $2,050 | $2.30 | 26d | 1 | 0.19mi |
| 223 SW 14th Pl Deerfield Beach, FL | 3.0 | 2.0 | 1550 | $2,950 | $1.90 | 6d | 1 | 0.26mi |
| 341 SW 15th St Deerfield Beach, FL | 2.0 | 1.0 | 1111 | $3,000 | $2.70 | 26d | 1 | 0.29mi |
| 831 SW 14th Ct Deerfield Beach, FL | 3.0 | 2.0 | 1056 | $2,850 | $2.70 | 26d | 1 | 0.31mi |
| 588 Trace Cir Deerfield Beach, FL | 2.0 | 2.0 | 943 | $2,275 | $2.41 | 12d | 2 | 0.33mi |
| 588 Trace Cir #206 Deerfield Beach, FL | 2.0 | 2.0 | 1000 | $2,350 | $2.35 | 26d | 1 | 0.33mi |
| 677 Trace Cir #101 Deerfield Beach, FL | 2.0 | 2.0 | 887 | $1,900 | $2.14 | 26d | 1 | 0.37mi |
| 5350 NE 5th Ter Pompano Beach, FL | 2.0 | 1.0 | 950 | $1,900 | $2.00 | 26d | 1 | 0.38mi |
| 841 NE 51st Ct Deerfield Beach, FL | 4.0 | 2.0 | 1518 | $2,850 | $1.88 | 6d | 1 | 0.44mi |
| 1428 SW 1st Ave Deerfield Beach, FL | 2.0 | 2.0 | 1160 | $3,450 | $2.97 | 19d | 1 | 0.47mi |
| 1433 NE 53rd Ct Pompano Beach, FL | 3.0 | 2.0 | 1225 | $3,950 | $3.22 | 26d | 1 | 0.48mi |
| 1183 SE 1st Ter Deerfield Beach, FL | 3.0 | 2.0 | 1131 | $4,650 | $4.11 | 26d | 1 | 0.53mi |
| 941 NE 50th St Deerfield Beach, FL | 3.0 | 2.0 | 1105 | $2,850 | $2.58 | 26d | 1 | 0.58mi |
| 1309 SE 1st Way Deerfield Beach, FL | 3.0 | 2.0 | 1273 | $3,500 | $2.75 | 26d | 1 | 0.59mi |
| 920 Rich Dr Deerfield Beach, FL | 1.0–2.0 | 1.0–2.0 | 1068 | $1,900 | $1.78 | 26d | 4 | 0.61mi |
| 1597 NE 53rd Ct Pompano Beach, FL | 2.0 | 1.0 | 930 | $2,775 | $2.98 | 0d | 1 | 0.62mi |
| 927 Siesta Key Blvd Deerfield Beach, FL | 1.0–2.0 | 1.0–2.0 | 975 | $2,200 | $2.26 | 4d | 25 | 0.63mi |
| 1633 NE 53rd Ct Pompano Beach, FL | 3.0 | 1.0 | 1100 | $2,400 | $2.18 | 15d | 1 | 0.64mi |
| 660 Siesta Key Cir Deerfield Beach, FL | 2.0 | 2.0 | 1070 | $1,940 | $1.81 | 26d | 1 | 0.66mi |
| 1123 SE 2nd Ave Deerfield Beach, FL | 3.0 | 2.0 | 1599 | $3,495 | $2.19 | 19d | 1 | 0.68mi |
| 1123 SE 2nd Ave Unit 1123 Deerfield Beach, FL | 3.0 | 2.0 | 1599 | $3,750 | $2.35 | 26d | 1 | 0.68mi |
| 737 SE 1st Way Deerfield Beach, FL | 1.0–2.0 | 1.0–2.0 | 885 | $2,100 | $2.37 | 0d | 2 | 0.72mi |
| 791 SE 1st Way #74 Deerfield Beach, FL | 2.0 | 2.5 | 1070 | $2,250 | $2.10 | 0d | 1 | 0.72mi |
| 737 SE 1st Way #302 Deerfield Beach, FL | 2.0 | 2.0 | 1070 | $2,100 | $1.96 | 26d | 1 | 0.72mi |
| 219 SE 13th St Deerfield Beach, FL | 2.0 | 2.0 | 1556 | $3,200 | $2.06 | 6d | 1 | 0.73mi |
| 222 SE 11th Ct Deerfield Beach, FL | 3.0 | 2.0 | 1549 | $3,950 | $2.55 | 26d | 1 | 0.74mi |
| 959 SE 2nd Ave #204 Deerfield Beach, FL | 2.0 | 2.0 | 1000 | $2,000 | $2.00 | 16d | 1 | 0.75mi |
| 733 SE 1st Way #109 Deerfield Beach, FL | 2.0 | 2.0 | 1033 | $2,700 | $2.61 | 0d | 1 | 0.75mi |
| 733 SE 1st Way #109 Deerfield Beach, FL | 2.0 | 2.0 | 1033 | $2,850 | $2.76 | 16d | 1 | 0.75mi |
| 223 SE 14th Pl Deerfield Beach, FL | 3.0 | 2.0 | 1413 | $2,900 | $2.05 | 6d | 1 | 0.75mi |
| 223 SE 14th Pl Deerfield Beach, FL | 3.0 | 2.0 | 1413 | $2,900 | $2.05 | 26d | 1 | 0.75mi |
| 959 SE 2nd Ave Deerfield Beach, FL | 1.0–2.0 | 1.5–2.0 | 900 | $2,000 | $2.22 | 18d | 2 | 0.76mi |
| 1741 NE 52nd St Pompano Beach, FL | 3.0 | 2.0 | 1243 | $2,500 | $2.01 | 26d | 1 | 0.79mi |
| 265 SE 10th St Unit 1C Deerfield Beach, FL | 2.0 | 2.0 | 1012 | $2,500 | $2.47 | 6d | 1 | 0.81mi |
Listing history 24 events
-
2026-06-21days on market $345,000 Active 9 DOM
-
2026-06-18days on market $345,000 Active 6 DOM
-
2026-06-17days on market $345,000 Active 5 DOM
-
2026-06-16days on market $345,000 Active 4 DOM
-
2026-06-15days on market $345,000 Active 3 DOM
-
2026-06-13remarks 295-char remark
-
2026-06-13pricedays on market $345,000 Active 1 DOM
-
2026-06-09days on market $359,900 Active 322 DOM
-
2026-06-07days on market $359,900 Active 320 DOM
-
2026-06-04days on market $359,900 Active 317 DOM
-
2026-06-03days on market $359,900 Active 316 DOM
-
2026-06-02days on market $359,900 Active 315 DOM
-
2026-06-01days on market $359,900 Active 314 DOM
-
2026-05-31days on market $359,900 Active 313 DOM
-
2026-04-09price $359,900
-
2025-09-29price $372,900
-
2025-09-11price $374,900
-
2025-08-18price $379,900
-
2025-08-06price $399,900
-
2025-07-23price $409,900
-
2025-07-23price $399,900
-
2025-07-21$410,000 Active
-
1986-05-16soldstatus $51,900
-
1973-01-01soldstatus $21,000
ⓘ Source: listings_history table (triggers on properties + properties_extension) + one-shot
backfill from property_details.listing_events for pre-trigger history.
Tax reassessment forecast FL · Resets to sale price
- Current annual tax
- $2,251 · $188/mo
- Projected year-2 tax
- $2,864 · $239/mo
- Expected delta
- +$613/yr (+$51/mo · 27.2%)
ⓘ Screening estimate from a state-policy table — verify with the county assessor before closing.
Climate risk First Street
- Flood 1/10 Low FEMA zone X (shaded) · 0% chance over 30 yrs
- Wildfire 1/10 Low
- Heat 10/10 Extreme 7 d/yr ≥107°F today · 27 d/yr by 30 yrs out
- Wind 10/10 Extreme 99% chance of damaging wind over 30 yrs
- Air quality 2/10 Low 1 unhealthy d/yr today · 3 by 30 yrs out
Nearby sold comps map
Loading sold comps map…
Walkable amenities ~0.75 mi
Loading nearby amenities…
Taxation est. · year 1
- Rental income
- $34,047
- − Mortgage interest
- −$19,325
- − Property taxes
- −$2,251
- − Insurance
- −$1,725
- − Repairs & maintenance
- −$2,724
- − Management
- −$2,724
- − Depreciation
- −$10,036
- Taxable loss
- −$4,738
- Est. tax savings @ 24.0%
- +$1,137
- After-tax cash flow
- $2,348/yr
For passive investors: Depreciation is non-cash, so a rental often shows a tax loss while cash-flowing — sheltering income. Rental losses are passive: they offset passive income freely, and up to $25,000/yr can offset ordinary (W-2) income if you actively participate and your MAGI is under $100k (phasing out to $0 by $150k); unused losses carry forward. On sale, claimed depreciation is recaptured at up to 25%, and gains may owe capital-gains tax (a 1031 exchange can defer both). Figures are a year-1 estimate at your 24.0% rate — not tax advice; consult a CPA.
Schools (NCES district)
- District
- Broward
- NCES district ID
- 1200180
- Math proficiency
- 42% ▼ -18.00%
- Reading proficiency
- 53% ▼ -5.00%
- Median HH income
- $52,139
- Composite
- 40.88/100
- National rank
- #3621
- State rank
- #46 of 73 in FL
Livability — Deerfield Beach
- Score
- 75/100
- State rank
- #250
- US rank
- #3970
Category grades
Schools grade is shown separately in the Schools card above.
Census & demographics
- Census place
- Deerfield Beach, FL
- County
- Broward County · 1,963,430 people
- City population
- 61,449
- Metro
- Miami-Fort Lauderdale-Pompano Beach, FL
- Population (ZIP)
- 30,153
- Household income
- $58,594
- Rent vs Own
- Severe rent burden
- 2148.0
Population outlook (Broward County) Hauer SSP2
- Today (2025)
- 2,207,033 people
- By 2030
- 2,360,704 · +7.0%
- By 2040
- 2,661,208 · +20.6%
- By 2050
- 2,946,698 · +33.5%
- By 2075
- 3,602,273 · +63.2%
- By 2100
- 3,970,984 · +79.9%
Race, ethnicity, and origin ACS 2023
- Neighborhood character
- Highly diverse neighborhood (Simpson 0.71)
- Race & ethnicity
- White 39% Black 33% Hispanic / Latino 17% Two or more races 15% Asian 2%
- Hispanic origin (detail)
- Mexican 2% Puerto Rican 1% Cuban 3% Dominican 1%
- Common ancestry
- Hispanic 11% Estonian 5% Romanian 3%
- Foreign-born
- 29% · Canada, Jamaica, Guatemala
- Languages at home
- 65% English-only · Spanish 13% French/Haitian/Cajun 11% Other Indo-European 9%
Political lean MEDSL · Broward
- 2024 margin
- D (+17.0) · D 58.0% · R 41.0%
- 2008→2024 swing
- -17.8pp toward R · 2008: 34.7pp · 2024: 17.0pp
- All cycles
- 2024: D+17.0 2020: D+29.8 2016: D+35.0 2012: D+34.9 2008: D+34.7
Not yet ingested
- Civics
- —
Market trends
- HPI YoY
- ▼ -353.25%
- Current HPI
- 404.3829
- Rent YoY
- ▲ 2.17%
- Metro
- Miami-Fort Lauderdale-Pompano Beach, FL
- State GDP YoY
- ▲ 3.28%
- F500 in state
- 36
Industry mix (Fortune 500 HQ in FL)
| Industry | F500 HQs | Revenue |
|---|---|---|
| Industrial Technology | 2 | $29B |
|
||
| Insurance | 2 | $17B |
|
||
| Retail | 1 | $60B |
|
||
| Technology Distribution | 1 | $58B |
|
||
| Homebuilding | 1 | $35B |
|
||
| Technology Manufacturing | 1 | $35B |
|
||
Price history
+1613.8% since first listed10 events — show timeline
- 2026-04-09 Price Changed $359,900 Beaches MLS
- 2025-09-29 Price Changed $372,900 Beaches MLS
- 2025-09-11 Price Changed $374,900 Beaches MLS
- 2025-08-18 Price Changed $379,900 Beaches MLS
- 2025-08-06 Price Changed $399,900 Beaches MLS
- 2025-07-23 Price Changed $409,900 Beaches MLS
- 2025-07-23 Price Changed $399,900 Beaches MLS
- 2025-07-21 Listed $410,000 Beaches MLS
- 1986-05-16 Sold (Public Records) $51,900 Public Records
- 1973-01-01 Sold (Public Records) $21,000 Public Records
Property tax history
+7.7%/yrLatest (2025): $2,251 · +4.9% YoY. Source: county tax records.
Cash-flow waterfall
monthlySold comps — $/sqft
last 12 mo · ≤1 miLoading sold comps…