None · Cheshire Village, CT
Flood risk No data
- FEMA flood zone
- —
- Chance of flooding over 30 yrs
- —
- Est. flood insurance / yr
- —
Fire risk No data
- Est. fire insurance / yr
- —
Heat risk No data
- Hot days now (above threshold)
- —
- Hot days in 30 yrs
- —
Wind risk No data
- Chance of severe wind over 30 yrs
- —
Air-quality risk No data
- Unhealthy air days now
- —
- Unhealthy air days in 30 yrs
- —
Risk factors via First Street. Map © Google.
Why this score? — see what drove the D grade
The composite is a weighted blend of 9 inputs, each scored 0–100. Each bar is that input's sub-score; the figure is the points it added to the 100-point composite (weight × sub-score).
- Cash flow +9.5/30.0
- ARV discount +7.5/15.0
- Schools +6.5/10.0
- 1% rule +5.6/10.0
- Livability +4.0/5.0
- DSCR +2.7/10.0
- Rent growth +2.5/5.0
- Condition / age +2.5/5.0
- Appreciation +0.0/10.0
$198,900
🖨 Deal sheet (PDF) 📄 Offer letter ✓ Due diligence
Listing remarks MLS
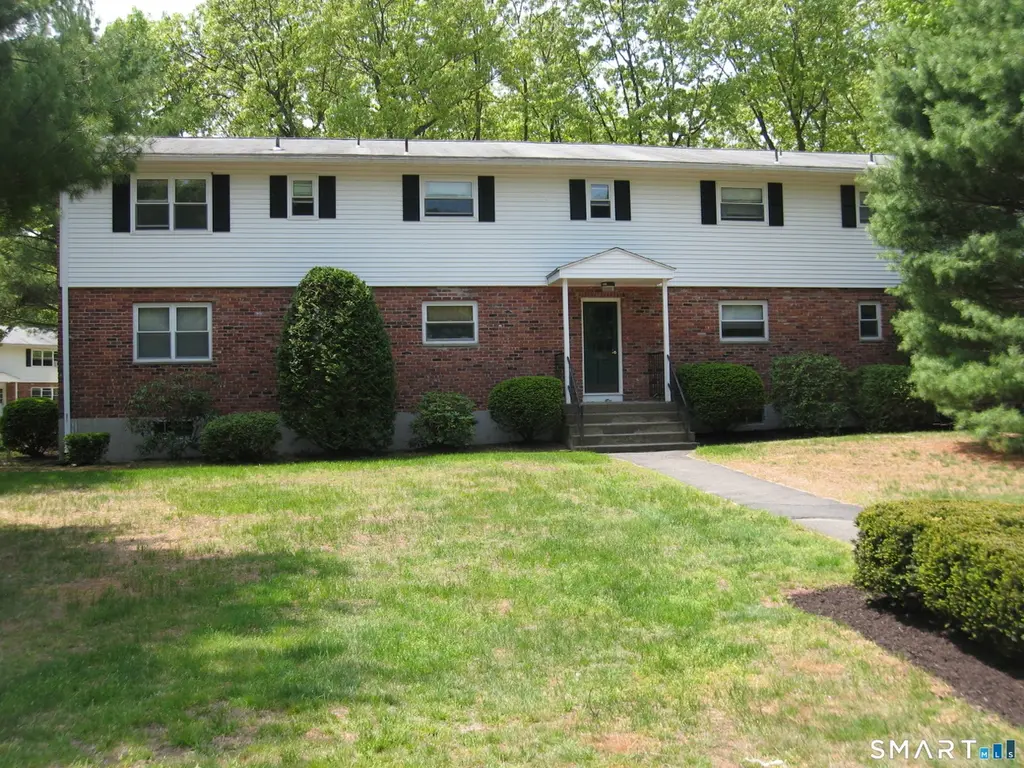
Great starter property or investment to rent out. 2Nd floor 2 bedroom condo with heat & water included in hoa fee.
Key facts
- $510 HOA
- 3 parking spots
- Built 1966
Property features AI
Finance
- Other: Part of an 84-unit complex (Birchwood-Cheshire); Nearby amenities include lake, library, medical facilities, park, playground, public pool, public recreation facilities, and tennis courts
- Financial info: Professional off-site property management; Pets restricted (no dogs allowed)
- HOA & community: Homeowners association with monthly fee; Monthly HOA fee covers grounds maintenance, trash pickup, snow removal, heat, hot water, water, sewer, property management, and road maintenance
Exterior
- Parking: Paved off-street parking; 3 parking spaces
- Utilities: Public water connected; Public sewer connected; Domestic hot water
- Home design: Condominium (ranch model); Unit on 2nd floor
- Construction: Brick construction; Brick & white color
- Exterior features: Porch; Exterior lighting; Secluded, lightly wooded and treed lot with some wetlands; level to rolling terrain
Interior
- Kitchen: Electric range; Microwave; Refrigerator; Dishwasher; Oven/Range
- Bedrooms: 2 bedrooms
- Bathrooms: 1 full bathroom
- Heating & cooling: Hot water heat (oil-fired); Window AC unit; Thermopane windows
- Interior features: Cable available; Full shared basement; Attic with hatch access
- Laundry & utility: Common laundry area on lower level; Fuel tank in basement
Neighborhood map
What this means for you Summary
Snapshot
- This is a 2-bed/1.0-bath condo listed at $199k.
Deal economics
- At list price, monthly cash flow is $-137 ($-2k/yr) — negative.
- To cash-flow at today's rent, offer at most $175k (12.2% below list).
- Meets the 1% rule at list price ($2k rent vs $199k).
- Recommended offer: $175k (12.2% below list) — sets the bar for cash-flow.
- Cap rate 5.5% vs local median 2.5% in Cheshire Village — top-decile yield for the area; either an underpriced asset or a hidden risk that comps aren't pricing in. Stress-test before assuming the spread holds.
Location & tenants
- Location reads 79/100 on livability (#29 in CT, #2,087 nationally) — a middle-class / working-renter tenant base. Strengths: crime A+, employment A+, housing A+; Watch: amenities F, commute F, cost of living D-.
- Cheshire School District (suburban): math 64% / reading 76% proficiency, ranked #15 of 153 in CT (top 10%) — strong family-tenant draw, lease renewals of 3-5y typical; only 6% free/reduced lunch — higher-income household profile.
- Zoned schools: Doolittle School (math 68% / reading 73%, grade A-, #75 of 553 statewide, top 14%, 518 students, 23% FRL); Dodd Middle School (math 61% / reading 73%, grade A-, #21 of 175 statewide, top 12%, 622 students, 16% FRL); Cheshire High School (math 46% / reading 73%, grade C+, #45 of 194 statewide, top 25%, 1,239 students, 16% FRL).
- Market conditions: 112 active listings in the ZIP; 1 comparable units currently listed for rent nearby; high-income renter base; 502 units permitted in Naugatuck Valley Planning Region in 2024 (171 in 5+ unit buildings).
- This rent is only 17% of the median local income ($145k/yr) — well below the 30% rent-burden line; pricing power to push rent on renewal without tenant pushback.
Forward outlook
- Local home prices are declining (-3.0%/yr); year-one equity from $1k of loan paydown is wiped out by about $6k of value loss. Plan a longer hold.
Negotiation context
- It's been on market 50 days — a 3% lower offer ($193k) is reasonable based on typical stale-listing flexibility.
- 6 sale attempts since 26y ago with the ask held roughly flat each time — persistent listings suggest the price (not the market) is what's stuck; bring a comps-based counter.
- Current owner paid $100k; list at $199k implies a 99% gain — meaningful room to come down on a strong offer.
Risks & watch-outs
- Watch-outs: HOA is 24% of rent.
Questions for the listing agent
- What do current leases actually rent for vs. the listed asking? Can we see a recent rent roll and the last 12 months of T-12 income?
- It's been on market 50 days. Have you received any prior offers? Is the seller open to a 12% concession, seller financing, or rate buy-down credit?
- Built in 1966 — when were the roof, HVAC, electrical panel, plumbing, and water heater last replaced?
- What does the HOA fee cover, when was the last increase, and are there any pending special assessments or reserve-fund shortfalls?
- Any open or pending special assessments — roof, HVAC, plumbing, elevator, façade? What's the per-unit balance and payoff schedule, and is the seller paying it off at close or rolling it to the buyer?
- Is there a deadline driving the sale (1031 exchange, divorce, estate, relocation)? That informs how much negotiation room exists.
- Schools are A-rated — typically a magnet for longer-tenancy family renters. What's the average tenant stay here, and is there a school-zone premium baked into asking?
- The area grade is low — what's the realistic commute time and amenity access for the typical tenant pool here? Any planned neighborhood developments (good or bad) we should know about?
- What's the average days-on-market for RENTAL listings here right now (not sales)? A rising rental-DOM trend means longer vacancies and softer asking-rent achievability than the comps imply.
- What's the recent tenant-quality profile in this submarket — average credit score on applications, eviction rate, late-payment / NSF rate, and stable-employment percentage? A property-management company in the area should have these aggregated.
- How much new apartment / multifamily construction is in the pipeline within 1–3 miles? Heavy new supply (>2% of stock underway) typically softens rents 12–24 months out; light construction supports rent growth.
Investment metrics
- 1% rule
- 1.06% ✓
- Cap rate
- 5.47%
- Cash-on-cash
- -2.95%
- DSCR
- 0.87
- GRM
- 7.9
CMA / ARV
No comps found within radius.
Projected returns pro-forma
-3.0% appreciation · 3.0% rent growth · sell at horizon
- IRR
- -21.0%
- Equity multiple
- 0.27×
- Total profit
- $-40,655
- Equity at exit
- $29,657
- IRR
- -14.0%
- Equity multiple
- 0.18×
- Total profit
- $-45,437
- Equity at exit
- $17,197
Cash invested: $55,692 (down + closing). Projections, not guarantees.
Landlord ↔ Tenant lean methodology
- Overall (STATE)
- 27 Tenant-Leaning
- State Connecticut
- 27 Tenant-Leaning · D+7
- County
- — inherits STATE
- City
- — inherits STATE
ZIP-level market 06410
- Active inventory
- 112
- Price-to-rent
- 7.9×
Monthly cashflow live
- Estimated rent
- $2,105 medium interval (Pro) →
- Mortgage (P&I)
- −$1,043
- Tax from tax record
- −$164 /mo · $1,963/yr
- Insurance
- −$83
- HOA
- −$510
- Vacancy / Maint / Mgmt
- −$442
- Net cashflow
- $-137
Break-even live
Sensitivity live
| Price | -10% $-24 | -5% $-81 | +0% $-137 | +5% $-193 | +10% $-249 |
|---|---|---|---|---|---|
| Rent | -10% $-303 | -5% $-220 | +0% $-137 | +5% $-54 | +10% $29 |
| Rate | -1.0pp $-37 | -0.5pp $-86 | base $-137 | +0.5pp $-188 | +1.0pp $-241 |
UW: 25.0% down · 7.5% · 30yr · 1.5% tax · 5.0% vac · 8.0% maint · 8.0% mgmt
Financing live
Cash to close
- Down payment
- $49,725
- Closing costs
- $5,967
- Reserves months
- —
- Total cash needed
- —
Loan-product check · same deal, 3 products live
Conventional
25% down · 7.5% · 30yr
- Down + closing
- —
- Monthly P&I
- —
- Monthly cashflow
- —
- DSCR
- —
- Eligible?
- —
Personal DTI + credit; lowest rate.
DSCR
20% down · 8.5% · 30yr
- Down + closing
- —
- Monthly P&I
- —
- Monthly cashflow
- —
- DSCR
- —
- Eligible?
- —
No personal income docs; deal must DSCR.
Hard money
10% down · 12.0% · 12mo
- Down + closing
- —
- Monthly P&I
- —
- Monthly cashflow
- —
- DSCR
- —
- Eligible?
- —
Short-term bridge; refi at stabilization.
Rent comps 1 comps
| Address | Beds | Baths | Sqft | Rent | $/sqft | DOM | Units | Dist |
|---|---|---|---|---|---|---|---|---|
| 500 Oak Ave #21 Cheshire, CT | 2.0 | 1.0 | 900 | $1,800 | $2.00 | 12d | 1 | 0.23mi |
HOA detail condo
- Monthly dues
- $510 · $6,120/yr
- Likely covers
- water
- Assessments
- None detected in remarks — confirm with the listing agent.
Listing history 16 events
-
2026-04-16historical Under Contract - Continue to Show
-
2026-04-06$198,900 Active
-
2026-04-04historical $198,900
-
2011-04-29soldstatus $100,000 118-char remark
Show marketing remark (118 chars)
Great starter property or investment to rent out. 2Nd floor 2 bedroom condo with heat & water included in hoa fee.
-
2010-10-18$105,000 118-char remark
Show marketing remark (118 chars)
Great starter property or investment to rent out. 2Nd floor 2 bedroom condo with heat & water included in hoa fee.
-
2009-09-25historical
-
2009-03-26$108,000
-
2007-01-02soldstatus $127,000
-
2006-12-29soldstatus $127,000
-
2006-10-17$127,000
-
2004-05-19soldstatus $109,000
-
2004-05-19soldstatus $109,000
-
2004-05-14soldstatus $109,000
-
2004-03-07$109,000
-
2000-12-14soldstatus $75,000
-
2000-10-16$75,000
ⓘ Source: listings_history table (triggers on properties + properties_extension) + one-shot
backfill from property_details.listing_events for pre-trigger history.
Tax reassessment forecast CT · Partial reset (capped growth)
- Current annual tax
- $1,963 · $164/mo
- Projected year-2 tax
- $3,110 · $259/mo
- Expected delta
- +$1,147/yr (+$96/mo · 58.4%)
ⓘ Screening estimate from a state-policy table — verify with the county assessor before closing.
Nearby sold comps map
Loading sold comps map…
Walkable amenities ~0.75 mi
Loading nearby amenities…
Taxation est. · year 1
- Rental income
- $25,255
- − Mortgage interest
- −$11,141
- − Property taxes
- −$1,963
- − Insurance
- −$994
- − Repairs & maintenance
- −$2,020
- − Management
- −$2,020
- − HOA
- −$6,120
- − Depreciation
- −$5,786
- Taxable loss
- −$4,791
- Est. tax savings @ 24.0%
- +$1,150
- After-tax cash flow
- $-493/yr
For passive investors: Depreciation is non-cash, so a rental often shows a tax loss while cash-flowing — sheltering income. Rental losses are passive: they offset passive income freely, and up to $25,000/yr can offset ordinary (W-2) income if you actively participate and your MAGI is under $100k (phasing out to $0 by $150k); unused losses carry forward. On sale, claimed depreciation is recaptured at up to 25%, and gains may owe capital-gains tax (a 1031 exchange can defer both). Figures are a year-1 estimate at your 24.0% rate — not tax advice; consult a CPA.
Schools (NCES district)
- District
- Cheshire School District
- NCES district ID
- 0900750
- Math proficiency
- 64% ▼ -9.00%
- Reading proficiency
- 76% ▼ -6.00%
- Median HH income
- $107,049
- Composite
- 64.78/100
- National rank
- #519
- State rank
- #15 of 153 in CT
Livability — Cheshire Village
- Score
- 79/100
- State rank
- #29
- US rank
- #2087
Category grades
Schools grade is shown separately in the Schools card above.
Census & demographics
- County
- New Haven County · 688,236 people
- City population
- 28,792
- Metro
- New Haven-Milford, CT
- Population (ZIP)
- 28,904
- Household income
- $145,179
- Rent vs Own
- Severe rent burden
- 234.0
Population outlook (Naugatuck Valley County) Hauer SSP2
- By 2040
- 496,846
Race, ethnicity, and origin ACS 2023
- Neighborhood character
- Predominantly White (73%)
- Race & ethnicity
- White 73% Two or more races 10% Asian 10% Hispanic / Latino 7% Black 3%
- Hispanic origin (detail)
- Mexican 2% Puerto Rican 3%
- Common ancestry
- Romanian 6% Lithuanian 4% Scotch-Irish 3%
- Foreign-born
- 13% · China, Canada, South Korea
- Languages at home
- 85% English-only · Chinese 4% Other Indo-European 3% Spanish 3%
Political lean MEDSL · Naugatuck Valley
- 2024 margin
- Lean R (+7.4) · D 45.6% · R 53.0% · Other 1.4%
- All cycles
- 2024: R+7.4
Not yet ingested
- Civics
- —
Market trends
- HPI YoY
- ▼ -321.35%
- Current HPI
- 244.0737
- Rent YoY
- —
- Metro
- New Haven-Milford, CT
- State GDP YoY
- ▲ 1.06%
- F500 in state
- 38
Industry mix (Fortune 500 HQ in CT)
| Industry | F500 HQs | Revenue |
|---|---|---|
| Industrial Machinery | 4 | $38B |
|
||
| Insurance | 3 | $71B |
|
||
| Financial Services | 2 | $25B |
|
||
| Transportation / Logistics | 2 | $18B |
|
||
| Healthcare | 1 | $247B |
|
||
| Telecommunications | 1 | $55B |
|
||
Price history
+165.2% since first listed16 events — show timeline
- 2026-04-16 Contingent — Smart MLS
- 2026-04-06 Listed $198,900 Smart MLS
- 2026-04-04 Coming Soon $198,900 Smart MLS
- 2011-04-29 Sold (MLS) $100,000 Smart MLS
- 2010-10-18 Listed $105,000 Smart MLS
- 2009-09-25 Listing Removed — Smart MLS
- 2009-03-26 Listed $108,000 Smart MLS
- 2007-01-02 Sold (Public Records) $127,000 Public Records
- 2006-12-29 Sold (MLS) $127,000 Smart MLS
- 2006-10-17 Listed $127,000 Smart MLS
- 2004-05-19 Sold (Public Records) $109,000 Public Records
- 2004-05-19 Sold (Public Records) $109,000 Public Records
- 2004-05-14 Sold (MLS) $109,000 Smart MLS
- 2004-03-07 Listed $109,000 Smart MLS
- 2000-12-14 Sold (MLS) $75,000 Smart MLS
- 2000-10-16 Listed $75,000 Smart MLS
Property tax history
-1.0%/yrLatest (2023): $1,963 · +2.2% YoY. Source: county tax records.
Cash-flow waterfall
monthlySold comps — $/sqft
last 12 mo · ≤1 miLoading sold comps…