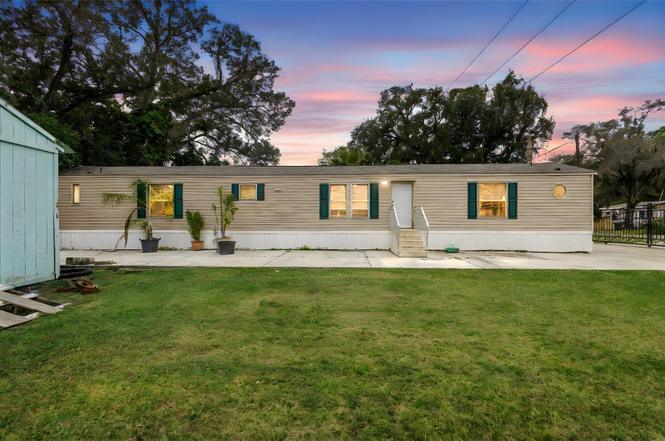
2530 Cresap St · Lakeland, FL
Flood risk 7/10 · Major
- FEMA flood zone
- X (unshaded)
- Chance of flooding over 30 yrs
- 0.99%
- Est. flood insurance / yr
- $507 – $1,088
Fire risk 2/10 · Minimal
- Est. fire insurance / yr
- $947 – $1,759
Heat risk 8/10 · Major
- Hot days now (above 108°F)
- 7 days/yr
- Hot days in 30 yrs
- 23 days/yr
Wind risk 10/10 · Severe
- Chance of severe wind over 30 yrs
- 99.0%
Air-quality risk 2/10 · Minimal
- Unhealthy air days now
- 1 days/yr
- Unhealthy air days in 30 yrs
- 2 days/yr
Risk factors via First Street. Map © Google.
Why this score? — see what drove the D grade
The composite is a weighted blend of 9 inputs, each scored 0–100. Each bar is that input's sub-score; the figure is the points it added to the 100-point composite (weight × sub-score).
- Appreciation +10.0/10.0
- ARV discount +7.5/15.0
- Cash flow +6.9/30.0
- Rent growth +4.0/5.0
- Livability +3.9/5.0
- Schools +3.5/10.0
- Condition / age +2.5/5.0
- 1% rule +1.5/10.0
- DSCR +1.1/10.0
$235,000
🖨 Deal sheet (PDF) 📄 Offer letter ✓ Due diligence
Listing remarks
Under contract-accepting backup offers. Exquisite 2022-built manufactured home nestled on a spacious 0.27-acre lot in Lakeland’s Winston area! This modern 3-bedroom, 2-bath residence boasts approximately 1,200 sq ft of living space and offers the ideal blend of style, comfort and value. Step inside to a bright, open layout featuring contemporary finishes and thoughtful flow throughout. Outside, enjoy the generous yard—rare for a home of this type—providing room for play, pets or future enhancements. Positioned in a convenient location, you’ll appreciate easy access to major roads, local amenities, and the growing Central Florida market. Whether you’re a first-
Key facts
- Easy access
- Bright open layout
- Generous yard
Tags
Property features AI
Finance
- Other: Property zoned R-3; Lot approx. 0.27 acres (110 x 108), paved/asphalt road access
- HOA & community: No association
Exterior
- Parking: Carport with 2 spaces
- Utilities: Public water; Septic tank; Electricity available; Cable available; Sewer available
- Home design: Manufactured home (single wide); One level; Front faces north
- Construction: Metal frame with vinyl siding; Shingle roof; Crawlspace and slab foundation; Built as a single wide manufactured home
- Exterior features: Private mailbox; Storage
Interior
- Kitchen: Microwave; Range; Refrigerator; Dishwasher not listed
- Bedrooms: 3 bedrooms
- Flooring: Laminate
- Bathrooms: 2 full bathrooms
- Heating & cooling: Central heating; Central air conditioning
- Interior features: Built-in features; Ceiling fans; Thermostat
- Laundry & utility: Laundry room; Washer; Dryer
Neighborhood map
What this means for you Summary
Snapshot
- This is a 3-bed/2.0-bath manufactured listed at $235k.
Deal economics
- At list price, monthly cash flow is $-422 ($-5k/yr) — negative.
- To cash-flow at today's rent, offer at most $160k (31.7% below list).
- To meet the 1% rule (rent ≥ 1% of price), the offer needs to be $153k (34.7% below list).
- Recommended offer: $153k (34.7% below list) — sets the bar for 1% rule.
Location & tenants
- Location reads 77/100 on livability (#206 in FL, #3,179 nationally) — a middle-class / working-renter tenant base. Strengths: cost of living A+, housing A+, health & safety A+; Watch: employment D+, amenities F, commute F.
- Polk (suburban): math 39% / reading 43% proficiency, ranked #62 of 73 in FL (top 85%) — families likely to look elsewhere, expect single-tenant / working-renter base with shorter leases.
- Zoned schools: Jesse Keen Elementary School (math 20% / reading 21%, grade F, #2,094 of 2,144 statewide, top 98%, 649 students, 67% FRL); Sleepy Hill Middle School (math 29% / reading 34%, grade F, #453 of 571 statewide, top 81%, 1,090 students, 66% FRL); Kathleen Senior High School (math 19% / reading 31%, grade F, #501 of 667 statewide, top 75%, 2,051 students, 59% FRL) — zoned schools at 64% FRL track the district average.
- Zoned-school proficiency averages 26% at this address vs 41% district-wide (-15 pts) — the specific schools serving this property underperform the Polk average; the district grade overstates school quality for this exact location.
- Market conditions: Rents rising fast (+6.1%/yr); 74 active listings in the ZIP; 23 comparable units currently listed for rent nearby; rentals at typical pace (median 25d on market — plan ~3-4 weeks tenant-placement turnaround); lower-income renter base — watch delinquency; 10,384 units permitted in Polk County in 2024 (1,716 in 5+ unit buildings).
Forward outlook
- In year one you build about $25k of equity ($2k loan paydown + $24k appreciation (10.0% local appreciation)).
- Polk County population projected at +33% by 2050 — long-run rental-demand tailwind backs the buy-and-hold thesis.
- By year 2, paydown + projected appreciation supports a ~$40k cash-out refi (75% LTV) — recoverable capital for the next deal without selling this one.
Negotiation context
- It's been on market 63 days — a 6% lower offer ($221k) is reasonable based on typical stale-listing flexibility.
- 6 sale attempts since 21y ago; this cycle's ask has dropped $14k (6%) from the opening price — seller is motivated, your offer sets the floor, not the list.
- Current owner paid $22k; list at $235k implies a 968% gain — meaningful room to come down on a strong offer.
Risks & watch-outs
- Watch-outs: flood insurance adds $66/mo.
- Climate carrying-cost: major flood risk; severe wind risk, 99% chance of damaging wind over 30y; extreme-heat days projected 7→23/yr by 2055 (HVAC capex compounding) — expect insurance premiums to compound above CPI over the hold.
Questions for the listing agent
- What do current leases actually rent for vs. the listed asking? Can we see a recent rent roll and the last 12 months of T-12 income?
- It's been on market 63 days. Have you received any prior offers? Is the seller open to a 35% concession, seller financing, or rate buy-down credit?
- What's the actual annual flood-insurance premium (NFIP or private), and is the property in a SFHA with mandatory coverage?
- Why hasn't it sold? Are there any deal-killer items the seller is aware of (foundation, flood, title, zoning, code violations)?
- Is there a deadline driving the sale (1031 exchange, divorce, estate, relocation)? That informs how much negotiation room exists.
- The area grade is low — what's the realistic commute time and amenity access for the typical tenant pool here? Any planned neighborhood developments (good or bad) we should know about?
- What's the average days-on-market for RENTAL listings here right now (not sales)? A rising rental-DOM trend means longer vacancies and softer asking-rent achievability than the comps imply.
- What's the recent tenant-quality profile in this submarket — average credit score on applications, eviction rate, late-payment / NSF rate, and stable-employment percentage? A property-management company in the area should have these aggregated.
- How much new for-sale + rental construction is in the pipeline within 1–3 miles? Heavy new supply typically softens prices + rents 12–24 months out; constrained supply supports both.
Investment metrics
- 1% rule
- 0.65% ✗
- Cap rate
- 4.48%
- Cash-on-cash
- -6.48%
- DSCR
- 0.71
- GRM
- 12.8
CMA / ARV
No comps found within radius.
Projected returns pro-forma
10.0% appreciation · 6.14% rent growth · sell at horizon
- IRR
- 19.7%
- Equity multiple
- 2.61×
- Total profit
- $106,151
- Equity at exit
- $211,707
- IRR
- 18.7%
- Equity multiple
- 6.25×
- Total profit
- $345,292
- Equity at exit
- $456,553
Cash invested: $65,800 (down + closing). Projections, not guarantees.
Landlord ↔ Tenant lean methodology
- Overall (STATE)
- 87 Strongly Landlord-Friendly
- State Florida
- 87 Strongly Landlord-Friendly · R+3
- County
- — inherits STATE
- City
- — inherits STATE
ZIP-level market 33815
- Home prices YoY
- 12.6%
- Rents YoY
- 6.1%
- Active inventory
- 74
- Price-to-rent
- 12.8×
Monthly cashflow live
- Estimated rent
- $1,534 high interval (Pro) →
- Mortgage (P&I)
- −$1,232
- Tax from tax record
- −$237 /mo · $2,843/yr
- Insurance
- −$98
- Flood insurance flood zone
- −$66 /mo · $798/yr
- HOA
- −$0
- Vacancy / Maint / Mgmt
- −$322
- Net cashflow
- $-422
Break-even live
Sensitivity live
| Price | -10% $-289 | -5% $-355 | +0% $-422 | +5% $-488 | +10% $-555 |
|---|---|---|---|---|---|
| Rent | -10% $-543 | -5% $-482 | +0% $-422 | +5% $-361 | +10% $-301 |
| Rate | -1.0pp $-303 | -0.5pp $-362 | base $-422 | +0.5pp $-483 | +1.0pp $-545 |
UW: 25.0% down · 7.5% · 30yr · 1.5% tax · 5.0% vac · 8.0% maint · 8.0% mgmt
Financing live
Cash to close
- Down payment
- $58,750
- Closing costs
- $7,050
- Reserves months
- —
- Total cash needed
- —
Loan-product check · same deal, 3 products live
Conventional
25% down · 7.5% · 30yr
- Down + closing
- —
- Monthly P&I
- —
- Monthly cashflow
- —
- DSCR
- —
- Eligible?
- —
Personal DTI + credit; lowest rate.
DSCR
20% down · 8.5% · 30yr
- Down + closing
- —
- Monthly P&I
- —
- Monthly cashflow
- —
- DSCR
- —
- Eligible?
- —
No personal income docs; deal must DSCR.
Hard money
10% down · 12.0% · 12mo
- Down + closing
- —
- Monthly P&I
- —
- Monthly cashflow
- —
- DSCR
- —
- Eligible?
- —
Short-term bridge; refi at stabilization.
Rent comps 23 comps
| Address | Beds | Baths | Sqft | Rent | $/sqft | DOM | Units | Dist |
|---|---|---|---|---|---|---|---|---|
| 2206 W Highland St Unit 2208 Lakeland, FL | 2.0 | 1.0 | 756 | $1,125 | $1.49 | 12d | 1 | 0.38mi |
| 2559 Chestnut Woods Dr Lakeland, FL | 2.0 | 1.0 | 1001 | $1,500 | $1.50 | 16d | 1 | 0.81mi |
| 2463 Chestnut Woods Dr Lakeland, FL | 2.0 | 1.0 | 910 | $1,500 | $1.65 | 25d | 1 | 0.82mi |
| 2259 Chestnut Woods Dr Lakeland, FL | 2.0 | 1.0 | 1001 | $1,400 | $1.40 | 16d | 1 | 0.82mi |
| 457 Arapahoe Ave Lakeland, FL | 2.0 | 1.0 | 750 | $1,095 | $1.46 | 4d | 1 | 0.85mi |
| 455 Arapahoe Ave Lakeland, FL | 2.0 | 1.0 | 750 | $1,199 | $1.60 | 21d | 1 | 0.86mi |
| 607 Kansas Ave Lakeland, FL | 2.0 | 1.0 | 829 | $1,150 | $1.39 | 25d | 1 | 1.01mi |
| 1618 Wayman St Lakeland, FL | 3.0 | 1.0 | 994 | $1,750 | $1.76 | 25d | 1 | 1.07mi |
| 3327 Old Tampa Hwy Unit N/A Lakeland, FL | 3.0 | 2.0 | 1409 | $2,290 | $1.63 | 16d | 1 | 1.07mi |
| 524 Montana Ave Lakeland, FL | 2.0 | 1.0 | 817 | $1,300 | $1.59 | 25d | 1 | 1.09mi |
| 515 Oregon Ave Lakeland, FL | 3.0 | 2.0 | 1024 | $1,500 | $1.46 | 5d | 1 | 1.12mi |
| 2117 Ivey Ln Lakeland, FL | 3.0 | 1.0 | 1160 | $1,980 | $1.71 | 25d | 1 | 1.18mi |
| 1514 Alice Ave Lakeland, FL | 3.0 | 2.0 | 924 | $1,250 | $1.35 | 16d | 1 | 1.25mi |
| 512 Dade Ave Lakeland, FL | 2.0 | 1.0 | 936 | $1,149 | $1.23 | 25d | 1 | 1.33mi |
| 1246 Dorothy St Lakeland, FL | 3.0 | 2.0 | 1484 | $2,300 | $1.55 | 25d | 1 | 1.33mi |
| 510 Dade Ave Lakeland, FL | 2.0 | 1.0 | 936 | $1,149 | $1.23 | 16d | 1 | 1.33mi |
| 1238 Herschell St Lakeland, FL | 2.0 | 1.0 | 1323 | $1,300 | $0.98 | 25d | 1 | 1.37mi |
| 1301 W Walnut St Lakeland, FL | 3.0 | 1.0 | 756 | $1,300 | $1.72 | 16d | 1 | 1.37mi |
| 518 Pinewood Ave Lakeland, FL | 2.0 | 1.0 | 891 | $1,175 | $1.32 | 25d | 1 | 1.38mi |
| 1206 W Highland St Lakeland, FL | 2.0 | 1.0 | 972 | $1,495 | $1.54 | 25d | 1 | 1.40mi |
| 1213 W Patterson St Lakeland, FL | 3.0 | 1.0 | 840 | $1,350 | $1.61 | 16d | 1 | 1.41mi |
| 808 S Central Ave Lakeland, FL | 2.0 | 1.0 | 700 | $1,100 | $1.57 | 25d | 1 | 1.45mi |
| 806 N Swindell Ave Lakeland, FL | 3.0 | 2.0 | 995 | $1,450 | $1.46 | 25d | 1 | 1.49mi |
Listing history 19 events
-
2026-05-09status Pending
-
2026-05-07price $235,000
-
2026-04-30price $230,000
-
2026-03-10price $242,900
-
2026-03-06$248,900 Active
-
2026-03-02historical
-
2026-01-17price $248,900
-
2025-11-08$249,000 Active
-
2025-10-22historical
-
2025-07-31price $250,000
-
2025-04-24$259,000 Active
-
2024-07-10historical
-
2024-01-12$260,000 Active
-
2005-05-06soldstatus $22,000
-
2005-05-06soldstatus $22,000
-
2005-04-08$24,900
-
2005-04-08$24,900
-
1980-07-01soldstatus $21,000
-
1978-01-01soldstatus $5,500
ⓘ Source: listings_history table (triggers on properties + properties_extension) + one-shot
backfill from property_details.listing_events for pre-trigger history.
Tax reassessment forecast FL · Resets to sale price
- Current annual tax
- $2,843 · $237/mo
- Projected year-2 tax
- $2,843 · $237/mo
- Expected delta
- $0/yr ($0/mo · 0.0%)
ⓘ Screening estimate from a state-policy table — verify with the county assessor before closing.
Climate risk First Street
- Flood 7/10 Severe FEMA zone X (unshaded) · 99% chance over 30 yrs
- Wildfire 2/10 Low
- Heat 8/10 Severe 7 d/yr ≥108°F today · 23 d/yr by 30 yrs out
- Wind 10/10 Extreme 99% chance of damaging wind over 30 yrs
- Air quality 2/10 Low 1 unhealthy d/yr today · 2 by 30 yrs out
Nearby sold comps map
Loading sold comps map…
Walkable amenities ~0.75 mi
Loading nearby amenities…
Taxation est. · year 1
- Rental income
- $18,408
- − Mortgage interest
- −$13,164
- − Property taxes
- −$2,843
- − Insurance
- −$1,972
- − Repairs & maintenance
- −$1,473
- − Management
- −$1,473
- − Depreciation
- −$6,836
- Taxable loss
- −$9,353
- Est. tax savings @ 24.0%
- +$2,245
- After-tax cash flow
- $-2,817/yr
For passive investors: Depreciation is non-cash, so a rental often shows a tax loss while cash-flowing — sheltering income. Rental losses are passive: they offset passive income freely, and up to $25,000/yr can offset ordinary (W-2) income if you actively participate and your MAGI is under $100k (phasing out to $0 by $150k); unused losses carry forward. On sale, claimed depreciation is recaptured at up to 25%, and gains may owe capital-gains tax (a 1031 exchange can defer both). Figures are a year-1 estimate at your 24.0% rate — not tax advice; consult a CPA.
Schools (NCES district)
- District
- Polk
- NCES district ID
- 1201590
- Math proficiency
- 39% ▼ -11.00%
- Reading proficiency
- 43% ▼ -4.00%
- Median HH income
- $43,979
- Composite
- 34.74/100
- National rank
- #5132
- State rank
- #62 of 73 in FL
Livability — Lakeland
- Score
- 77/100
- State rank
- #206
- US rank
- #3179
Category grades
Schools grade is shown separately in the Schools card above.
Census & demographics
- County
- Polk County · 740,051 people
- City population
- 277,690
- Metro
- Lakeland-Winter Haven, FL
- Population (ZIP)
- 13,975
- Household income
- $37,487
- Rent vs Own
- Severe rent burden
- 700.0
Population outlook (Polk County) Hauer SSP2
- Today (2025)
- 752,975 people
- By 2030
- 804,621 · +6.9%
- By 2040
- 906,117 · +20.3%
- By 2050
- 1,000,476 · +32.9%
- By 2075
- 1,197,520 · +59.0%
- By 2100
- 1,271,518 · +68.9%
Race, ethnicity, and origin ACS 2023
- Neighborhood character
- Diverse neighborhood (Simpson 0.67)
- Race & ethnicity
- White 43% Black 27% Hispanic / Latino 26% Two or more races 10% Asian 1%
- Hispanic origin (detail)
- Mexican 12% Puerto Rican 10%
- Common ancestry
- Romanian 1% German 1% Lithuanian 1%
- Foreign-born
- 11% · Canada, Jamaica, China
- Languages at home
- 75% English-only · Spanish 23% German/W. Germanic 1%
Political lean MEDSL · Polk
- 2024 margin
- Strong R (+20.7) · D 39.2% · R 59.9%
- 2008→2024 swing
- -14.6pp toward R · 2008: -6.1pp · 2024: -20.7pp
- All cycles
- 2024: R+20.7 2020: R+14.4 2016: R+14.1 2012: R+6.8 2008: R+6.1
Not yet ingested
- Civics
- —
Market trends
- HPI YoY
- ▲ 47.45%
- Current HPI
- 424.0956
- Rent YoY
- ▲ 6.14%
- Metro
- Lakeland-Winter Haven, FL
- State GDP YoY
- ▲ 3.28%
- F500 in state
- 36
Industry mix (Fortune 500 HQ in FL)
| Industry | F500 HQs | Revenue |
|---|---|---|
| Industrial Technology | 2 | $29B |
|
||
| Insurance | 2 | $17B |
|
||
| Retail | 1 | $60B |
|
||
| Technology Distribution | 1 | $58B |
|
||
| Homebuilding | 1 | $35B |
|
||
| Technology Manufacturing | 1 | $35B |
|
||
Price history
+4172.7% since first listed19 events — show timeline
- 2026-05-09 Pending — Stellar MLS as Distributed by MLS Grid
- 2026-05-07 Price Changed $235,000 Stellar MLS as Distributed by MLS Grid
- 2026-04-30 Price Changed $230,000 Stellar MLS as Distributed by MLS Grid
- 2026-03-10 Price Changed $242,900 Stellar MLS as Distributed by MLS Grid
- 2026-03-06 Listed $248,900 Stellar MLS as Distributed by MLS Grid
- 2026-03-02 Listing Removed — Stellar MLS as Distributed by MLS Grid
- 2026-01-17 Price Changed $248,900 Stellar MLS as Distributed by MLS Grid
- 2025-11-08 Listed $249,000 Stellar MLS as Distributed by MLS Grid
- 2025-10-22 Listing Removed — Stellar MLS as Distributed by MLS Grid
- 2025-07-31 Price Changed $250,000 Stellar MLS as Distributed by MLS Grid
- 2025-04-24 Listed $259,000 Stellar MLS as Distributed by MLS Grid
- 2024-07-10 Listing Removed — Stellar MLS as Distributed by MLS Grid
- 2024-01-12 Listed $260,000 Stellar MLS as Distributed by MLS Grid
- 2005-05-06 Sold (MLS) $22,000 Stellar MLS as Distributed by MLS Grid
- 2005-05-06 Sold (MLS) $22,000 Stellar MLS as Distributed by MLS Grid
- 2005-04-08 Listed $24,900 Stellar MLS as Distributed by MLS Grid
- 2005-04-08 Listed $24,900 Stellar MLS as Distributed by MLS Grid
- 1980-07-01 Sold (Public Records) $21,000 Public Records
- 1978-01-01 Sold (Public Records) $5,500 Public Records
Property tax history
+19.7%/yrLatest (2025): $2,843 · +5.4% YoY. Source: county tax records.
Cash-flow waterfall
monthlySold comps — $/sqft
last 12 mo · ≤1 miLoading sold comps…