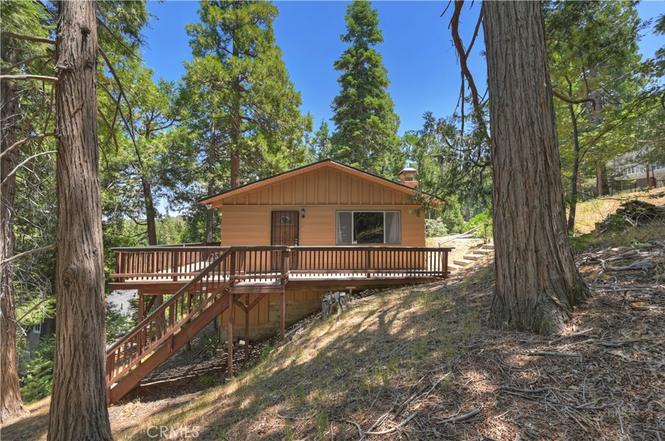
28976 Alder Ter · Lake Arrowhead, CA
Flood risk 1/10 · Minimal
- FEMA flood zone
- D
- Chance of flooding over 30 yrs
- 0.0%
- Est. flood insurance / yr
- $544 – $1,084
Fire risk 7/10 · Major
- Est. fire insurance / yr
- $659 – $1,223
Heat risk 2/10 · Minimal
- Hot days now (above threshold)
- 3 days/yr
- Hot days in 30 yrs
- 3 days/yr
Wind risk 1/10 · Minimal
- Chance of severe wind over 30 yrs
- —
Air-quality risk 10/10 · Severe
- Unhealthy air days now
- 30 days/yr
- Unhealthy air days in 30 yrs
- 37 days/yr
Risk factors via First Street. Map © Google.
Why this score? — see what drove the D+ grade
The composite is a weighted blend of 9 inputs, each scored 0–100. Each bar is that input's sub-score; the figure is the points it added to the 100-point composite (weight × sub-score).
- ARV discount +12.4/15.0
- Appreciation +10.0/10.0
- Cash flow +9.3/30.0
- Livability +2.7/5.0
- DSCR +2.6/10.0
- Rent growth +2.5/5.0
- Condition / age +2.5/5.0
- Schools +2.1/10.0
- 1% rule +1.9/10.0
$304,999
🖨 Deal sheet 📄 Offer letter ✓ Due diligence
Listing remarks
Charming Cedar Glen Mountain Retreat – Move-In Ready Experience the best of mountain living in this beautifully updated Cedar Glen cabin, ideally located just minutes from Lake Arrowhead Village, where you can find shopping, dining, and year-round recreation. Tucked away on a peaceful hilltop surrounded by towering trees, this inviting home offers the privacy, tranquility, and natural beauty that buyers seek when looking for a mountain getaway or full-time residence. Large windows frame the surrounding forest, bringing the outdoors in and filling the home with natural light. The thoughtfully designed floor plan features 2 comfortable bedrooms and 1 bathroom, with convenient access fr
Key facts
- Updated kitchen
- Easy access to parks
- 7,788 sq ft lot
Tags
Property features AI
Finance
- Other: Lot about 0–1 unit/acre (lot dimensions: 7788, source: assessor's data); Paved road access; No fencing; Parcel number available
- HOA & community: Rural community
Exterior
- Utilities: Public sewer; District/public water; Cable available
- Home design: Cabin-style property; Single-story; Entry level: 2; Has a view
- Construction: No common walls (detached); Year built sourced from assessor
- Exterior features: Wrap-around patio/porch; Patio present; No pool
Interior
- Kitchen: Electric range and electric oven; Water heater unit; Eating area
- Bedrooms: Two main-level bedrooms
- Flooring: Carpet; Laminated flooring
- Bathrooms: One full bathroom with bathtub and shower (shower-in-tub)
- Heating & cooling: Central furnace; Fireplace for supplemental heat (living room)
- Interior features: Cathedral/vaulted ceilings; Ceramic counters; Storage space; Front door entry; All bedrooms on main level
- Laundry & utility: Laundry area in kitchen
Neighborhood map
What this means for you Summary
Snapshot
- This is a 2-bed/1.0-bath single-family listed at $305k.
Deal economics
- At list price, monthly cash flow is $-225 ($-3k/yr) — negative.
- To cash-flow at today's rent, offer at most $265k (13.1% below list).
- To meet the 1% rule (rent ≥ 1% of price), the offer needs to be $210k (31.2% below list).
- Recommended offer: $210k (31.2% below list) — sets the bar for 1% rule.
- Cap rate 5.4% vs local median 2.8% in Lake Arrowhead — top-decile yield for the area; either an underpriced asset or a hidden risk that comps aren't pricing in. Stress-test before assuming the spread holds.
Location & tenants
- Location reads 53/100 on livability (#965 in CA) — a working-class tenant base; expect higher turnover. Strengths: housing A-, commute B+, employment B; Watch: health & safety C-, crime D+, schools D.
- Rim Of The World Unified (town): math 13% / reading 34% proficiency, ranked #415 of 517 in CA (top 80%) — low school quality limits family demand, transient renter base, plan for 1-2y turnover.
- Market conditions: 77 active listings in the ZIP; 10 comparable units currently listed for rent nearby; rentals lingering (median 44d on market — plan ~5-8 weeks vacancy on turnover, expect pricing pressure); 50% of comp listings sitting > 30 days — soft ceiling on asking rent; 5,458 units permitted in San Bernardino County in 2024 (1,500 in 5+ unit buildings).
Forward outlook
- In year one you build about $33k of equity ($2k loan paydown + $30k appreciation (10.0% local appreciation)).
- San Bernardino County population projected at +15% by 2050 — modest demand growth; plan on rents tracking national, not racing it.
- By year 2, paydown + projected appreciation supports a ~$52k cash-out refi (75% LTV) — recoverable capital for the next deal without selling this one.
Negotiation context
- Only 8 days on market — expect competitive offers; lowballing is unlikely to land.
- Current owner paid $33k; list at $305k implies a 824% gain — meaningful room to come down on a strong offer.
Risks & watch-outs
- Climate carrying-cost: major wildfire risk — expect insurance premiums to compound above CPI over the hold.
Questions for the listing agent
- What do current leases actually rent for vs. the listed asking? Can we see a recent rent roll and the last 12 months of T-12 income?
- Built in 1968 — when were the roof, HVAC, electrical panel, plumbing, and water heater last replaced?
- Is there a deadline driving the sale (1031 exchange, divorce, estate, relocation)? That informs how much negotiation room exists.
- Schools are D-rated, which usually means shorter tenancies and higher turnover. Who's the typical renter profile here, and what's been the actual vacancy rate?
- Crime grade is D in this area — have there been break-ins, vandalism, or insurance claims at this property in the last 3 years? What carrier currently insures it and at what premium?
- The area grade is low — what's the realistic commute time and amenity access for the typical tenant pool here? Any planned neighborhood developments (good or bad) we should know about?
- What's the average days-on-market for RENTAL listings here right now (not sales)? A rising rental-DOM trend means longer vacancies and softer asking-rent achievability than the comps imply.
- What's the recent tenant-quality profile in this submarket — average credit score on applications, eviction rate, late-payment / NSF rate, and stable-employment percentage? A property-management company in the area should have these aggregated.
- How much new for-sale + rental construction is in the pipeline within 1–3 miles? Heavy new supply typically softens prices + rents 12–24 months out; constrained supply supports both.
Investment metrics
- 1% rule
- 0.69% ✗
- Cap rate
- 5.41%
- Cash-on-cash
- -3.17%
- DSCR
- 0.86
- GRM
- 12.1
CMA / ARV
- ARV (on-the-fly)
- $341,880
- Comps found
- 7
Show comp detail 7 sales within ~0.75 mi
| Address | Dist | Beds/Ba | Sqft | Sold | Price | $/sf | Match |
|---|---|---|---|---|---|---|---|
| 196 Ponderosa Dr | 0.10mi | 2/2.0 | 962 (+14%) | 1mo | $325,000 | $338 | 66 |
| 292 Hemlock Dr | 0.32mi | 1/1.0 (-1) | 810 (-4%) | 17mo | $495,000 | $611 | 60 |
| 28810 Cedar | 0.42mi | 3/2.0 (+1) | 884 (+5%) | 4mo | $435,000 | $492 | 59 |
| 29259 Lake Brook Ave | 0.36mi | 2/1.0 | 728 (-13%) | 3mo | $189,000 | $260 | 58 |
| 29167 arrowhead Dr | 0.30mi | 2/2.0 | 912 (+9%) | 18mo | $325,400 | $357 | 52 |
| 273 Oak Dr | 0.43mi | 2/1.0 | 892 (+6%) | 23mo | $370,000 | $415 | 51 |
| 29198 Lake Brook Ave | 0.29mi | 2/1.0 | 725 (-14%) | 22mo | $295,000 | $407 | 45 |
Match score weights: distance 35% · size 25% · config 20% · recency 20%. Top-matched comps best support the ARV.
Projected returns pro-forma
10.0% appreciation · 3.0% rent growth · sell at horizon
- IRR
- 22.0%
- Equity multiple
- 2.78×
- Total profit
- $151,654
- Equity at exit
- $274,767
- IRR
- 19.8%
- Equity multiple
- 6.36×
- Total profit
- $457,672
- Equity at exit
- $592,546
Cash invested: $85,400 (down + closing). Projections, not guarantees.
Landlord ↔ Tenant lean methodology
- Overall (STATE)
- 18 Strongly Tenant-Friendly
- State California
- 18 Strongly Tenant-Friendly · D+13
- County
- — inherits STATE
- City
- — inherits STATE
ZIP-level market 92321
- Home prices YoY
- 3.6%
- Active inventory
- 77
- Price-to-rent
- 12.1×
Monthly cashflow live
- Estimated rent
- $2,100 high interval (Pro) →
- Mortgage (P&I)
- −$1,599
- Tax from tax record
- −$158 /mo · $1,891/yr
- Insurance
- −$127
- HOA
- −$0
- Vacancy / Maint / Mgmt
- −$441
- Net cashflow
- $-225
Break-even live
UW: 25.0% down · 7.5% · 30yr · 1.5% tax · 5.0% vac · 8.0% maint · 8.0% mgmt
Financing live
Cash to close
- Down payment
- $76,250
- Closing costs
- $9,150
- Reserves months
- —
- Total cash needed
- —
Loan-product check · same deal, 3 products live
Conventional
25% down · 7.5% · 30yr
- Down + closing
- —
- Monthly P&I
- —
- Monthly cashflow
- —
- DSCR
- —
- Eligible?
- —
Personal DTI + credit; lowest rate.
DSCR
20% down · 8.5% · 30yr
- Down + closing
- —
- Monthly P&I
- —
- Monthly cashflow
- —
- DSCR
- —
- Eligible?
- —
No personal income docs; deal must DSCR.
Hard money
10% down · 12.0% · 12mo
- Down + closing
- —
- Monthly P&I
- —
- Monthly cashflow
- —
- DSCR
- —
- Eligible?
- —
Short-term bridge; refi at stabilization.
Rent comps 10 comps
| Address | Beds | Baths | Sqft | Rent | $/sqft | DOM | Units | Dist |
|---|---|---|---|---|---|---|---|---|
| 29184 Lake Brook Ave Cedar Glen, CA | 3.0 | 2.0 | 925 | $1,995 | $2.16 | 44d | 1 | 0.31mi |
| 209 Cool Creek Ln Lake Arrowhead, CA | 2.0 | 1.5 | 1012 | $2,500 | $2.47 | 44d | 1 | 0.85mi |
| 112 Rockledge Ln Lake Arrowhead, CA | 2.0 | 2.0 | 1058 | $2,190 | $2.07 | 5d | 1 | 0.93mi |
| 587 Arrowhead Villa Rd Lake Arrowhead, CA | 2.0 | 1.0 | 864 | $2,350 | $2.72 | 44d | 1 | 0.98mi |
| 29180 North Dr Unit 1 bedroom Cedar Glen, CA | 1.0 | 1.0 | 700 | $1,400 | $2.00 | 2d | 1 | 0.98mi |
| 28101 Lakes Edge Rd Lake Arrowhead, CA | 3.0 | 2.0 | 1106 | $2,600 | $2.35 | 24d | 1 | 1.11mi |
| 545 W Victoria Ct Lake Arrowhead, CA | 2.0 | 1.0 | 858 | $2,000 | $2.33 | 24d | 1 | 1.14mi |
| 28380 Larchmont Ln Lake Arrowhead, CA | 2.0 | 2.0 | 960 | $2,000 | $2.08 | 18d | 1 | 1.23mi |
| 28393 Larchmont Ln Lake Arrowhead, CA | 2.0 | 2.0 | 1104 | $2,200 | $1.99 | 44d | 1 | 1.25mi |
| 701 Pinnacle Dr Lake Arrowhead, CA | 2.0 | 2.0 | 1071 | $1,995 | $1.86 | 44d | 1 | 1.28mi |
Listing history 7 events
-
2026-06-18days on market $304,999 Active 8 DOM
-
2026-06-17days on market $304,999 Active 7 DOM
-
2026-06-16days on market $304,999 Active 6 DOM
-
2026-06-15days on market $304,999 Active 5 DOM
-
2026-06-13days on market $304,999 Active 3 DOM
-
2026-06-13remarks 693-char remark
-
2026-06-13$304,999 Active 2 DOM
ⓘ Source: listings_history table (triggers on properties + properties_extension) + one-shot
backfill from property_details.listing_events for pre-trigger history.
Tax reassessment forecast CA · Resets to sale price
- Current annual tax
- $1,891 · $158/mo
- Projected year-2 tax
- $2,318 · $193/mo
- Expected delta
- +$427/yr (+$36/mo · 22.6%)
ⓘ Screening estimate from a state-policy table — verify with the county assessor before closing.
Climate risk First Street
- Flood 1/10 Low FEMA zone D · 0% chance over 30 yrs
- Wildfire 7/10 Severe
- Heat 2/10 Low
- Wind 1/10 Low
- Air quality 10/10 Extreme 30 unhealthy d/yr today · 37 by 30 yrs out
Nearby sold comps map
Loading sold comps map…
Walkable amenities ~0.75 mi
Loading nearby amenities…
Taxation est. · year 1
- Rental income
- $25,197
- − Mortgage interest
- −$17,085
- − Property taxes
- −$1,891
- − Insurance
- −$1,525
- − Repairs & maintenance
- −$2,016
- − Management
- −$2,016
- − Depreciation
- −$8,873
- Taxable loss
- −$8,208
- Est. tax savings @ 24.0%
- +$1,970
- After-tax cash flow
- $-734/yr
For passive investors: Depreciation is non-cash, so a rental often shows a tax loss while cash-flowing — sheltering income. Rental losses are passive: they offset passive income freely, and up to $25,000/yr can offset ordinary (W-2) income if you actively participate and your MAGI is under $100k (phasing out to $0 by $150k); unused losses carry forward. On sale, claimed depreciation is recaptured at up to 25%, and gains may owe capital-gains tax (a 1031 exchange can defer both). Figures are a year-1 estimate at your 24.0% rate — not tax advice; consult a CPA.
Schools (NCES district)
- District
- Rim Of The World Unified
- NCES district ID
- 0632610
- Math proficiency
- 13% ▼ -10.00%
- Reading proficiency
- 34% ▼ -7.00%
- Median HH income
- $55,860
- Composite
- 21.29/100
- National rank
- #8389
- State rank
- #415 of 517 in CA
Livability — Lake Arrowhead
- Score
- 53/100
- State rank
- #965
- US rank
- #24524
Category grades
Schools grade is shown separately in the Schools card above.
Census & demographics
- Census place
- Lake Arrowhead, CA
- City population
- 6,246
- Population (ZIP)
- 828
Population outlook (San Bernardino County) Hauer SSP2
- Today (2025)
- 2,300,329 people
- By 2030
- 2,378,907 · +3.4%
- By 2040
- 2,523,137 · +9.7%
- By 2050
- 2,642,388 · +14.9%
- By 2075
- 2,880,769 · +25.2%
- By 2100
- 2,909,436 · +26.5%
Race, ethnicity, and origin ACS 2023
- Neighborhood character
- Majority White (58%)
- Race & ethnicity
- White 58% Hispanic / Latino 41% Two or more races 17%
- Hispanic origin (detail)
- Mexican 36% Salvadoran 2%
- Common ancestry
- Slovak 9% Romanian 5% Lithuanian 3%
- Foreign-born
- 16% · Canada, Dominican Republic
- Languages at home
- 76% English-only · Spanish 18% Other Indo-European 5%
Political lean MEDSL · San Bernardino
- 2024 margin
- Toss-up / Even · D 47.5% · R 49.7% · Other 2.8%
- 2008→2024 swing
- -8.5pp toward R · 2008: 6.3pp · 2024: -2.1pp
- All cycles
- 2024: R+2.1 2020: D+10.7 2016: D+9.8 2012: D+5.4 2008: D+6.3
Not yet ingested
- Civics
- —
Market trends
- HPI YoY
- ▲ 17.53%
- Current HPI
- 510.4737
- Rent YoY
- —
- Metro
- —
- State GDP YoY
- ▲ 3.21%
- F500 in state
- 116
Industry mix (Fortune 500 HQ in CA)
| Industry | F500 HQs | Revenue |
|---|---|---|
| Technology | 27 | $1,492B |
|
||
| Financial Services | 3 | $174B |
|
||
| Retail | 3 | $44B |
|
||
| Insurance | 3 | $26B |
|
||
| Media / Entertainment | 2 | $115B |
|
||
| Pharmaceuticals / Biotech | 2 | $62B |
|
||
Price history
+824.2% since first listed2 events — show timeline
- 2026-06-10 Listed $304,999 CRMLS
- 1987-09-22 Sold (Public Records) $33,000 Public Records
Property tax history
+2.3%/yrLatest (2025): $1,891 · +3.3% YoY. Source: county tax records.
Cash-flow waterfall
monthlySold comps — $/sqft
last 12 mo · ≤1 miLoading sold comps…