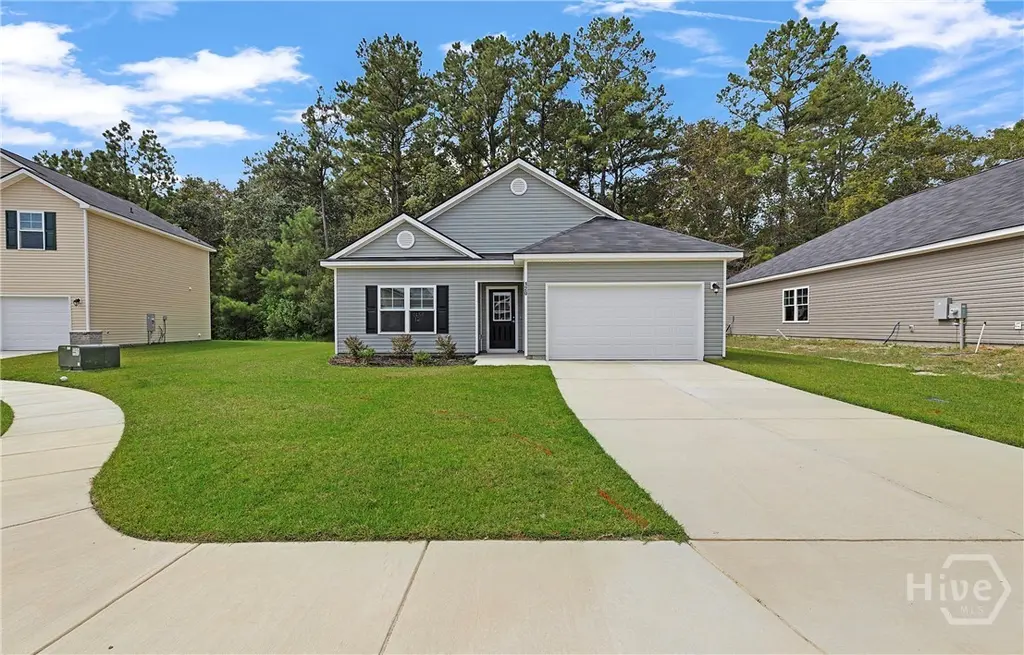
120 Founders Dr · Springfield, GA
Flood risk No data
- FEMA flood zone
- —
- Chance of flooding over 30 yrs
- —
- Est. flood insurance / yr
- —
Fire risk No data
- Est. fire insurance / yr
- —
Heat risk No data
- Hot days now (above threshold)
- —
- Hot days in 30 yrs
- —
Wind risk No data
- Chance of severe wind over 30 yrs
- —
Air-quality risk No data
- Unhealthy air days now
- —
- Unhealthy air days in 30 yrs
- —
Risk factors via First Street. Map © Google.
Why this score? — see what drove the D+ grade
The composite is a weighted blend of 9 inputs, each scored 0–100. Each bar is that input's sub-score; the figure is the points it added to the 100-point composite (weight × sub-score).
- ARV discount +15.0/15.0
- Cash flow +12.0/30.0
- Schools +4.3/10.0
- Condition / age +4.0/5.0
- DSCR +3.5/10.0
- Livability +3.5/5.0
- 1% rule +3.1/10.0
- Rent growth +2.9/5.0
- Appreciation +0.0/10.0
$279,000
🖨 Deal sheet 📄 Offer letter ✓ Due diligence
Listing remarks
Look no further, you're home now! Welcome to THE MOST affordable new construction home in Effingham County, GA. You don't need to sacrifice comfort or quality to begin your journey in home ownership. This new construction house is a blank slate ready for your personal style to finish making it a home! Interior features include luxury vinyl plank flooring throughout common spaces and bathrooms, soft carpet in bedrooms, granite kitchen counters, and stainless steel appliances. Exterior features include quiet culdesac, woods to the back, and a community space with pond and picnic shelter. Listing may include digitally enhanced or staged photos. Actual floorpan may mirror of photos included. Gr
Key facts
- Woods to the back
- Quiet culdesac
- New construction
Tags
Property features AI
Finance
- Other: Directions: From Rincon, take 21 North towards Springfield. Turn right onto Ebenezer Rd. Turn right onto Cottage Way and then right onto Retreat Way. Turn left on Charleston Drive and then right on Founders Dr. Home is on the right of the cul-de-sac.
- HOA & community: Homeowners association with an annual fee of $300 (about $25/month); Subdivision: Oglethorpe Landing
Exterior
- Parking: Attached 2-car garage
- Utilities: Public water; Public sewer; Underground utilities; Electric service
- Home design: Single-family residence; One-story (single level); New construction
- Construction: New construction (recently built)
- Exterior features: Patio; Located on a cul-de-sac; Paved road frontage; Property has a view; Sidewalks in the community
Interior
- Kitchen: Dishwasher; Microwave; Oven; Range; Refrigerator
- Bedrooms: Three main-level bedrooms
- Bathrooms: Two full bathrooms (both on the main level)
- Heating & cooling: Central heating (electric); Central air conditioning (electric)
- Interior features: Kitchen island; Patio (accessible from interior)
- Laundry & utility: Dedicated laundry room; Washer hookup; Electric water heater
Neighborhood map
What this means for you Summary
Snapshot
- This is a 3-bed/2.0-bath single-family listed at $279k. Condition is rated good.
Deal economics
- At list price, monthly cash flow is $-68 ($-819/yr) — negative.
- To cash-flow at today's rent, offer at most $267k (4.3% below list).
- To meet the 1% rule (rent ≥ 1% of price), the offer needs to be $227k (18.7% below list).
- Recommended offer: $227k (18.7% below list) — sets the bar for 1% rule.
- Cap rate 6.0% vs local median 4.2% in Springfield — top-decile yield for the area; either an underpriced asset or a hidden risk that comps aren't pricing in. Stress-test before assuming the spread holds.
Location & tenants
- Location reads 69/100 on livability (#116 in GA) — a middle-class / working-renter tenant base. Strengths: cost of living A+, housing A+, crime A; Watch: employment C-, schools D-, amenities F.
- Effingham County (rural): math 49% / reading 48% proficiency, ranked #16 of 174 in GA (top 9%) — families likely to look elsewhere, expect single-tenant / working-renter base with shorter leases.
- Market conditions: Rents rising (+1.5%/yr); 262 active listings in the ZIP; 4 comparable units currently listed for rent nearby; rentals lingering (median 44d on market — plan ~5-8 weeks vacancy on turnover, expect pricing pressure); 75% of comp listings sitting > 30 days — soft ceiling on asking rent; solid renter incomes; 836 units permitted in Effingham County in 2024 (46 in 5+ unit buildings).
- This rent runs 33% of the median local income ($83k/yr) — at the standard rent-burdened threshold; future hikes will face affordability resistance.
Forward outlook
- Local home prices are declining (-3.0%/yr); year-one equity from $2k of loan paydown is wiped out by about $8k of value loss. Plan a longer hold.
- Effingham County population projected at +33% by 2050 — long-run rental-demand tailwind backs the buy-and-hold thesis.
Negotiation context
- It's been on market 34 days — a 3% lower offer ($271k) is reasonable based on typical stale-listing flexibility.
- 2 sale attempts with the ask held roughly flat each time — persistent listings suggest the price (not the market) is what's stuck; bring a comps-based counter.
Questions for the listing agent
- What do current leases actually rent for vs. the listed asking? Can we see a recent rent roll and the last 12 months of T-12 income?
- It's been on market 34 days. Have you received any prior offers? Is the seller open to a 19% concession, seller financing, or rate buy-down credit?
- What does the HOA fee cover, when was the last increase, and are there any pending special assessments or reserve-fund shortfalls?
- Is there a deadline driving the sale (1031 exchange, divorce, estate, relocation)? That informs how much negotiation room exists.
- Schools are D-rated, which usually means shorter tenancies and higher turnover. Who's the typical renter profile here, and what's been the actual vacancy rate?
- The area grade is low — what's the realistic commute time and amenity access for the typical tenant pool here? Any planned neighborhood developments (good or bad) we should know about?
- What's the average days-on-market for RENTAL listings here right now (not sales)? A rising rental-DOM trend means longer vacancies and softer asking-rent achievability than the comps imply.
- What's the recent tenant-quality profile in this submarket — average credit score on applications, eviction rate, late-payment / NSF rate, and stable-employment percentage? A property-management company in the area should have these aggregated.
- How much new for-sale + rental construction is in the pipeline within 1–3 miles? Heavy new supply typically softens prices + rents 12–24 months out; constrained supply supports both.
Investment metrics
- 1% rule
- 0.81% ✗
- Cap rate
- 6.00%
- Cash-on-cash
- -1.05%
- DSCR
- 0.95
- GRM
- 10.2
CMA / ARV
- ARV (median comp)
- $337,274
- List price
- $279,000
- Delta
- -17.28%
- Verdict
- UNDERPRICED
- Comps
- 10 within 1.0 mi
Show comp detail 4 sales within ~0.75 mi
| Address | Dist | Beds/Ba | Sqft | Sold | Price | $/sf | Match |
|---|---|---|---|---|---|---|---|
| 113 Founders Dr | 0.03mi | 3/2.0 | 1,630 (0%) | 7mo | $314,900 | $193 | 92 |
| 109 Cobbleton Dr | 0.30mi | 3/2.0 | 1,680 (+3%) | 3mo | $339,000 | $202 | 78 |
| 122 Founders Dr | 0.02mi | 3/2.5 | 1,424 (-13%) | 3mo | $292,500 | $205 | 73 |
| 717 Mill Pond Rd | 0.52mi | 4/2.0 (+1) | 1,620 (-1%) | 4mo | $430,000 | $265 | 66 |
Match score weights: distance 35% · size 25% · config 20% · recency 20%. Top-matched comps best support the ARV.
Projected returns pro-forma
-3.0% appreciation · 1.52% rent growth · sell at horizon
- IRR
- -19.6%
- Equity multiple
- 0.32×
- Total profit
- $-52,894
- Equity at exit
- $41,600
- IRR
- -15.8%
- Equity multiple
- 0.17×
- Total profit
- $-64,949
- Equity at exit
- $24,123
Cash invested: $78,120 (down + closing). Projections, not guarantees.
Landlord ↔ Tenant lean methodology
- Overall (STATE)
- 90 Strongly Landlord-Friendly
- State Georgia
- 90 Strongly Landlord-Friendly · R+3
- County
- — inherits STATE
- City
- — inherits STATE
ZIP-level market 31326
- Home prices YoY
- -31.5%
- Rents YoY
- 1.5%
- Active inventory
- 262
- Price-to-rent
- 10.2×
Monthly cashflow live
- Estimated rent
- $2,269 medium interval (Pro) →
- Mortgage (P&I)
- −$1,463
- Tax from tax record
- −$257 /mo · $3,078/yr
- Insurance
- −$116
- HOA
- −$25
- Vacancy / Maint / Mgmt
- −$477
- Net cashflow
- $-68
Break-even live
UW: 25.0% down · 7.5% · 30yr · 1.5% tax · 5.0% vac · 8.0% maint · 8.0% mgmt
Financing live
Cash to close
- Down payment
- $69,750
- Closing costs
- $8,370
- Reserves months
- —
- Total cash needed
- —
Loan-product check · same deal, 3 products live
Conventional
25% down · 7.5% · 30yr
- Down + closing
- —
- Monthly P&I
- —
- Monthly cashflow
- —
- DSCR
- —
- Eligible?
- —
Personal DTI + credit; lowest rate.
DSCR
20% down · 8.5% · 30yr
- Down + closing
- —
- Monthly P&I
- —
- Monthly cashflow
- —
- DSCR
- —
- Eligible?
- —
No personal income docs; deal must DSCR.
Hard money
10% down · 12.0% · 12mo
- Down + closing
- —
- Monthly P&I
- —
- Monthly cashflow
- —
- DSCR
- —
- Eligible?
- —
Short-term bridge; refi at stabilization.
Rent comps 4 comps
| Address | Beds | Baths | Sqft | Rent | $/sqft | DOM | Units | Dist |
|---|---|---|---|---|---|---|---|---|
| 768 Ebenezer Rd Rincon, GA | 3.0 | 2.0 | 1600 | $2,255 | $1.41 | 44d | 1 | 0.13mi |
| 583 Mill Pond Rd Rincon, GA | 3.0 | 1.5 | 1518 | $1,800 | $1.19 | 44d | 1 | 0.73mi |
| 106 Pine Thicket Way Springfield, GA | 3.0 | 2.0 | 1111 | $1,695 | $1.53 | 14d | 1 | 1.46mi |
| 417 Shadowbrook Cir Springfield, GA | 3.0 | 2.0 | 1140 | $1,700 | $1.49 | 44d | 1 | 1.49mi |
HOA detail
- Monthly dues
- $25 · $300/yr
Listing history 13 events
-
2026-06-05days on market $279,000 Active 34 DOM
-
2026-06-03days on market $279,000 Active 33 DOM
-
2026-06-02days on market $279,000 Active 32 DOM
-
2026-06-01days on market $279,000 Active 31 DOM
-
2026-05-31days on market $279,000 Active 30 DOM
-
2026-05-30days on market $279,000 Active 29 DOM
-
2026-05-01$279,000 Active 755-char remark
-
2026-03-20historical
-
2026-03-03price $297,000
-
2026-02-19price $299,500
-
2025-09-24$314,900 Active
-
2025-09-23soldstatus $1,380,000
-
2025-09-23soldstatus $1,380,000
ⓘ Source: listings_history table (triggers on properties + properties_extension) + one-shot
backfill from property_details.listing_events for pre-trigger history.
Tax reassessment forecast GA · Resets to sale price
- Current annual tax
- $3,078 · $257/mo
- Projected year-2 tax
- $3,078 · $257/mo
- Expected delta
- $0/yr ($0/mo · 0.0%)
ⓘ Screening estimate from a state-policy table — verify with the county assessor before closing.
Nearby sold comps map
Loading sold comps map…
Walkable amenities ~0.75 mi
Loading nearby amenities…
Taxation est. · year 1
- Rental income
- $27,230
- − Mortgage interest
- −$15,628
- − Property taxes
- −$3,078
- − Insurance
- −$1,395
- − Repairs & maintenance
- −$2,178
- − Management
- −$2,178
- − HOA
- −$300
- − Depreciation
- −$8,116
- Taxable loss
- −$5,645
- Est. tax savings @ 24.0%
- +$1,355
- After-tax cash flow
- $536/yr
For passive investors: Depreciation is non-cash, so a rental often shows a tax loss while cash-flowing — sheltering income. Rental losses are passive: they offset passive income freely, and up to $25,000/yr can offset ordinary (W-2) income if you actively participate and your MAGI is under $100k (phasing out to $0 by $150k); unused losses carry forward. On sale, claimed depreciation is recaptured at up to 25%, and gains may owe capital-gains tax (a 1031 exchange can defer both). Figures are a year-1 estimate at your 24.0% rate — not tax advice; consult a CPA.
Condition & rehab AI · 13 photos
This new construction home is in excellent condition with modern finishes and a well-maintained exterior. It offers a blank slate for personalization and has the potential for significant value increases with minor updates.
Value-add opportunities
- Both Painting exterior siding — Fresh paint can enhance curb appeal and home value
- Both Landscaping improvements — Enhanced landscaping can increase curb appeal and property value
- Both Add a small water feature or fountain near the pond — A water feature can enhance curb appeal and attract buyers
- Both Install smart home technology — Smart home features can increase home value and attract buyers
Renovation cost estimate screening
Value-add ROI direction
- Both Painting exterior siding — Fresh paint can enhance curb appeal and home value ↑
- Both Landscaping improvements — Enhanced landscaping can increase curb appeal and property value ↑
- Both Add a small water feature or fountain near the pond — A water feature can enhance curb appeal and attract buyers ↑
- Both Install smart home technology — Smart home features can increase home value and attract buyers ↑
ⓘ Cost ranges are severity-bucket heuristics (US national rule-of-thumb). Get contractor quotes + a written scope before underwriting a rehab budget.
Schools (NCES district)
- District
- Effingham County
- NCES district ID
- 1301980
- Math proficiency
- 49% ▼ -6.00%
- Reading proficiency
- 48% ▼ -5.00%
- Median HH income
- $60,503
- Composite
- 42.56/100
- National rank
- #3195
- State rank
- #16 of 174 in GA
Livability — Springfield
- Score
- 69/100
- State rank
- #116
- US rank
- #8573
Category grades
Schools grade is shown separately in the Schools card above.
Census & demographics
- County
- Effingham County · 68,439 people
- Metro
- Savannah, GA
- Population (ZIP)
- 23,940
- Household income
- $83,145
- Rent vs Own
- Severe rent burden
- 503.0
Population outlook (Effingham County) Hauer SSP2
- Today (2025)
- 67,399 people
- By 2030
- 72,297 · +7.3%
- By 2040
- 81,602 · +21.1%
- By 2050
- 89,494 · +32.8%
- By 2075
- 105,976 · +57.2%
- By 2100
- 111,943 · +66.1%
Race, ethnicity, and origin ACS 2023
- Neighborhood character
- Predominantly White (70%)
- Race & ethnicity
- White 70% Black 18% Hispanic / Latino 6% Two or more races 5% Asian 2%
- Hispanic origin (detail)
- Mexican 3% Puerto Rican 1%
- Common ancestry
- Italian 2% Slovak 2% Lithuanian 1%
- Foreign-born
- 5% · Canada
- Languages at home
- 95% English-only · Spanish 3% Other Indo-European 1%
Political lean MEDSL · Effingham
- 2024 margin
- Solid R (+49.1) · D 25.2% · R 74.3%
- 2008→2024 swing
- +1.6pp toward D · 2008: -50.7pp · 2024: -49.1pp
- All cycles
- 2024: R+49.1 2020: R+49.5 2016: R+55.6 2012: R+51.2 2008: R+50.7
Not yet ingested
- Civics
- —
Market trends
- HPI YoY
- ▼ -100.63%
- Current HPI
- 219.0064
- Rent YoY
- ▲ 1.52%
- Metro
- Savannah, GA
- State GDP YoY
- ▲ 2.66%
- F500 in state
- 28
Industry mix (Fortune 500 HQ in GA)
| Industry | F500 HQs | Revenue |
|---|---|---|
| Paper / Packaging | 2 | $29B |
|
||
| Retail | 1 | $160B |
|
||
| Transportation / Logistics | 1 | $91B |
|
||
| Airlines | 1 | $62B |
|
||
| Consumer Goods | 1 | $47B |
|
||
| Utilities | 1 | $25B |
|
||
Price history
-79.8% since first listed8 events — show timeline
- 2026-06-06 Listing Removed — Hive MLS
- 2026-05-01 Listed $279,000 Hive MLS
- 2026-03-20 Listing Removed — Hive MLS
- 2026-03-03 Price Changed $297,000 Hive MLS
- 2026-02-19 Price Changed $299,500 Hive MLS
- 2025-09-24 Listed $314,900 Hive MLS
- 2025-09-23 Sold (Public Records) $1,380,000 Public Records
- 2025-09-23 Sold (Public Records) $1,380,000 Public Records
Cash-flow waterfall
monthlySold comps — $/sqft
last 12 mo · ≤1 miLoading sold comps…