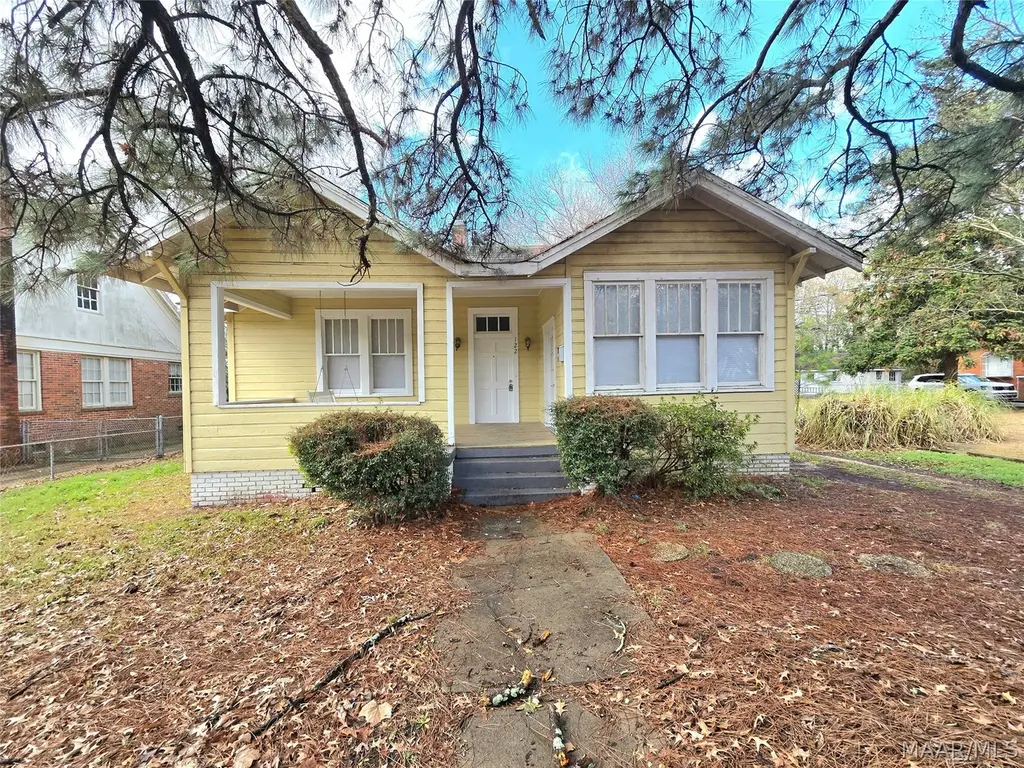
122 S Capitol Pkwy · Montgomery, AL
Flood risk 1/10 · Minimal
- FEMA flood zone
- X (unshaded)
- Chance of flooding over 30 yrs
- 0.0%
- Est. flood insurance / yr
- $507 – $1,088
Fire risk 1/10 · Minimal
- Est. fire insurance / yr
- $916 – $1,700
Heat risk 7/10 · Major
- Hot days now (above 107°F)
- 7 days/yr
- Hot days in 30 yrs
- 19 days/yr
Wind risk 8/10 · Major
- Chance of severe wind over 30 yrs
- 80.0%
Air-quality risk 3/10 · Minor
- Unhealthy air days now
- 4 days/yr
- Unhealthy air days in 30 yrs
- 4 days/yr
Risk factors via First Street. Map © Google.
Why this score? — see what drove the C+ grade
The composite is a weighted blend of 9 inputs, each scored 0–100. Each bar is that input's sub-score; the figure is the points it added to the 100-point composite (weight × sub-score).
- Cash flow +24.8/30.0
- ARV discount +13.0/15.0
- DSCR +8.0/10.0
- 1% rule +5.2/10.0
- Rent growth +3.8/5.0
- Livability +3.2/5.0
- Condition / age +2.5/5.0
- Schools +1.7/10.0
- Appreciation +0.0/10.0
$137,000
🖨 Deal sheet (PDF) 📄 Offer letter ✓ Due diligence
Listing remarks MLS
A Great Value-Add Opportunity Near Downtown Montgomery. Well Positioned In Historic Capitol Heights, 122 S Capitol Pkwy Presents Ample Opportunities To Begin Or Enhance Your Rental Portfolio- Or Start Your Home Journey With Class! Fresh Paint Flows Throughout This 4 Bedroom/2 Bath Floorplan Effortlessly, With Large Rooms Filled With Bright-Natural Light. Timelessly-Preserved Original Hardwoods Leads You To A Large Kitchen With Tons Of Cabinet And Countertop Space. After You Stop By 4 Generous Bedrooms/2 Huge Baths, And A Backyard Deck, Finish Your Tour With A Bonus Basement Space That Will Make This Home A Top Choice! Schedule Your Tour Today! * * This Property Can Also Be Purchased Along With 404 S Capitol Ave, 2040 McKinley Ave, 2106 Capitol Ave, 2134 Winona Ave, 218 N Lewis St, And 690 Ponce De Leon Ave-All Or In Part At A Portfolio Package Price Of $800,000 * * Purposefully Located Near Montgomery's Thriving Downtown District. Please Verify Any Pertinent Info.
Key facts
- Bonus basement space
- Large kitchen
- Backyard deck
Tags
Neighborhood map
What this means for you Summary
Snapshot
- This is a 4-bed/2.0-bath single-family listed at $137k.
Deal economics
- At list price, monthly cash flow is $291 ($3k/yr) — positive.
- The deal already cash-flows at list — no discount required.
- Meets the 1% rule at list price ($1k rent vs $137k).
- Recommended offer: $121k (12.0% below list) — sets the bar for market timing.
- Cap rate 8.8% vs local median 6.0% in Montgomery — top-decile yield for the area; either an underpriced asset or a hidden risk that comps aren't pricing in. Stress-test before assuming the spread holds.
Location & tenants
- Location reads 65/100 on livability (#138 in AL) — a middle-class / working-renter tenant base. Strengths: cost of living A+, housing A+; Watch: schools C-, employment D, crime F.
- Montgomery County (urban): math 9% / reading 31% proficiency, ranked #106 of 129 in AL (top 82%) — low school quality limits family demand, transient renter base, plan for 1-2y turnover; 70% free/reduced lunch — lower-income household profile, screen leases tightly.
- Market conditions: Rents rising fast (+5.0%/yr); 67 active listings in the ZIP; 18 comparable units currently listed for rent nearby; rentals at typical pace (median 22d on market — plan ~3-4 weeks tenant-placement turnaround); lower-income renter base — watch delinquency; 460 units permitted in Montgomery County in 2024 (37 in 5+ unit buildings).
- At $1,397/mo this rent would consume 52% of the median local household income ($32k/yr) (locally 642% of renters already pay >50% of income on rent) — very limited rent-growth headroom before tenants either downsize or default.
Forward outlook
- Local home prices are declining (-3.0%/yr); year-one equity from $947 of loan paydown is wiped out by about $4k of value loss. Plan a longer hold.
- Montgomery County population projected to shrink 8% by 2050 — rents likely to lag national; underwrite the cash flow, not the appreciation.
- At projected returns (-3.0% appreciation + 5.0% rent growth), your $38k cash investment doubles in ~10 years — after that, you're playing with house money.
Negotiation context
- It's been on market 121 days — a 12% lower offer ($121k) is reasonable based on typical stale-listing flexibility.
- 6 sale attempts since 27y ago; this cycle's ask has dropped $28k (17%) from the opening price — seller is motivated, your offer sets the floor, not the list.
- Current owner paid $73k; list at $137k implies a 87% gain — meaningful room to come down on a strong offer.
Risks & watch-outs
- Watch-outs: built in 1920 — expect roof / HVAC / electrical / plumbing capex.
- Climate carrying-cost: severe wind risk, 80% chance of damaging wind over 30y; extreme-heat days projected 7→19/yr by 2055 (HVAC capex compounding) — expect insurance premiums to compound above CPI over the hold.
Questions for the listing agent
- It's been on market 121 days. Have you received any prior offers? Is the seller open to a 12% concession, seller financing, or rate buy-down credit?
- Built in 1920 — when were the roof, HVAC, electrical panel, plumbing, and water heater last replaced?
- Why hasn't it sold? Are there any deal-killer items the seller is aware of (foundation, flood, title, zoning, code violations)?
- Is there a deadline driving the sale (1031 exchange, divorce, estate, relocation)? That informs how much negotiation room exists.
- Crime grade is F in this area — have there been break-ins, vandalism, or insurance claims at this property in the last 3 years? What carrier currently insures it and at what premium?
- What's the average days-on-market for RENTAL listings here right now (not sales)? A rising rental-DOM trend means longer vacancies and softer asking-rent achievability than the comps imply.
- What's the recent tenant-quality profile in this submarket — average credit score on applications, eviction rate, late-payment / NSF rate, and stable-employment percentage? A property-management company in the area should have these aggregated.
- How much new for-sale + rental construction is in the pipeline within 1–3 miles? Heavy new supply typically softens prices + rents 12–24 months out; constrained supply supports both.
Investment metrics
- 1% rule
- 1.02% ✓
- Cap rate
- 8.84%
- Cash-on-cash
- 9.10%
- DSCR
- 1.40
- GRM
- 8.2
CMA / ARV
- ARV (median comp)
- $156,270
- List price
- $137,000
- Delta
- -12.33%
- Verdict
- UNDERPRICED
- Comps
- 20 within 1.0 mi
Show comp detail 12 sales within ~0.75 mi
| Address | Dist | Beds/Ba | Sqft | Sold | Price | $/sf | Match |
|---|---|---|---|---|---|---|---|
| 33 S Capitol Dr | 0.13mi | 3/1.5 (-1) | 2,039 (+4%) | 8mo | $95,000 | $47 | 74 |
| 2100 Capitol Ave | 0.43mi | 3/2.0 (-1) | 2,056 (+5%) | 2mo | $145,000 | $71 | 65 |
| 446 Buford St | 0.40mi | 3/1.0 (-1) | 1,899 (-3%) | 4mo | $108,000 | $57 | 64 |
| 1807 St Charles Ave | 0.33mi | 4/2.0 | 1,736 (-11%) | 2mo | $65,500 | $38 | 64 |
| 1529 Madison Ave | 0.25mi | 3/2.0 (-1) | 2,180 (+12%) | 3mo | $55,000 | $25 | 62 |
| 1536 Yancey Ave | 0.43mi | 3/2.0 (-1) | 1,804 (-8%) | 8mo | $151,560 | $84 | 56 |
| 2046 Madison Ave | 0.44mi | 4/3.0 | 2,242 (+15%) | 7mo | $202,000 | $90 | 45 |
| 2219 St Charles Ave | 0.66mi | 3/2.0 (-1) | 1,736 (-11%) | 2mo | $155,000 | $89 | 44 |
| 2110 Charles Ave | 0.51mi | 3/2.0 (-1) | 1,750 (-10%) | 12mo | $86,000 | $49 | 44 |
| 102 Vonora Ave | 0.40mi | 3/1.0 (-1) | 1,677 (-14%) | 11mo | $130,000 | $78 | 39 |
| 2041 Capitol Ave | 0.41mi | 3/1.0 (-1) | 1,700 (-13%) | 15mo | $124,000 | $73 | 38 |
| 2134 Winona Ave | 0.59mi | 3/1.0 (-1) | 1,664 (-15%) | 1mo | $101,700 | $61 | 37 |
Match score weights: distance 35% · size 25% · config 20% · recency 20%. Top-matched comps best support the ARV.
Projected returns pro-forma
-3.0% appreciation · 5.05% rent growth · sell at horizon
- IRR
- -0.5%
- Equity multiple
- 0.98×
- Total profit
- $-800
- Equity at exit
- $20,427
- IRR
- 10.9%
- Equity multiple
- 1.93×
- Total profit
- $35,485
- Equity at exit
- $11,845
Cash invested: $38,360 (down + closing). Projections, not guarantees.
Landlord ↔ Tenant lean methodology
- Overall (STATE)
- 90 Strongly Landlord-Friendly
- State Alabama
- 90 Strongly Landlord-Friendly · R+15
- County
- — inherits STATE
- City
- — inherits STATE
ZIP-level market 36107
- Home prices YoY
- -10.9%
- Rents YoY
- 5.0%
- Active inventory
- 67
- Price-to-rent
- 8.2×
Monthly cashflow live
- Estimated rent
- $1,397 high interval (Pro) →
- Mortgage (P&I)
- −$718
- Tax from tax record
- −$37 /mo · $445/yr
- Insurance
- −$57
- HOA
- −$0
- Vacancy / Maint / Mgmt
- −$293
- Net cashflow
- $291
Break-even live
Sensitivity live
| Price | -10% $368 | -5% $330 | +0% $291 | +5% $252 | +10% $213 |
|---|---|---|---|---|---|
| Rent | -10% $180 | -5% $236 | +0% $291 | +5% $346 | +10% $401 |
| Rate | -1.0pp $360 | -0.5pp $326 | base $291 | +0.5pp $255 | +1.0pp $219 |
UW: 25.0% down · 7.5% · 30yr · 1.5% tax · 5.0% vac · 8.0% maint · 8.0% mgmt
Financing live
Cash to close
- Down payment
- $34,250
- Closing costs
- $4,110
- Reserves months
- —
- Total cash needed
- —
Loan-product check · same deal, 3 products live
Conventional
25% down · 7.5% · 30yr
- Down + closing
- —
- Monthly P&I
- —
- Monthly cashflow
- —
- DSCR
- —
- Eligible?
- —
Personal DTI + credit; lowest rate.
DSCR
20% down · 8.5% · 30yr
- Down + closing
- —
- Monthly P&I
- —
- Monthly cashflow
- —
- DSCR
- —
- Eligible?
- —
No personal income docs; deal must DSCR.
Hard money
10% down · 12.0% · 12mo
- Down + closing
- —
- Monthly P&I
- —
- Monthly cashflow
- —
- DSCR
- —
- Eligible?
- —
Short-term bridge; refi at stabilization.
Rent comps 18 comps
| Address | Beds | Baths | Sqft | Rent | $/sqft | DOM | Units | Dist |
|---|---|---|---|---|---|---|---|---|
| 128 S Capitol Pkwy Montgomery, AL | 3.0 | 1.0 | 1550 | $1,500 | $0.97 | 44d | 1 | 0.04mi |
| 2004 Capitol Ave Unit 1043879P Montgomery, AL | 4.0 | 2.5 | 1797 | $3,518 | $1.96 | 14d | 1 | 0.34mi |
| 2009 Palmetto St Montgomery, AL | 3.0 | 1.0 | 1487 | $1,050 | $0.71 | 44d | 1 | 0.37mi |
| 2113 Brewton St Montgomery, AL | 3.0 | 1.0 | 1363 | $1,150 | $0.84 | 44d | 1 | 0.46mi |
| 1008 Pelham St Montgomery, AL | 4.0 | 2.0 | 1288 | $1,300 | $1.01 | 44d | 1 | 0.56mi |
| 2243 Winona Ave Montgomery, AL | 3.0 | 1.0 | 1492 | $1,225 | $0.82 | 21d | 1 | 0.70mi |
| 15 Bradley Dr Montgomery, AL | 3.0 | 2.0 | 1365 | $1,500 | $1.10 | 21d | 1 | 1.01mi |
| 7 Bradley Dr Montgomery, AL | 3.0 | 2.0 | 1529 | $1,500 | $0.98 | 14d | 1 | 1.01mi |
| 18 Oak Forest Dr Montgomery, AL | 3.0 | 2.0 | 1580 | $1,050 | $0.66 | 21d | 1 | 1.05mi |
| 2769 Pelzer Ave Montgomery, AL | 3.0 | 2.0 | 1608 | $1,325 | $0.82 | 44d | 1 | 1.18mi |
| 2043 Hazel Hedge Ln Montgomery, AL | 4.0 | 3.0 | 2001 | $1,650 | $0.82 | 14d | 1 | 1.24mi |
| 2814 Ashley Ave Montgomery, AL | 3.0 | 2.0 | 1683 | $1,350 | $0.80 | 14d | 1 | 1.32mi |
| 401 Ridgewood Ln Montgomery, AL | 3.0 | 2.0 | 1513 | $1,195 | $0.79 | 21d | 1 | 1.39mi |
| 3136 Harrison Rd Montgomery, AL | 3.0 | 1.5 | 1355 | $1,025 | $0.76 | 44d | 1 | 1.41mi |
| 2001 Speigle St Montgomery, AL | 3.0 | 1.0 | 1260 | $1,035 | $0.82 | 44d | 1 | 1.42mi |
| 2822 Sumter Ave Montgomery, AL | 3.0 | 2.5 | 1617 | $1,300 | $0.80 | 21d | 1 | 1.44mi |
| 2009 Bullard St Montgomery, AL | 5.0 | 2.0 | 1992 | $1,975 | $0.99 | 21d | 1 | 1.44mi |
| 3233 Hillcrest Ln Montgomery, AL | 3.0 | 2.0 | 1278 | $1,395 | $1.09 | 21d | 1 | 1.49mi |
Listing history 23 events
-
2026-06-18days on market $137,000 Active 121 DOM
-
2026-06-17days on market $137,000 Active 120 DOM
-
2026-06-16days on market $137,000 Active 119 DOM
-
2026-06-15days on market $137,000 Active 118 DOM
-
2026-06-14days on market $137,000 Active 116 DOM
-
2026-06-13pricedays on market $137,000 Active 115 DOM
-
2026-06-10days on market $148,500 Active 113 DOM
-
2026-06-09days on market $148,500 Active 112 DOM
-
2026-06-08days on market $148,500 Active 111 DOM
-
2026-06-07days on market $148,500 Active 110 DOM
-
2026-06-03days on market $148,500 Active 106 DOM
-
2026-06-02days on market $148,500 Active 105 DOM
-
2026-06-01days on market $148,500 Active 104 DOM
-
2026-05-31days on market $148,500 Active 103 DOM
-
2026-05-30days on market $148,500 Active 102 DOM
-
2026-04-08price $148,500 985-char remark
Show marketing remark (985 chars)
A Great Value-Add Opportunity Near Downtown Montgomery. Well Positioned In Historic Capitol Heights, 122 S Capitol Pkwy Presents Ample Opportunities To Begin Or Enhance Your Rental Portfolio- Or Start Your Home Journey With Class! Fresh Paint Flows Throughout This 4 Bedroom/2 Bath Floorplan Effortlessly, With Large Rooms Filled With Bright-Natural Light. Timelessly-Preserved Original Hardwoods Leads You To A Large Kitchen With Tons Of Cabinet And Countertop Space. After You Stop By 4 Generous Bedrooms/2 Huge Baths, And A Backyard Deck, Finish Your Tour With A Bonus Basement Space That Will Make This Home A Top Choice! Schedule Your Tour Today! * * This Property Can Also Be Purchased Along With 404 S Capitol Ave, 2040 McKinley Ave, 2106 Capitol Ave, 2134 Winona Ave, 218 N Lewis St, And 690 Ponce De Leon Ave-All Or In Part At A Portfolio Package Price Of $800,000 * * Purposefully Located Near Montgomery's Thriving Downtown District. Please Verify Any Pertinent Info.
-
2026-02-17$165,000 Active 985-char remark
Show marketing remark (985 chars)
A Great Value-Add Opportunity Near Downtown Montgomery. Well Positioned In Historic Capitol Heights, 122 S Capitol Pkwy Presents Ample Opportunities To Begin Or Enhance Your Rental Portfolio- Or Start Your Home Journey With Class! Fresh Paint Flows Throughout This 4 Bedroom/2 Bath Floorplan Effortlessly, With Large Rooms Filled With Bright-Natural Light. Timelessly-Preserved Original Hardwoods Leads You To A Large Kitchen With Tons Of Cabinet And Countertop Space. After You Stop By 4 Generous Bedrooms/2 Huge Baths, And A Backyard Deck, Finish Your Tour With A Bonus Basement Space That Will Make This Home A Top Choice! Schedule Your Tour Today! * * This Property Can Also Be Purchased Along With 404 S Capitol Ave, 2040 McKinley Ave, 2106 Capitol Ave, 2134 Winona Ave, 218 N Lewis St, And 690 Ponce De Leon Ave-All Or In Part At A Portfolio Package Price Of $800,000 * * Purposefully Located Near Montgomery's Thriving Downtown District. Please Verify Any Pertinent Info.
-
2012-12-18$137,500
-
2004-08-05soldstatus $73,420
-
2002-10-05$79,950
-
2002-03-22$95,900
-
2000-05-19$74,900
-
1999-01-26$73,700
ⓘ Source: listings_history table (triggers on properties + properties_extension) + one-shot
backfill from property_details.listing_events for pre-trigger history.
Tax reassessment forecast AL · Resets to sale price
- Current annual tax
- $445 · $37/mo
- Projected year-2 tax
- $562 · $47/mo
- Expected delta
- +$116/yr (+$10/mo · 26.2%)
ⓘ Screening estimate from a state-policy table — verify with the county assessor before closing.
Climate risk First Street
- Flood 1/10 Low FEMA zone X (unshaded) · 0% chance over 30 yrs
- Wildfire 1/10 Low
- Heat 7/10 Severe 7 d/yr ≥107°F today · 19 d/yr by 30 yrs out
- Wind 8/10 Severe 80% chance of damaging wind over 30 yrs
- Air quality 3/10 Moderate 4 unhealthy d/yr today · 4 by 30 yrs out
Nearby sold comps map
Loading sold comps map…
Walkable amenities ~0.75 mi
Loading nearby amenities…
Taxation est. · year 1
- Rental income
- $16,761
- − Mortgage interest
- −$7,674
- − Property taxes
- −$445
- − Insurance
- −$685
- − Repairs & maintenance
- −$1,341
- − Management
- −$1,341
- − Depreciation
- −$3,985
- Taxable income
- $1,290
- Est. tax owed @ 24.0%
- −$309
- After-tax cash flow
- $3,180/yr
For passive investors: Depreciation is non-cash, so a rental often shows a tax loss while cash-flowing — sheltering income. Rental losses are passive: they offset passive income freely, and up to $25,000/yr can offset ordinary (W-2) income if you actively participate and your MAGI is under $100k (phasing out to $0 by $150k); unused losses carry forward. On sale, claimed depreciation is recaptured at up to 25%, and gains may owe capital-gains tax (a 1031 exchange can defer both). Figures are a year-1 estimate at your 24.0% rate — not tax advice; consult a CPA.
Schools (NCES district)
- District
- Montgomery County
- NCES district ID
- 0102430
- Math proficiency
- 9% ▼ -21.00%
- Reading proficiency
- 31% ▼ -1.00%
- Median HH income
- $43,902
- Composite
- 17.24/100
- National rank
- #9093
- State rank
- #106 of 129 in AL
Livability — Montgomery
- Score
- 65/100
- State rank
- #138
- US rank
- #13416
Category grades
Schools grade is shown separately in the Schools card above.
Census & demographics
- Census place
- Montgomery, AL
- County
- Montgomery County · 190,016 people
- City population
- 175,913
- Metro
- Montgomery, AL
- Population (ZIP)
- 8,001
- Household income
- $32,492
- Rent vs Own
- Severe rent burden
- 642.0
Population outlook (Montgomery County) Hauer SSP2
- Today (2025)
- 224,008 people
- By 2030
- 221,460 · -1.1%
- By 2040
- 214,179 · -4.4%
- By 2050
- 204,912 · -8.5%
- By 2075
- 177,821 · -20.6%
- By 2100
- 145,134 · -35.2%
Race, ethnicity, and origin ACS 2023
- Neighborhood character
- Diverse neighborhood (Simpson 0.69)
- Race & ethnicity
- Black 43% White 27% Hispanic / Latino 23% Two or more races 20%
- Hispanic origin (detail)
- Mexican 8% Cuban 3%
- Common ancestry
- Slovak 1% Iranian 1% Serbian 1%
- Foreign-born
- 11% · Canada
- Languages at home
- 83% English-only · Spanish 13%
Political lean MEDSL · Montgomery
- 2024 margin
- Solid D (+30.7) · D 64.8% · R 34.1% · Other 1.1%
- 2008→2024 swing
- +11.5pp toward D · 2008: 19.2pp · 2024: 30.7pp
- All cycles
- 2024: D+30.7 2020: D+31.5 2016: D+26.2 2012: D+24.3 2008: D+19.2
Not yet ingested
- Civics
- —
Market trends
- HPI YoY
- ▼ -18.16%
- Current HPI
- 147.8065
- Rent YoY
- ▲ 5.05%
- Metro
- Montgomery, AL
- State GDP YoY
- ▲ 2.94%
- F500 in state
- 4
Industry mix (Fortune 500 HQ in AL)
| Industry | F500 HQs | Revenue |
|---|---|---|
| Financial Services | 1 | $8B |
|
||
| Healthcare | 1 | $5B |
|
||
Price history
+101.5% since first listed8 events — show timeline
- 2026-04-08 Price Changed $148,500 MAAR
- 2026-02-17 Listed $165,000 MAAR
- 2012-12-18 Listed $137,500 MAAR
- 2004-08-05 Sold (MLS) $73,420 MAAR
- 2002-10-05 Listed $79,950 MAAR
- 2002-03-22 Listed $95,900 MAAR
- 2000-05-19 Listed $74,900 MAAR
- 1999-01-26 Listed $73,700 MAAR
Property tax history
+5.3%/yrLatest (2025): $445 · -9.6% YoY. Source: county tax records.
Cash-flow waterfall
monthlySold comps — $/sqft
last 12 mo · ≤1 miLoading sold comps…