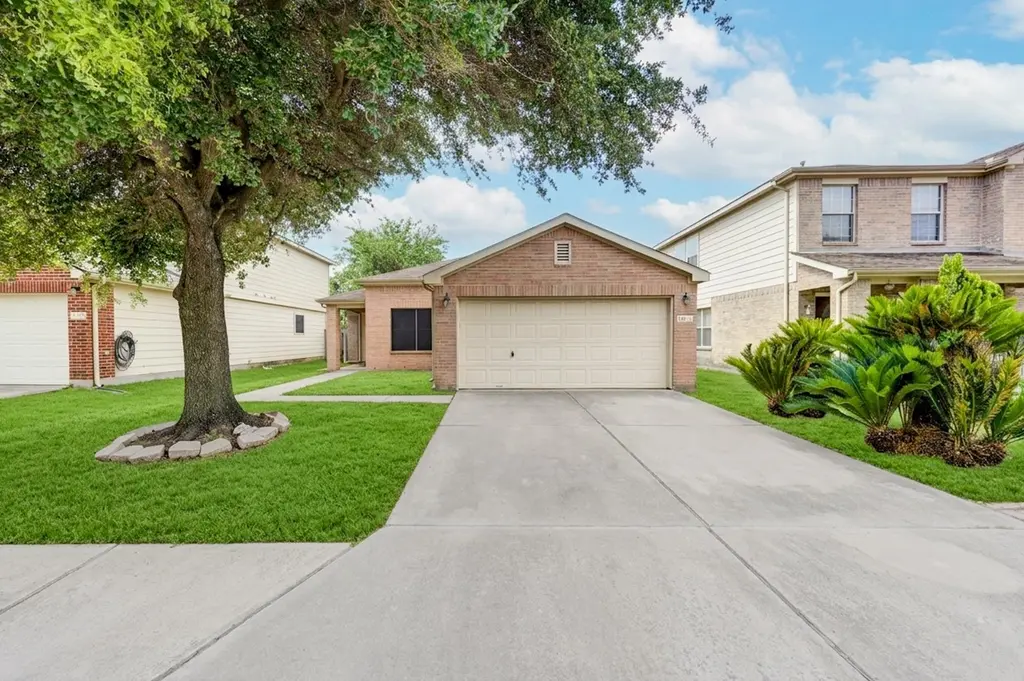
15623 Clarks Fork Ct · Houston, TX
Flood risk 6/10 · Moderate
- FEMA flood zone
- X (unshaded)
- Chance of flooding over 30 yrs
- 0.71%
- Est. flood insurance / yr
- $507 – $1,088
Fire risk 1/10 · Minimal
- Est. fire insurance / yr
- $1,222 – $2,270
Heat risk 9/10 · Severe
- Hot days now (above 110°F)
- 7 days/yr
- Hot days in 30 yrs
- 23 days/yr
Wind risk 8/10 · Major
- Chance of severe wind over 30 yrs
- 99.0%
Air-quality risk 3/10 · Minor
- Unhealthy air days now
- 3 days/yr
- Unhealthy air days in 30 yrs
- 4 days/yr
Risk factors via First Street. Map © Google.
Why this score? — see what drove the D grade
The composite is a weighted blend of 9 inputs, each scored 0–100. Each bar is that input's sub-score; the figure is the points it added to the 100-point composite (weight × sub-score).
- ARV discount +11.3/15.0
- Cash flow +7.9/30.0
- Appreciation +5.8/10.0
- Schools +4.1/10.0
- Livability +3.7/5.0
- 1% rule +3.6/10.0
- Condition / age +2.5/5.0
- Rent growth +2.2/5.0
- DSCR +2.0/10.0
$199,000
🖨 Deal sheet 📄 Offer letter ✓ Due diligence
Listing remarks MLS
Cute as a button 3-bedroom, 2-bath home in Blue Creek! Great open floor plan. Lovely neutral color in living with half wall open to spacious kitchen. Breakfast/kitchen combo. Master is quiet at rear of home. Secondary bedrooms have custom color. Laminate wood floors in common areas and bedrooms. Laundry in house. Flex space in enclosed patio with A/C. Good sized backyard.
Key facts
- 5,344 sq ft lot
- 2 garage spots
- Built 2004
Tags
Property features AI
Finance
- HOA & community: Blue Creek Ranch community; Annual association fee of $395
Exterior
- Parking: Attached garage with 2 spaces
- Utilities: Public water; Public sewer
- Home design: Residential property; Entry on slab foundation
- Construction: Built in 2004; Brick and cement siding exterior; Composition roof; Slab foundation
- Exterior features: Subdivision setting; Concrete road access
Interior
- Kitchen: Dishwasher; Disposal; Microwave
- Bathrooms: 2 full bathrooms
- Heating & cooling: Central heating (gas); Central electric air conditioning
- Interior features: Laminate counters; Tub with shower; Kitchen and dining combined; One fireplace; 7 total rooms
Neighborhood map
What this means for you Summary
Snapshot
- This is a 3-bed/2.0-bath single-family listed at $199k.
Deal economics
- At list price, monthly cash flow is $-213 ($-3k/yr) — negative.
- To cash-flow at today's rent, offer at most $161k (18.9% below list).
- To meet the 1% rule (rent ≥ 1% of price), the offer needs to be $171k (14.0% below list).
- Recommended offer: $161k (18.9% below list) — sets the bar for cash-flow.
- Cap rate 5.0% vs local median 3.2% in Houston — top-decile yield for the area; either an underpriced asset or a hidden risk that comps aren't pricing in. Stress-test before assuming the spread holds.
Location & tenants
- Location reads 74/100 on livability (#184 in TX, #4,771 nationally) — a middle-class / working-renter tenant base. Strengths: amenities A+, cost of living A+, housing A+; Watch: crime F.
- Klein ISD (suburban): math 41% / reading 48% proficiency, ranked #213 of 826 in TX (top 26%) — families likely to look elsewhere, expect single-tenant / working-renter base with shorter leases.
- Zoned schools: Epps Island El (math 28% / reading 34%, grade F, #2,429 of 4,322 statewide, top 57%, 541 students, 85% FRL); Klein Forest H S (math 20% / reading 28%, grade F, #1,333 of 1,632 statewide, top 82%, 3,481 students, 79% FRL) — zoned schools average 82% FRL vs 37% district-wide (45 pts higher); higher-poverty schools than district average — tighter screening recommended.
- Zoned-school proficiency averages 28% at this address vs 44% district-wide (-17 pts) — the specific schools serving this property underperform the Klein ISD average; the district grade overstates school quality for this exact location.
- Market conditions: Rents soft (-1.2%/yr); 79 active listings in the ZIP; 8 comparable units currently listed for rent nearby; rentals lingering (median 44d on market — plan ~5-8 weeks vacancy on turnover, expect pricing pressure); 50% of comp listings sitting > 30 days — soft ceiling on asking rent; 29,883 units permitted in Harris County in 2024 (8,621 in 5+ unit buildings).
- This rent runs 35% of the median local income ($58k/yr) — at the standard rent-burdened threshold; future hikes will face affordability resistance.
Forward outlook
- In year one you build about $5k of equity ($1k loan paydown + $3k appreciation (1.6% local appreciation)).
- Harris County population projected at +47% by 2050 — long-run rental-demand tailwind backs the buy-and-hold thesis.
- By year 8, paydown + projected appreciation supports a ~$35k cash-out refi (75% LTV) — recoverable capital for the next deal without selling this one.
Negotiation context
- It's been on market 21 days — a 2% lower offer ($196k) is reasonable based on typical stale-listing flexibility.
- 3 sale attempts since 9y ago with the ask held roughly flat each time — persistent listings suggest the price (not the market) is what's stuck; bring a comps-based counter.
Risks & watch-outs
- Climate carrying-cost: major flood risk; severe wind risk, 99% chance of damaging wind over 30y; extreme-heat days projected 7→23/yr by 2055 (HVAC capex compounding) — expect insurance premiums to compound above CPI over the hold.
Questions for the listing agent
- What do current leases actually rent for vs. the listed asking? Can we see a recent rent roll and the last 12 months of T-12 income?
- What does the HOA fee cover, when was the last increase, and are there any pending special assessments or reserve-fund shortfalls?
- Is there a deadline driving the sale (1031 exchange, divorce, estate, relocation)? That informs how much negotiation room exists.
- Schools are D-rated, which usually means shorter tenancies and higher turnover. Who's the typical renter profile here, and what's been the actual vacancy rate?
- Crime grade is F in this area — have there been break-ins, vandalism, or insurance claims at this property in the last 3 years? What carrier currently insures it and at what premium?
- The area grade is low — what's the realistic commute time and amenity access for the typical tenant pool here? Any planned neighborhood developments (good or bad) we should know about?
- What's the average days-on-market for RENTAL listings here right now (not sales)? A rising rental-DOM trend means longer vacancies and softer asking-rent achievability than the comps imply.
- What's the recent tenant-quality profile in this submarket — average credit score on applications, eviction rate, late-payment / NSF rate, and stable-employment percentage? A property-management company in the area should have these aggregated.
- How much new for-sale + rental construction is in the pipeline within 1–3 miles? Heavy new supply typically softens prices + rents 12–24 months out; constrained supply supports both.
Investment metrics
- 1% rule
- 0.86% ✗
- Cap rate
- 5.01%
- Cash-on-cash
- -4.58%
- DSCR
- 0.80
- GRM
- 9.7
CMA / ARV
- ARV (on-the-fly)
- $217,430
- Comps found
- 4
Show comp detail 4 sales within ~0.75 mi
| Address | Dist | Beds/Ba | Sqft | Sold | Price | $/sf | Match |
|---|---|---|---|---|---|---|---|
| 13627 Clarks Fork Dr | 0.07mi | 3/2.0 | 1,309 (+2%) | 4mo | $220,000 | $168 | 89 |
| 15635 Western Skies Dr | 0.10mi | 3/2.0 | 1,317 (+3%) | 13mo | $217,900 | $165 | 80 |
| 15419 Bay Lodge Ln | 0.08mi | 3/2.0 | 1,469 (+15%) | 9mo | $249,900 | $170 | 64 |
| 8023 Lawn Wood Ln | 0.67mi | 3/2.0 | 1,243 (-3%) | 19mo | $238,000 | $191 | 48 |
Match score weights: distance 35% · size 25% · config 20% · recency 20%. Top-matched comps best support the ARV.
Projected returns pro-forma
1.6% appreciation · 0.0% rent growth · sell at horizon
- IRR
- -3.1%
- Equity multiple
- 0.84×
- Total profit
- $-8,802
- Equity at exit
- $74,208
- IRR
- 0.1%
- Equity multiple
- 1.02×
- Total profit
- $906
- Equity at exit
- $103,664
Cash invested: $55,720 (down + closing). Projections, not guarantees.
Landlord ↔ Tenant lean methodology
- Overall (STATE)
- 87 Strongly Landlord-Friendly
- State Texas
- 87 Strongly Landlord-Friendly · R+5
- County
- — inherits STATE
- City
- — inherits STATE
ZIP-level market 77086
- Home prices YoY
- 0.6%
- Rents YoY
- -1.2%
- Active inventory
- 79
- Price-to-rent
- 9.7×
Monthly cashflow live
- Estimated rent
- $1,711 high interval (Pro) →
- Mortgage (P&I)
- −$1,044
- Tax from tax record
- −$405 /mo · $4,858/yr
- Insurance
- −$83
- HOA
- −$33
- Vacancy / Maint / Mgmt
- −$359
- Net cashflow
- $-213
Break-even live
UW: 25.0% down · 7.5% · 30yr · 1.5% tax · 5.0% vac · 8.0% maint · 8.0% mgmt
Financing live
Cash to close
- Down payment
- $49,750
- Closing costs
- $5,970
- Reserves months
- —
- Total cash needed
- —
Loan-product check · same deal, 3 products live
Conventional
25% down · 7.5% · 30yr
- Down + closing
- —
- Monthly P&I
- —
- Monthly cashflow
- —
- DSCR
- —
- Eligible?
- —
Personal DTI + credit; lowest rate.
DSCR
20% down · 8.5% · 30yr
- Down + closing
- —
- Monthly P&I
- —
- Monthly cashflow
- —
- DSCR
- —
- Eligible?
- —
No personal income docs; deal must DSCR.
Hard money
10% down · 12.0% · 12mo
- Down + closing
- —
- Monthly P&I
- —
- Monthly cashflow
- —
- DSCR
- —
- Eligible?
- —
Short-term bridge; refi at stabilization.
Rent comps 8 comps
| Address | Beds | Baths | Sqft | Rent | $/sqft | DOM | Units | Dist |
|---|---|---|---|---|---|---|---|---|
| 7750 Water Park Ln Houston, TX | 4.0 | 2.0 | 1209 | $1,900 | $1.57 | 43d | 1 | 0.98mi |
| 9526 Golden Wood Ln Houston, TX | 3.0 | 2.0 | 1687 | $1,850 | $1.10 | 43d | 1 | 1.08mi |
| 9410 Fairbanks North Houston Rd Houston, TX | 3.0 | 2.0 | 1331 | $1,733 | $1.30 | 1d | 1 | 1.23mi |
| 9410 Fairbanks North Houston Rd Houston, TX | 2.0 | 2.0 | 1312 | $1,449 | $1.10 | 12d | 1 | 1.23mi |
| 9410 Fairbanks North Houston Rd Houston, TX | 2.0 | 2.0 | 1312 | $1,449 | $1.10 | 43d | 1 | 1.23mi |
| 9410 Fairbanks North Houston Rd Houston, TX | 3.0 | 2.0 | 1331 | $1,733 | $1.30 | 5d | 1 | 1.23mi |
| 5113 Caldera Ct Houston, TX | 3.0 | 2.5 | 1847 | $1,841 | $1.00 | 7d | 1 | 1.39mi |
| 11430 Hackmatack Way Houston, TX | 3.0 | 3.0 | 1644 | $2,200 | $1.34 | 43d | 1 | 1.39mi |
HOA detail
- Monthly dues
- $33 · $396/yr
Listing history 23 events
-
2026-06-18days on market $199,000 Active 21 DOM
-
2026-06-17days on market $199,000 Active 20 DOM
-
2026-06-16pricedays on market $199,000 Active 19 DOM
-
2026-06-15days on market $209,000 Active 18 DOM
-
2026-06-13days on market $209,000 Active 16 DOM
-
2026-06-09days on market $209,000 Active 12 DOM
-
2026-06-08days on market $209,000 Active 11 DOM
-
2026-06-07days on market $209,000 Active 10 DOM
-
2026-06-04days on market $209,000 Active 7 DOM
-
2026-06-03days on market $209,000 Active 6 DOM
-
2026-06-02days on market $209,000 Active 5 DOM
-
2026-06-01days on market $209,000 Active 4 DOM
-
2026-05-31days on market $209,000 Active 3 DOM
-
2026-05-28$209,000 Active
-
2024-02-01historical $1,750
-
2023-11-14$1,750
-
2017-08-31soldstatus
-
2017-08-26soldstatus Sold 374-char remark
Show marketing remark (374 chars)
Cute as a button 3-bedroom, 2-bath home in Blue Creek! Great open floor plan. Lovely neutral color in living with half wall open to spacious kitchen. Breakfast/kitchen combo. Master is quiet at rear of home. Secondary bedrooms have custom color. Laminate wood floors in common areas and bedrooms. Laundry in house. Flex space in enclosed patio with A/C. Good sized backyard.
-
2017-08-15status Pending 374-char remark
Show marketing remark (374 chars)
Cute as a button 3-bedroom, 2-bath home in Blue Creek! Great open floor plan. Lovely neutral color in living with half wall open to spacious kitchen. Breakfast/kitchen combo. Master is quiet at rear of home. Secondary bedrooms have custom color. Laminate wood floors in common areas and bedrooms. Laundry in house. Flex space in enclosed patio with A/C. Good sized backyard.
-
2017-08-14status Option Pending 374-char remark
Show marketing remark (374 chars)
Cute as a button 3-bedroom, 2-bath home in Blue Creek! Great open floor plan. Lovely neutral color in living with half wall open to spacious kitchen. Breakfast/kitchen combo. Master is quiet at rear of home. Secondary bedrooms have custom color. Laminate wood floors in common areas and bedrooms. Laundry in house. Flex space in enclosed patio with A/C. Good sized backyard.
-
2017-08-05status Pending 374-char remark
Show marketing remark (374 chars)
Cute as a button 3-bedroom, 2-bath home in Blue Creek! Great open floor plan. Lovely neutral color in living with half wall open to spacious kitchen. Breakfast/kitchen combo. Master is quiet at rear of home. Secondary bedrooms have custom color. Laminate wood floors in common areas and bedrooms. Laundry in house. Flex space in enclosed patio with A/C. Good sized backyard.
-
2017-07-24status Option Pending 374-char remark
Show marketing remark (374 chars)
Cute as a button 3-bedroom, 2-bath home in Blue Creek! Great open floor plan. Lovely neutral color in living with half wall open to spacious kitchen. Breakfast/kitchen combo. Master is quiet at rear of home. Secondary bedrooms have custom color. Laminate wood floors in common areas and bedrooms. Laundry in house. Flex space in enclosed patio with A/C. Good sized backyard.
-
2017-07-21$135,000 Active 374-char remark
Show marketing remark (374 chars)
Cute as a button 3-bedroom, 2-bath home in Blue Creek! Great open floor plan. Lovely neutral color in living with half wall open to spacious kitchen. Breakfast/kitchen combo. Master is quiet at rear of home. Secondary bedrooms have custom color. Laminate wood floors in common areas and bedrooms. Laundry in house. Flex space in enclosed patio with A/C. Good sized backyard.
ⓘ Source: listings_history table (triggers on properties + properties_extension) + one-shot
backfill from property_details.listing_events for pre-trigger history.
Tax reassessment forecast TX · Resets to sale price
- Current annual tax
- $4,858 · $405/mo
- Projected year-2 tax
- $4,858 · $405/mo
- Expected delta
- $0/yr ($0/mo · 0.0%)
ⓘ Screening estimate from a state-policy table — verify with the county assessor before closing.
Climate risk First Street
- Flood 6/10 Major FEMA zone X (unshaded) · 71% chance over 30 yrs
- Wildfire 1/10 Low
- Heat 9/10 Extreme 7 d/yr ≥110°F today · 23 d/yr by 30 yrs out
- Wind 8/10 Severe 99% chance of damaging wind over 30 yrs
- Air quality 3/10 Moderate 3 unhealthy d/yr today · 4 by 30 yrs out
Nearby sold comps map
Loading sold comps map…
Walkable amenities ~0.75 mi
Loading nearby amenities…
Taxation est. · year 1
- Rental income
- $20,530
- − Mortgage interest
- −$11,147
- − Property taxes
- −$4,858
- − Insurance
- −$995
- − Repairs & maintenance
- −$1,642
- − Management
- −$1,642
- − HOA
- −$396
- − Depreciation
- −$5,789
- Taxable loss
- −$5,939
- Est. tax savings @ 24.0%
- +$1,425
- After-tax cash flow
- $-1,127/yr
For passive investors: Depreciation is non-cash, so a rental often shows a tax loss while cash-flowing — sheltering income. Rental losses are passive: they offset passive income freely, and up to $25,000/yr can offset ordinary (W-2) income if you actively participate and your MAGI is under $100k (phasing out to $0 by $150k); unused losses carry forward. On sale, claimed depreciation is recaptured at up to 25%, and gains may owe capital-gains tax (a 1031 exchange can defer both). Figures are a year-1 estimate at your 24.0% rate — not tax advice; consult a CPA.
Schools (NCES district)
- District
- Klein ISD
- NCES district ID
- 4825740
- Math proficiency
- 41% ▼ -12.00%
- Reading proficiency
- 48% ▼ -3.00%
- Median HH income
- $78,288
- Composite
- 40.91/100
- National rank
- #3615
- State rank
- #213 of 826 in TX
Livability — Houston
- Score
- 74/100
- State rank
- #184
- US rank
- #4771
Category grades
Schools grade is shown separately in the Schools card above.
Census & demographics
- County
- Harris County · 4,702,590 people
- City population
- 3,226,434
- Metro
- Houston-The Woodlands-Sugar Land, TX
- Population (ZIP)
- 28,653
- Household income
- $58,200
- Rent vs Own
- Severe rent burden
- 1323.0
Population outlook (Harris County) Hauer SSP2
- Today (2025)
- 5,571,493 people
- By 2030
- 6,089,821 · +9.3%
- By 2040
- 7,142,806 · +28.2%
- By 2050
- 8,185,864 · +46.9%
- By 2075
- 10,574,329 · +89.8%
- By 2100
- 12,109,958 · +117.4%
Race, ethnicity, and origin ACS 2023
- Neighborhood character
- Diverse neighborhood (Simpson 0.55)
- Race & ethnicity
- Hispanic / Latino 63% Two or more races 26% Black 19% Asian 9% White 7%
- Hispanic origin (detail)
- Mexican 47%
- Common ancestry
- Slovak 1%
- Foreign-born
- 34% · Canada, Vietnam
- Languages at home
- 38% English-only · Spanish 54% Vietnamese 6% Other Asian/Pacific 1%
Political lean MEDSL · Harris
- 2024 margin
- Lean D (+5.5) · D 52.0% · R 46.4% · Other 1.6%
- 2008→2024 swing
- +3.9pp toward D · 2008: 1.6pp · 2024: 5.5pp
- All cycles
- 2024: D+5.5 2020: D+13.3 2016: D+12.4 2012: D+0.1 2008: D+1.6
Not yet ingested
- Civics
- —
Market trends
- HPI YoY
- ▲ 1.60%
- Current HPI
- 281.0065
- Rent YoY
- ▼ -1.19%
- Metro
- Houston-The Woodlands-Sugar Land, TX
- State GDP YoY
- ▲ 3.95%
- F500 in state
- 110
Industry mix (Fortune 500 HQ in TX)
| Industry | F500 HQs | Revenue |
|---|---|---|
| Energy | 16 | $1,198B |
|
||
| Technology | 5 | $198B |
|
||
| Engineering / Construction | 4 | $72B |
|
||
| Energy Services | 3 | $60B |
|
||
| Utilities | 3 | $41B |
|
||
| Healthcare | 2 | $330B |
|
||
Price history
+54.8% since first listed10 events — show timeline
- 2026-05-28 Listed $209,000 HARMLS
- 2024-02-01 Rental Removed $1,750 HARMLS
- 2023-11-14 Listed for Rent $1,750 HARMLS
- 2017-08-31 Sold (Public Records) — Public Records
- 2017-08-26 Sold (MLS) — HARMLS
- 2017-08-15 Pending — HARMLS
- 2017-08-14 Pending — HARMLS
- 2017-08-05 Pending — HARMLS
- 2017-07-24 Pending — HARMLS
- 2017-07-21 Listed $135,000 HARMLS
Property tax history
+8.7%/yrLatest (2025): $4,858 · -0.3% YoY. Source: county tax records.
Cash-flow waterfall
monthlySold comps — $/sqft
last 12 mo · ≤1 miLoading sold comps…