2512 E 04th St · Chattanooga, TN
Flood risk 1/10 · Minimal
- FEMA flood zone
- X (unshaded)
- Chance of flooding over 30 yrs
- 0.0%
- Est. flood insurance / yr
- $507 – $1,088
Fire risk 1/10 · Minimal
- Est. fire insurance / yr
- $949 – $1,763
Heat risk 6/10 · Moderate
- Hot days now (above 105°F)
- 7 days/yr
- Hot days in 30 yrs
- 19 days/yr
Wind risk 4/10 · Minor
- Chance of severe wind over 30 yrs
- 10.0%
Air-quality risk 3/10 · Minor
- Unhealthy air days now
- 2 days/yr
- Unhealthy air days in 30 yrs
- 2 days/yr
Risk factors via First Street. Map © Google.
Why this score? — see what drove the C- grade
The composite is a weighted blend of 9 inputs, each scored 0–100. Each bar is that input's sub-score; the figure is the points it added to the 100-point composite (weight × sub-score).
- Cash flow +17.0/30.0
- ARV discount +15.0/15.0
- DSCR +5.3/10.0
- Livability +3.9/5.0
- 1% rule +3.3/10.0
- Schools +2.7/10.0
- Rent growth +2.5/5.0
- Condition / age +2.5/5.0
- Appreciation +0.0/10.0
$250,000
🖨 Deal sheet (PDF) 📄 Offer letter ✓ Due diligence
Listing remarks
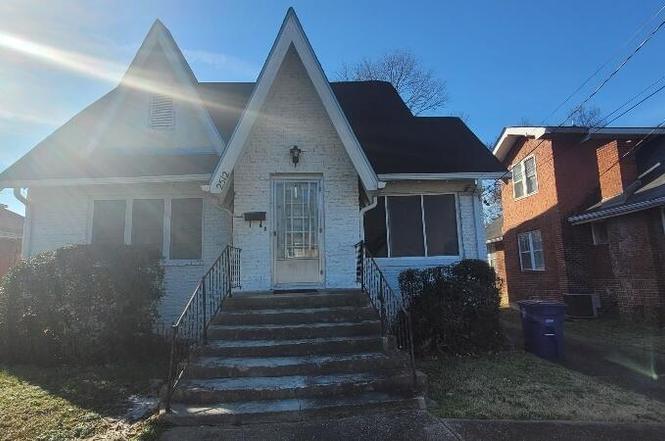
Release your imagination and restore this charming 1.5-story, approx. 1920 built home into the special jewel it was meant to be. Located in the heart of Glenwood, this 3-bedroom, 1.5-bath residence is filled with character and timeless details. Step into the open foyer and continue into a welcoming living room where a classic fireplace serves as the focal point. An arched doorway leads into the formal dining room, perfect for gatherings and entertaining. Just off the kitchen, you'll find the ever-so-charming breakfast nook—yes, it's still here—adding warmth and nostalgia to everyday meals. The kitchen offers abundant cabinetry and multiple cooktops, providing a solid foundation
Key facts
- Breakfast nook
- Multiple cooktops
- Formal dining room
Tags
Property features AI
Exterior
- Parking: 2-car garage; Driveway; Off-street parking
- Security: Smoke detectors
- Utilities: Public water; Public sewer; Electricity available; Cable available; Phone available; Water available; Sewer available
- Home design: Single family house; One and one half stories; Fixer condition
- Construction: Stone construction; Asphalt shingle roof; Permanent foundation; Built as a house (year built not provided)
- Exterior features: Private yard; Rain gutters; Deck; Porch; Side porch; Back yard; Level lot; Concrete road frontage on a city street; Publicly maintained road
Interior
- Kitchen: Free‑standing refrigerator; Free‑standing electric range; Cooktop
- Flooring: Hardwood floors
- Bathrooms: 1 full bathroom; 1 half bathroom
- Heating & cooling: Central heating (electric); Central air conditioning
- Interior features: Storage; Wood window frames; Living room fireplace
- Laundry & utility: Main-level laundry room with washer hookup; Electric water heater
Neighborhood map
What this means for you Summary
Snapshot
- This is a 3-bed/1.5-bath single-family listed at $250k.
Deal economics
- At list price, monthly cash flow is $167 ($2k/yr) — positive.
- The deal already cash-flows at list — no discount required.
- To meet the 1% rule (rent ≥ 1% of price), the offer needs to be $207k (17.3% below list).
- Recommended offer: $207k (17.3% below list) — sets the bar for 1% rule.
- Cap rate 7.1% vs local median 3.4% in Chattanooga — top-decile yield for the area; either an underpriced asset or a hidden risk that comps aren't pricing in. Stress-test before assuming the spread holds.
Location & tenants
- Location reads 78/100 on livability (#3 in TN, #2,582 nationally) — a middle-class / working-renter tenant base. Strengths: amenities A+, commute A+, cost of living A+; Watch: employment D+, crime F.
- Hamilton County (urban): math 31% / reading 31% proficiency, ranked #42 of 139 in TN (top 30%) — families likely to look elsewhere, expect single-tenant / working-renter base with shorter leases.
- Zoned schools: Orchard Knob Elementary (math 12% / reading 2%, grade F, #863 of 952 statewide, top 92%, 477 students, 0% FRL); Orchard Knob Middle (math 5% / reading 6%, grade F, #291 of 333 statewide, top 88%, 334 students, 0% FRL); Brainerd High School (math 2% / reading 12%, grade F, #294 of 332 statewide, top 91%, 635 students, 0% FRL) — zoned schools average 0% FRL vs 52% district-wide (52 pts lower); this property's tenant base skews higher-income than the district average.
- Zoned-school proficiency averages 7% at this address vs 31% district-wide (-24 pts) — the specific schools serving this property underperform the Hamilton County average; the district grade overstates school quality for this exact location.
- Market conditions: Rents flat; 172 active listings in the ZIP; 24 comparable units currently listed for rent nearby; rentals at typical pace (median 26d on market — plan ~3-4 weeks tenant-placement turnaround); 2,133 units permitted in Hamilton County in 2024 (405 in 5+ unit buildings).
- This rent runs 44% of the median local income ($57k/yr) — at the standard rent-burdened threshold; future hikes will face affordability resistance.
Forward outlook
- Local home prices are declining (-3.0%/yr); year-one equity from $2k of loan paydown is wiped out by about $8k of value loss. Plan a longer hold.
- Hamilton County population projected at +23% by 2050 — long-run rental-demand tailwind backs the buy-and-hold thesis.
Negotiation context
- It's been on market 171 days — a 12% lower offer ($220k) is reasonable based on typical stale-listing flexibility.
- Current owner paid $37k; list at $250k implies a 578% gain — meaningful room to come down on a strong offer.
Risks & watch-outs
- Watch-outs: built in 1920 — expect roof / HVAC / electrical / plumbing capex.
- Climate carrying-cost: extreme-heat days projected 7→19/yr by 2055 (HVAC capex compounding) — expect insurance premiums to compound above CPI over the hold.
Questions for the listing agent
- It's been on market 171 days. Have you received any prior offers? Is the seller open to a 17% concession, seller financing, or rate buy-down credit?
- Built in 1920 — when were the roof, HVAC, electrical panel, plumbing, and water heater last replaced?
- Why hasn't it sold? Are there any deal-killer items the seller is aware of (foundation, flood, title, zoning, code violations)?
- Is there a deadline driving the sale (1031 exchange, divorce, estate, relocation)? That informs how much negotiation room exists.
- Schools are F-rated, which usually means shorter tenancies and higher turnover. Who's the typical renter profile here, and what's been the actual vacancy rate?
- Crime grade is F in this area — have there been break-ins, vandalism, or insurance claims at this property in the last 3 years? What carrier currently insures it and at what premium?
- What's the average days-on-market for RENTAL listings here right now (not sales)? A rising rental-DOM trend means longer vacancies and softer asking-rent achievability than the comps imply.
- What's the recent tenant-quality profile in this submarket — average credit score on applications, eviction rate, late-payment / NSF rate, and stable-employment percentage? A property-management company in the area should have these aggregated.
- How much new for-sale + rental construction is in the pipeline within 1–3 miles? Heavy new supply typically softens prices + rents 12–24 months out; constrained supply supports both.
Investment metrics
- 1% rule
- 0.83% ✗
- Cap rate
- 7.10%
- Cash-on-cash
- 2.87%
- DSCR
- 1.13
- GRM
- 10.1
CMA / ARV
- ARV (on-the-fly)
- $430,360
- Comps found
- 7
Show comp detail 7 sales within ~0.75 mi
| Address | Dist | Beds/Ba | Sqft | Sold | Price | $/sf | Match |
|---|---|---|---|---|---|---|---|
| 2411 Shady Ln | 0.21mi | 3/2.5 | 2,000 (-6%) | 5mo | $379,900 | $190 | 72 |
| 2111 Kirby Ave | 0.72mi | 3/2.5 | 2,090 (-1%) | 1mo | $425,000 | $203 | 59 |
| 1804 Vine St | 0.72mi | 4/2.0 (+1) | 2,100 (-1%) | 7mo | $250,000 | $119 | 52 |
| 409 Derby St | 0.26mi | 3/2.0 | 1,852 (-13%) | 16mo | $215,000 | $116 | 51 |
| 3107 Colyar Dr | 0.44mi | 4/3.0 (+1) | 2,268 (+7%) | 7mo | $983,100 | $433 | 51 |
| 2506 Union Ave | 0.56mi | 3/2.5 | 1,875 (-12%) | 15mo | $450,000 | $240 | 38 |
| 3117 Colyar Dr | 0.47mi | 3/2.5 | 2,429 (+15%) | 23mo | $715,000 | $294 | 30 |
Match score weights: distance 35% · size 25% · config 20% · recency 20%. Top-matched comps best support the ARV.
Projected returns pro-forma
-3.0% appreciation · 0.03% rent growth · sell at horizon
- IRR
- -14.8%
- Equity multiple
- 0.49×
- Total profit
- $-35,996
- Equity at exit
- $37,276
- IRR
- -11.1%
- Equity multiple
- 0.41×
- Total profit
- $-41,369
- Equity at exit
- $21,615
Cash invested: $70,000 (down + closing). Projections, not guarantees.
Landlord ↔ Tenant lean methodology
- Overall (STATE)
- 87 Strongly Landlord-Friendly
- State Tennessee
- 87 Strongly Landlord-Friendly · R+13
- County
- — inherits STATE
- City
- — inherits STATE
ZIP-level market 37404
- Home prices YoY
- -30.6%
- Rents YoY
- 0.0%
- Active inventory
- 172
- Price-to-rent
- 10.1×
Monthly cashflow live
- Estimated rent
- $2,068 high interval (Pro) →
- Mortgage (P&I)
- −$1,311
- Tax from tax record
- −$51 /mo · $615/yr
- Insurance
- −$104
- HOA
- −$0
- Vacancy / Maint / Mgmt
- −$434
- Net cashflow
- $167
Break-even live
Sensitivity live
| Price | -10% $309 | -5% $238 | +0% $167 | +5% $96 | +10% $26 |
|---|---|---|---|---|---|
| Rent | -10% $4 | -5% $85 | +0% $167 | +5% $249 | +10% $330 |
| Rate | -1.0pp $293 | -0.5pp $231 | base $167 | +0.5pp $102 | +1.0pp $36 |
UW: 25.0% down · 7.5% · 30yr · 1.5% tax · 5.0% vac · 8.0% maint · 8.0% mgmt
Financing live
Cash to close
- Down payment
- $62,500
- Closing costs
- $7,500
- Reserves months
- —
- Total cash needed
- —
Loan-product check · same deal, 3 products live
Conventional
25% down · 7.5% · 30yr
- Down + closing
- —
- Monthly P&I
- —
- Monthly cashflow
- —
- DSCR
- —
- Eligible?
- —
Personal DTI + credit; lowest rate.
DSCR
20% down · 8.5% · 30yr
- Down + closing
- —
- Monthly P&I
- —
- Monthly cashflow
- —
- DSCR
- —
- Eligible?
- —
No personal income docs; deal must DSCR.
Hard money
10% down · 12.0% · 12mo
- Down + closing
- —
- Monthly P&I
- —
- Monthly cashflow
- —
- DSCR
- —
- Eligible?
- —
Short-term bridge; refi at stabilization.
Rent comps 24 comps
| Address | Beds | Baths | Sqft | Rent | $/sqft | DOM | Units | Dist |
|---|---|---|---|---|---|---|---|---|
| 2425 Chamberlain Ave Chattanooga, TN | 3.0 | 2.0 | 1422 | $1,795 | $1.26 | 25d | 1 | 0.44mi |
| 210 Buena Vista Dr Unit 4 Chattanooga, TN | 2.0 | 1.5 | 1500 | $1,495 | $1.00 | 25d | 1 | 0.55mi |
| 2106 Duncan Ave Unit 102 Chattanooga, TN | 3.0 | 2.5 | 1600 | $2,295 | $1.43 | 25d | 1 | 0.58mi |
| 2001 Garfield St Chattanooga, TN | 4.0 | 2.0 | 1413 | $1,700 | $1.20 | 25d | 1 | 0.58mi |
| 1905 Ivy St Chattanooga, TN | 4.0 | 3.0 | 1860 | $2,495 | $1.34 | 25d | 1 | 0.63mi |
| 111 N Seminole Dr Chattanooga, TN | 4.0 | 2.0 | 1500 | $2,200 | $1.47 | 25d | 1 | 0.63mi |
| 1906 Vine St Chattanooga, TN | 3.0 | 2.5 | 1881 | $2,200 | $1.17 | 25d | 1 | 0.64mi |
| 1814 Duncan Ave Chattanooga, TN | 3.0 | 2.0 | 2056 | $2,500 | $1.22 | 23d | 1 | 0.77mi |
| 1908 Robbins St Chattanooga, TN | 3.0 | 2.0 | 1783 | $1,750 | $0.98 | 15d | 1 | 0.80mi |
| 1705 Bailey Ave Chattanooga, TN | 3.0 | 2.0 | 1632 | $1,850 | $1.13 | 25d | 1 | 0.93mi |
| 409 Booth Rd Chattanooga, TN | 3.0 | 2.0 | 1530 | $1,695 | $1.11 | 25d | 1 | 1.04mi |
| 1516 Union Ave Chattanooga, TN | 4.0 | 3.0 | 2800 | $3,800 | $1.36 | 25d | 1 | 1.08mi |
| 3518 Ridgeside Rd Chattanooga, TN | 4.0 | 2.0 | 1409 | $1,375 | $0.98 | 25d | 1 | 1.12mi |
| 1809 Cotton Way Chattanooga, TN | 2.0 | 2.5 | 1412 | $2,295 | $1.63 | 25d | 1 | 1.19mi |
| 1601 Arlington Ave Chattanooga, TN | 3.0 | 1.0 | 1416 | $1,650 | $1.17 | 15d | 1 | 1.25mi |
| 2380 E 18th Street Pl Chattanooga, TN | 3.0 | 2.5 | 1950 | $1,895 | $0.97 | 23d | 1 | 1.30mi |
| 2360 E 18th St Chattanooga, TN | 3.0 | 2.5 | 1544 | $2,095 | $1.36 | 25d | 1 | 1.31mi |
| 2328 E 18th Street Pl Chattanooga, TN | 3.0 | 2.5 | 1950 | $1,995 | $1.02 | 23d | 1 | 1.32mi |
| 2328 E 18th St Chattanooga, TN | 3.0 | 2.5 | 1616 | $2,095 | $1.30 | 25d | 1 | 1.32mi |
| 3617 Monte Vista Dr Chattanooga, TN | 3.0 | 2.0 | 1628 | $1,823 | $1.12 | 15d | 1 | 1.37mi |
| 2335 E 19th St Chattanooga, TN | 3.0 | 2.5 | 1616 | $1,995 | $1.23 | 25d | 1 | 1.38mi |
| 2303 E 19th St Chattanooga, TN | 3.0 | 2.5 | 1544 | $1,995 | $1.29 | 23d | 1 | 1.38mi |
| 1652 Mari Cir Chattanooga, TN | 3.0 | 3.0 | 1700 | $2,500 | $1.47 | 25d | 1 | 1.46mi |
| 3229 Westonia Dr Chattanooga, TN | 4.0 | 2.0 | 2130 | $2,695 | $1.27 | 25d | 1 | 1.48mi |
Listing history 19 events
-
2026-06-22days on market $250,000 Active 171 DOM
-
2026-06-18days on market $250,000 Active 168 DOM
-
2026-06-17days on market $250,000 Active 167 DOM
-
2026-06-16days on market $250,000 Active 166 DOM
-
2026-06-15days on market $250,000 Active 165 DOM
-
2026-06-14days on market $250,000 Active 163 DOM
-
2026-06-10days on market $250,000 Active 160 DOM
-
2026-06-09days on market $250,000 Active 159 DOM
-
2026-06-08days on market $250,000 Active 158 DOM
-
2026-06-07days on market $250,000 Active 157 DOM
-
2026-06-05days on market $250,000 Active 154 DOM
-
2026-06-03days on market $250,000 Active 153 DOM
-
2026-06-02days on market $250,000 Active 152 DOM
-
2026-06-01days on market $250,000 Active 151 DOM
-
2026-05-31days on market $250,000 Active 150 DOM
-
2026-05-30days on market $250,000 Active 149 DOM
-
2026-04-02price $250,000
-
2026-01-01$325,000 Active
-
1986-02-12soldstatus $36,900
ⓘ Source: listings_history table (triggers on properties + properties_extension) + one-shot
backfill from property_details.listing_events for pre-trigger history.
Tax reassessment forecast TN · Resets to sale price
- Current annual tax
- $615 · $51/mo
- Projected year-2 tax
- $1,775 · $148/mo
- Expected delta
- +$1,160/yr (+$97/mo · 188.8%)
ⓘ Screening estimate from a state-policy table — verify with the county assessor before closing.
Climate risk First Street
- Flood 1/10 Low FEMA zone X (unshaded) · 0% chance over 30 yrs
- Wildfire 1/10 Low
- Heat 6/10 Major 7 d/yr ≥105°F today · 19 d/yr by 30 yrs out
- Wind 4/10 Moderate 10% chance of damaging wind over 30 yrs
- Air quality 3/10 Moderate 2 unhealthy d/yr today · 2 by 30 yrs out
Nearby sold comps map
Loading sold comps map…
Walkable amenities ~0.75 mi
Loading nearby amenities…
Taxation est. · year 1
- Rental income
- $24,813
- − Mortgage interest
- −$14,004
- − Property taxes
- −$615
- − Insurance
- −$1,250
- − Repairs & maintenance
- −$1,985
- − Management
- −$1,985
- − Depreciation
- −$7,273
- Taxable loss
- −$2,298
- Est. tax savings @ 24.0%
- +$552
- After-tax cash flow
- $2,557/yr
For passive investors: Depreciation is non-cash, so a rental often shows a tax loss while cash-flowing — sheltering income. Rental losses are passive: they offset passive income freely, and up to $25,000/yr can offset ordinary (W-2) income if you actively participate and your MAGI is under $100k (phasing out to $0 by $150k); unused losses carry forward. On sale, claimed depreciation is recaptured at up to 25%, and gains may owe capital-gains tax (a 1031 exchange can defer both). Figures are a year-1 estimate at your 24.0% rate — not tax advice; consult a CPA.
Schools (NCES district)
- District
- Hamilton County
- NCES district ID
- 4701590
- Math proficiency
- 31% ▼ -10.00%
- Reading proficiency
- 31% ▼ -3.00%
- Median HH income
- $47,456
- Composite
- 26.8/100
- National rank
- #7122
- State rank
- #42 of 139 in TN
Livability — Chattanooga
- Score
- 78/100
- State rank
- #3
- US rank
- #2582
Category grades
Schools grade is shown separately in the Schools card above.
Census & demographics
- Census place
- Chattanooga, TN
- County
- Hamilton County · 312,777 people
- City population
- 131,999
- Metro
- Chattanooga, TN-GA
- Population (ZIP)
- 14,737
- Household income
- $56,637
- Rent vs Own
- Severe rent burden
- 486.0
Population outlook (Hamilton County) Hauer SSP2
- Today (2025)
- 393,784 people
- By 2030
- 412,983 · +4.9%
- By 2040
- 449,502 · +14.1%
- By 2050
- 484,341 · +23.0%
- By 2075
- 565,746 · +43.7%
- By 2100
- 618,394 · +57.0%
Race, ethnicity, and origin ACS 2023
- Neighborhood character
- Diverse neighborhood (Simpson 0.67)
- Race & ethnicity
- Black 38% White 38% Hispanic / Latino 21% Two or more races 11%
- Hispanic origin (detail)
- Mexican 3%
- Common ancestry
- Slovak 3% Romanian 1% Lithuanian 1%
- Foreign-born
- 11% · Canada
- Languages at home
- 81% English-only · Spanish 18%
Political lean MEDSL · Hamilton
- 2024 margin
- R (+13.1) · D 42.7% · R 55.7% · Other 1.6%
- 2008→2024 swing
- -1.2pp toward R · 2008: -11.8pp · 2024: -13.1pp
- All cycles
- 2024: R+13.1 2020: R+9.7 2016: R+16.6 2012: R+14.8 2008: R+11.8
Not yet ingested
- Civics
- —
Market trends
- HPI YoY
- ▼ -139.43%
- Current HPI
- 315.8539
- Rent YoY
- ▬ 0.03%
- Metro
- Chattanooga, TN-GA
- State GDP YoY
- ▲ 2.78%
- F500 in state
- 22
Industry mix (Fortune 500 HQ in TN)
| Industry | F500 HQs | Revenue |
|---|---|---|
| Healthcare | 3 | $91B |
|
||
| Retail | 3 | $72B |
|
||
| Transportation / Logistics | 1 | $88B |
|
||
| Paper / Packaging | 1 | $19B |
|
||
| Insurance | 1 | $13B |
|
||
| Energy | 1 | $12B |
|
||
Price history
+577.5% since first listed3 events — show timeline
- 2026-04-02 Price Changed $250,000 GCAR
- 2026-01-01 Listed $325,000 GCAR
- 1986-02-12 Sold (Public Records) $36,900 Public Records
Property tax history
+0.8%/yrLatest (2025): $615 · -31.6% YoY. Source: county tax records.
Cash-flow waterfall
monthlySold comps — $/sqft
last 12 mo · ≤1 miLoading sold comps…