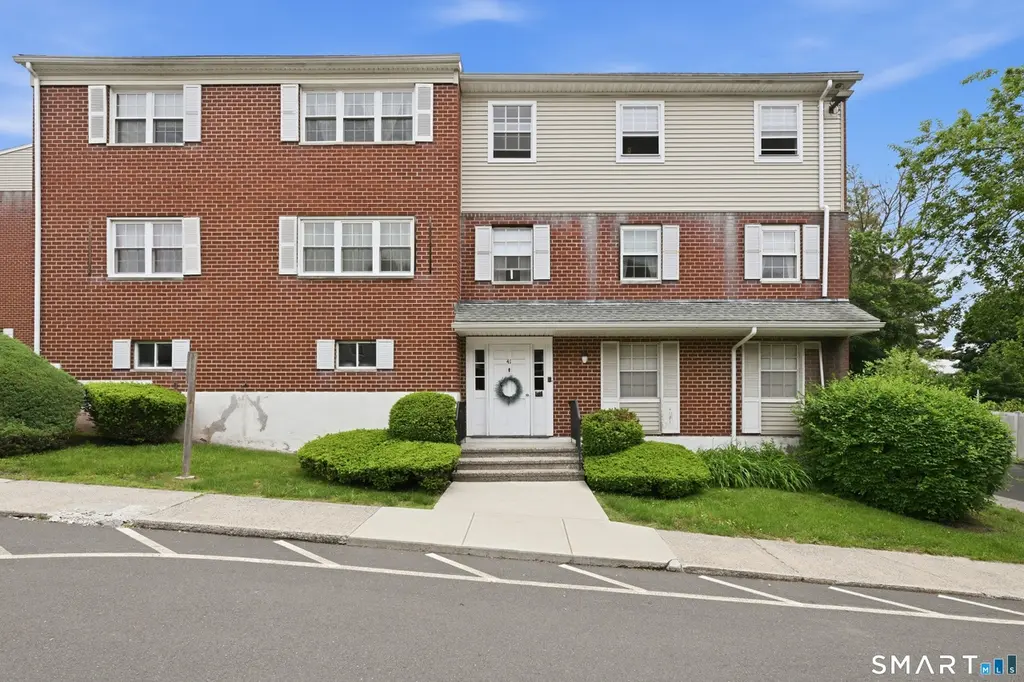
50 Greenhouse Rd Unit 41D · Bridgeport, CT
Flood risk 1/10 · Minimal
- FEMA flood zone
- X (unshaded)
- Chance of flooding over 30 yrs
- 0.0%
- Est. flood insurance / yr
- $507 – $1,088
Fire risk 1/10 · Minimal
- Est. fire insurance / yr
- $829 – $1,539
Heat risk 6/10 · Moderate
- Hot days now (above 97°F)
- 7 days/yr
- Hot days in 30 yrs
- 15 days/yr
Wind risk 6/10 · Moderate
- Chance of severe wind over 30 yrs
- 41.0%
Air-quality risk 4/10 · Minor
- Unhealthy air days now
- 5 days/yr
- Unhealthy air days in 30 yrs
- 7 days/yr
Risk factors via First Street. Map © Google.
Why this score? — see what drove the C grade
The composite is a weighted blend of 9 inputs, each scored 0–100. Each bar is that input's sub-score; the figure is the points it added to the 100-point composite (weight × sub-score).
- Cash flow +22.0/30.0
- 1% rule +9.0/10.0
- ARV discount +7.5/15.0
- DSCR +7.0/10.0
- Livability +4.0/5.0
- Rent growth +3.3/5.0
- Condition / age +2.5/5.0
- Schools +1.2/10.0
- Appreciation +0.0/10.0
$149,900
🖨 Deal sheet 📄 Offer letter ✓ Due diligence
Listing remarks MLS
This is a hud property all offers must be submitted through hud
Key facts
- Easy commuting
- In unit laundry
- In ground pool
Tags
Property features AI
Finance
- Other: Total of 76 units in the complex; Nearby amenities include basketball court, commuter bus, lake, medical facilities, park, shopping/mall, and walkable bus lines
- HOA & community: Homeowners association with monthly fee; HOA fee covers grounds maintenance, trash pickup, hot water, water, property management, and pool service; Association-managed professionally off-site; Pets allowed with restrictions per bylaws
Exterior
- Parking: Off-street parking; Parking lot; 1 parking space
- Utilities: Public water connected; Public sewer (in street); Gas available in street
- Home design: Condominium (Condo/Co-Op For Sale); Part of Dellwood Gardens complex
- Construction: Brick construction
- Exterior features: Vinyl siding and brick exterior; Level lot; Beach rights; In-ground swimming pool; Community pool
Interior
- Kitchen: Gas cooktop; Refrigerator
- Bedrooms: 1 bedroom
- Bathrooms: 1 full bathroom
- Heating & cooling: Hot air heat; Central air conditioning
- Interior features: 1-level unit; Shared full basement with storage; Central air
- Laundry & utility: Laundry on main level
Neighborhood map
What this means for you Summary
Snapshot
- This is a 1-bed/1.0-bath condo listed at $150k.
Deal economics
- At list price, monthly cash flow is $240 ($3k/yr) — positive.
- The deal already cash-flows at list — no discount required.
- Meets the 1% rule at list price ($2k rent vs $150k).
- Recommended offer: $148k (1.5% below list) — sets the bar for market timing.
- Cap rate 8.2% vs local median 5.0% in Bridgeport — top-decile yield for the area; either an underpriced asset or a hidden risk that comps aren't pricing in. Stress-test before assuming the spread holds.
Location & tenants
- Location reads 81/100 on livability (#15 in CT, #1,374 nationally) — a professional / high-income tenant draw. Strengths: amenities A+, commute A+, health & safety A+; Watch: crime C-, employment D+, schools D-.
- Bridgeport School District (urban): math 9% / reading 19% proficiency, ranked #151 of 153 in CT (top 99%) — low school quality limits family demand, transient renter base, plan for 1-2y turnover; 97% free/reduced lunch — lower-income household profile, screen leases tightly.
- Market conditions: Rents rising (+3.1%/yr); 152 active listings in the ZIP; 25 comparable units currently listed for rent nearby; rentals at typical pace (median 24d on market — plan ~3-4 weeks tenant-placement turnaround); 48% of comp listings sitting > 30 days — soft ceiling on asking rent; 852 units permitted in Greater Bridgeport Planning Region in 2024 (698 in 5+ unit buildings).
- This rent runs 34% of the median local income ($73k/yr) — at the standard rent-burdened threshold; future hikes will face affordability resistance.
Forward outlook
- Local home prices are declining (-3.0%/yr); year-one equity from $1k of loan paydown is wiped out by about $4k of value loss. Plan a longer hold.
Negotiation context
- It's been on market 21 days — a 2% lower offer ($148k) is reasonable based on typical stale-listing flexibility.
- 2 sale attempts since 14y ago with the ask held roughly flat each time — persistent listings suggest the price (not the market) is what's stuck; bring a comps-based counter.
- Current owner paid $58k; list at $150k implies a 158% gain — meaningful room to come down on a strong offer.
Risks & watch-outs
- Climate carrying-cost: major wind risk, 41% chance of damaging wind over 30y; extreme-heat days projected 7→15/yr by 2055 (HVAC capex compounding) — expect insurance premiums to compound above CPI over the hold.
Questions for the listing agent
- Built in 1972 — when were the roof, HVAC, electrical panel, plumbing, and water heater last replaced?
- What does the HOA fee cover, when was the last increase, and are there any pending special assessments or reserve-fund shortfalls?
- Any open or pending special assessments — roof, HVAC, plumbing, elevator, façade? What's the per-unit balance and payoff schedule, and is the seller paying it off at close or rolling it to the buyer?
- Is there a deadline driving the sale (1031 exchange, divorce, estate, relocation)? That informs how much negotiation room exists.
- Schools are D-rated, which usually means shorter tenancies and higher turnover. Who's the typical renter profile here, and what's been the actual vacancy rate?
- What's the average days-on-market for RENTAL listings here right now (not sales)? A rising rental-DOM trend means longer vacancies and softer asking-rent achievability than the comps imply.
- What's the recent tenant-quality profile in this submarket — average credit score on applications, eviction rate, late-payment / NSF rate, and stable-employment percentage? A property-management company in the area should have these aggregated.
- How much new apartment / multifamily construction is in the pipeline within 1–3 miles? Heavy new supply (>2% of stock underway) typically softens rents 12–24 months out; light construction supports rent growth.
Investment metrics
- 1% rule
- 1.40% ✓
- Cap rate
- 8.21%
- Cash-on-cash
- 6.85%
- DSCR
- 1.30
- GRM
- 6.0
CMA / ARV
No comps found within radius.
Projected returns pro-forma
-3.0% appreciation · 3.12% rent growth · sell at horizon
- IRR
- -5.4%
- Equity multiple
- 0.80×
- Total profit
- $-8,508
- Equity at exit
- $22,351
- IRR
- 4.6%
- Equity multiple
- 1.34×
- Total profit
- $14,362
- Equity at exit
- $12,961
Cash invested: $41,972 (down + closing). Projections, not guarantees.
Landlord ↔ Tenant lean methodology
- Overall (STATE)
- 27 Tenant-Leaning
- State Connecticut
- 27 Tenant-Leaning · D+7
- County
- — inherits STATE
- City
- — inherits STATE
ZIP-level market 06606
- Rents YoY
- 3.1%
- Active inventory
- 152
- Price-to-rent
- 6.0×
Monthly cashflow live
- Estimated rent
- $2,094 high interval (Pro) →
- Mortgage (P&I)
- −$786
- Tax from tax record
- −$227 /mo · $2,724/yr
- Insurance
- −$62
- HOA
- −$339
- Vacancy / Maint / Mgmt
- −$440
- Net cashflow
- $240
Break-even live
UW: 25.0% down · 7.5% · 30yr · 1.5% tax · 5.0% vac · 8.0% maint · 8.0% mgmt
Financing live
Cash to close
- Down payment
- $37,475
- Closing costs
- $4,497
- Reserves months
- —
- Total cash needed
- —
Loan-product check · same deal, 3 products live
Conventional
25% down · 7.5% · 30yr
- Down + closing
- —
- Monthly P&I
- —
- Monthly cashflow
- —
- DSCR
- —
- Eligible?
- —
Personal DTI + credit; lowest rate.
DSCR
20% down · 8.5% · 30yr
- Down + closing
- —
- Monthly P&I
- —
- Monthly cashflow
- —
- DSCR
- —
- Eligible?
- —
No personal income docs; deal must DSCR.
Hard money
10% down · 12.0% · 12mo
- Down + closing
- —
- Monthly P&I
- —
- Monthly cashflow
- —
- DSCR
- —
- Eligible?
- —
Short-term bridge; refi at stabilization.
Rent comps 25 comps
| Address | Beds | Baths | Sqft | Rent | $/sqft | DOM | Units | Dist |
|---|---|---|---|---|---|---|---|---|
| 150 Anton St Bridgeport, CT | 1.0 | 1.0–1.5 | 532 | $2,090 | $3.92 | 3d | 4 | 0.17mi |
| 127 Kennedy Dr #127 Bridgeport, CT | 2.0 | 1.0 | 1023 | $2,250 | $2.20 | 11d | 1 | 0.27mi |
| 104 Kennedy Dr Bridgeport, CT | 2.0 | 1.0 | 1023 | $2,600 | $2.54 | 43d | 1 | 0.32mi |
| 3004 Madison Ave Unit A Bridgeport, CT | 1.0 | 1.0 | 755 | $2,000 | $2.65 | 21d | 1 | 0.34mi |
| 333 Vincellette St #59 Bridgeport, CT | 1.0 | 1.0 | 975 | $2,000 | $2.05 | 11d | 1 | 0.35mi |
| 239 Cherry Hill Dr Unit 2A Bridgeport, CT | 2.0 | 1.0 | 850 | $2,100 | $2.47 | 43d | 1 | 0.40mi |
| 365 Glendale Ave Unit B2 Bridgeport, CT | 1.0 | 1.0 | 661 | $1,600 | $2.42 | 43d | 1 | 0.51mi |
| 170 Sequoia Rd Bridgeport, CT | 1.0 | 1.0 | 850 | $1,850 | $2.18 | 23d | 1 | 0.61mi |
| 39 Lance Cir #39 Bridgeport, CT | 2.0 | 1.0 | 915 | $2,500 | $2.73 | 43d | 1 | 0.76mi |
| 3900 Park Ave Unit 7K Bridgeport, CT | 1.0 | 1.0 | 850 | $1,895 | $2.23 | 23d | 1 | 0.78mi |
| 3900 Park Ave Unit 4L Bridgeport, CT | 1.0 | 1.0 | 870 | $1,895 | $2.18 | 43d | 1 | 0.78mi |
| 5085 Main St Trumbull, CT | 1.0–2.0 | 1.0–2.0 | 985 | $2,550 | $2.59 | 2d | 9 | 0.80mi |
| 30 Quarry St Bridgeport, CT | 1.0–2.0 | 1.0 | 805 | $1,720 | $2.14 | 23d | 3 | 1.11mi |
| 25 Rena Pl Fairfield, CT | 2.0 | 1.0 | 930 | $3,200 | $3.44 | 43d | 1 | 1.13mi |
| 97 Wentworth St Unit 3 Bridgeport, CT | 2.0 | 1.0 | 950 | $2,000 | $2.11 | 2d | 1 | 1.17mi |
| 3250 Main St Unit B209 Bridgeport, CT | 2.0 | 2.0 | 813 | $2,000 | $2.46 | 43d | 1 | 1.20mi |
| 68-70 Westfield Ave Bridgeport, CT | 2.0 | 1.0 | 888 | $2,200 | $2.48 | 3d | 1 | 1.32mi |
| 343 Wayne St Unit 1st Bridgeport, CT | 1.0 | 1.0 | 650 | $1,300 | $2.00 | 3d | 1 | 1.34mi |
| 343 Wayne St Unit 1st Bridgeport, CT | 1.0 | 1.0 | 650 | $1,300 | $2.00 | 43d | 1 | 1.34mi |
| 454 Summit St Bridgeport, CT | 2.0 | 1.0 | 1010 | $2,000 | $1.98 | 43d | 1 | 1.36mi |
| 2496 Easton Tpke Unit B Fairfield, CT | 2.0 | 1.0 | 900 | $2,395 | $2.66 | 43d | 1 | 1.36mi |
| 5545 Park Ave Fairfield, CT | 1.0–2.0 | 1.0–2.0 | 1040 | $2,650 | $2.55 | 2d | 1 | 1.37mi |
| 100 Oakview Dr Trumbull, CT | 1.0–2.0 | 1.0–2.0 | 1028 | $2,469 | $2.40 | 2d | 1 | 1.39mi |
| 614 Earl Ave Bridgeport, CT | 2.0 | 1.0 | 748 | $2,300 | $3.07 | 43d | 1 | 1.40mi |
| 1455 Madison Ave Unit A6 Bridgeport, CT | 1.0 | 1.0 | 776 | $1,700 | $2.19 | 43d | 1 | 1.47mi |
HOA detail condo
- Monthly dues
- $339 · $4,068/yr
- Assessments
- None detected in remarks — confirm with the listing agent.
Listing history 19 events
-
2026-06-18days on market $149,900 Active 21 DOM
-
2026-06-17days on market $149,900 Active 20 DOM
-
2026-06-16days on market $149,900 Active 19 DOM
-
2026-06-15days on market $149,900 Active 18 DOM
-
2026-06-13days on market $149,900 Active 16 DOM
-
2026-06-13days on market $149,900 Active 15 DOM
-
2026-06-10days on market $149,900 Active 13 DOM
-
2026-06-09days on market $149,900 Active 12 DOM
-
2026-06-08days on market $149,900 Active 11 DOM
-
2026-06-07days on market $149,900 Active 10 DOM
-
2026-06-05days on market $149,900 Active 7 DOM
-
2026-06-03days on market $149,900 Active 6 DOM
-
2026-06-03days on market $149,900 Active 5 DOM
-
2026-06-01days on market $149,900 Active 4 DOM
-
2026-05-31days on market $149,900 Active 3 DOM
-
2026-05-28$149,900 Active
-
2012-09-20soldstatus $58,000 63-char remark
Show marketing remark (63 chars)
This is a hud property all offers must be submitted through hud
-
2012-08-06$57,000 63-char remark
Show marketing remark (63 chars)
This is a hud property all offers must be submitted through hud
-
2002-12-19soldstatus $89,900
ⓘ Source: listings_history table (triggers on properties + properties_extension) + one-shot
backfill from property_details.listing_events for pre-trigger history.
Tax reassessment forecast CT · Partial reset (capped growth)
- Current annual tax
- $2,724 · $227/mo
- Projected year-2 tax
- $2,966 · $247/mo
- Expected delta
- +$242/yr (+$20/mo · 8.9%)
ⓘ Screening estimate from a state-policy table — verify with the county assessor before closing.
Climate risk First Street
- Flood 1/10 Low FEMA zone X (unshaded) · 0% chance over 30 yrs
- Wildfire 1/10 Low
- Heat 6/10 Major 7 d/yr ≥97°F today · 15 d/yr by 30 yrs out
- Wind 6/10 Major 41% chance of damaging wind over 30 yrs
- Air quality 4/10 Moderate 5 unhealthy d/yr today · 7 by 30 yrs out
Nearby sold comps map
Loading sold comps map…
Walkable amenities ~0.75 mi
Loading nearby amenities…
Taxation est. · year 1
- Rental income
- $25,127
- − Mortgage interest
- −$8,397
- − Property taxes
- −$2,724
- − Insurance
- −$750
- − Repairs & maintenance
- −$2,010
- − Management
- −$2,010
- − HOA
- −$4,068
- − Depreciation
- −$4,361
- Taxable income
- $808
- Est. tax owed @ 24.0%
- −$194
- After-tax cash flow
- $2,682/yr
For passive investors: Depreciation is non-cash, so a rental often shows a tax loss while cash-flowing — sheltering income. Rental losses are passive: they offset passive income freely, and up to $25,000/yr can offset ordinary (W-2) income if you actively participate and your MAGI is under $100k (phasing out to $0 by $150k); unused losses carry forward. On sale, claimed depreciation is recaptured at up to 25%, and gains may owe capital-gains tax (a 1031 exchange can defer both). Figures are a year-1 estimate at your 24.0% rate — not tax advice; consult a CPA.
Schools (NCES district)
- District
- Bridgeport School District
- NCES district ID
- 0900450
- Math proficiency
- 9% ▼ -7.00%
- Reading proficiency
- 19% ▼ -10.00%
- Median HH income
- $41,507
- Composite
- 12.09/100
- National rank
- #9656
- State rank
- #151 of 153 in CT
Livability — Bridgeport
- Score
- 81/100
- State rank
- #15
- US rank
- #1374
Category grades
Schools grade is shown separately in the Schools card above.
Census & demographics
- Census place
- Bridgeport, CT
- County
- Fairfield County · 765,532 people
- City population
- 149,153
- Metro
- Bridgeport-Stamford-Norwalk, CT
- Population (ZIP)
- 49,308
- Household income
- $73,372
- Rent vs Own
- Severe rent burden
- 2163.0
Population outlook (Greater Bridgeport County) Hauer SSP2
- By 2040
- 365,581
Race, ethnicity, and origin ACS 2023
- Neighborhood character
- Highly diverse neighborhood (Simpson 0.73)
- Race & ethnicity
- Hispanic / Latino 37% White 31% Black 19% Two or more races 11% Asian 7%
- Hispanic origin (detail)
- Mexican 5% Puerto Rican 12% Dominican 4%
- Common ancestry
- Estonian 5% Russian 4% Romanian 3%
- Foreign-born
- 37% · Canada, Jamaica, Vietnam
- Languages at home
- 50% English-only · Spanish 27% Other Indo-European 15% French/Haitian/Cajun 2%
Political lean MEDSL · Greater Bridgeport
- 2024 margin
- Strong D (+23.3) · D 60.9% · R 37.6% · Other 1.5%
- All cycles
- 2024: D+23.3
Not yet ingested
- Civics
- —
Market trends
- HPI YoY
- ▼ -270.11%
- Current HPI
- 345.647
- Rent YoY
- ▲ 3.12%
- Metro
- Bridgeport-Stamford-Norwalk, CT
- State GDP YoY
- ▲ 1.06%
- F500 in state
- 38
Industry mix (Fortune 500 HQ in CT)
| Industry | F500 HQs | Revenue |
|---|---|---|
| Industrial Machinery | 4 | $38B |
|
||
| Insurance | 3 | $71B |
|
||
| Financial Services | 2 | $25B |
|
||
| Transportation / Logistics | 2 | $18B |
|
||
| Healthcare | 1 | $247B |
|
||
| Telecommunications | 1 | $55B |
|
||
Price history
+66.7% since first listed4 events — show timeline
- 2026-05-28 Listed $149,900 Smart MLS
- 2012-09-20 Sold (MLS) $58,000 Smart MLS
- 2012-08-06 Listed $57,000 Smart MLS
- 2002-12-19 Sold (Public Records) $89,900 Public Records
Property tax history
-1.8%/yrLatest (2023): $2,724 · +0.0% YoY. Source: county tax records.
Cash-flow waterfall
monthlySold comps — $/sqft
last 12 mo · ≤1 miLoading sold comps…