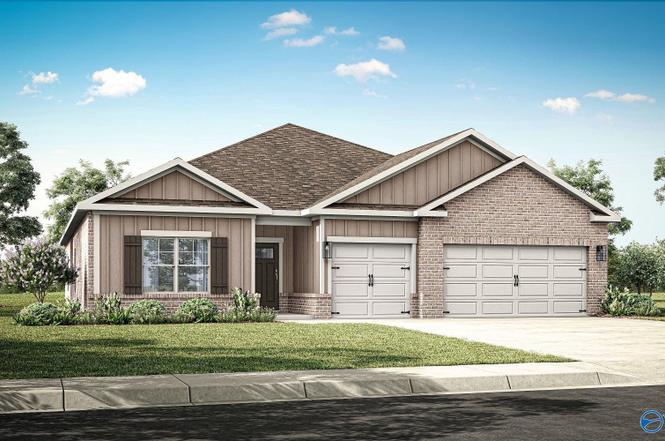
7107 Raquel Cir SE · Huntsville, AL
Flood risk 1/10 · Minimal
- FEMA flood zone
- X (unshaded)
- Chance of flooding over 30 yrs
- 0.0%
- Est. flood insurance / yr
- $507 – $1,088
Fire risk 2/10 · Minimal
- Est. fire insurance / yr
- $916 – $1,700
Heat risk 5/10 · Moderate
- Hot days now (above 105°F)
- 8 days/yr
- Hot days in 30 yrs
- 24 days/yr
Wind risk 4/10 · Minor
- Chance of severe wind over 30 yrs
- 22.0%
Air-quality risk 1/10 · Minimal
- Unhealthy air days now
- 0 days/yr
- Unhealthy air days in 30 yrs
- 0 days/yr
Risk factors via First Street. Map © Google.
Why this score? — see what drove the D grade
The composite is a weighted blend of 9 inputs, each scored 0–100. Each bar is that input's sub-score; the figure is the points it added to the 100-point composite (weight × sub-score).
- Appreciation +10.0/10.0
- ARV discount +8.8/15.0
- Cash flow +7.8/30.0
- Livability +4.1/5.0
- Schools +2.9/10.0
- Rent growth +2.5/5.0
- Condition / age +2.5/5.0
- 1% rule +2.4/10.0
- DSCR +1.9/10.0
$425,900
🖨 Deal sheet 📄 Offer letter ✓ Due diligence
Listing remarks
Under Construction-Meet the Fraser, a spacious 4-bedroom 3-bathroom new construction home. This home offers an abundance of features including elevated 9' ceilings, luxury vinyl plan flooring, 36" shaker style cabinetry, stainless steel appliances, granite or quartz kitchen and bath countertops, walk-in tiled master shower, and stunning LED Lighting.
Key facts
- 0.25 acre lot
- 3 garage spots
- Listed 78 days
Neighborhood map
What this means for you Summary
Snapshot
- This is a 4-bed/3.0-bath single-family listed at $426k.
Deal economics
- At list price, monthly cash flow is $-477 ($-6k/yr) — negative.
- To cash-flow at today's rent, offer at most $357k (16.2% below list).
- To meet the 1% rule (rent ≥ 1% of price), the offer needs to be $317k (25.5% below list).
- Recommended offer: $317k (25.5% below list) — sets the bar for 1% rule.
- Cap rate 4.9% vs local median 3.8% in Huntsville — top-decile yield for the area; either an underpriced asset or a hidden risk that comps aren't pricing in. Stress-test before assuming the spread holds.
Location & tenants
- Location reads 82/100 on livability (#3 in AL, #1,082 nationally) — a professional / high-income tenant draw. Strengths: commute A+, cost of living A+, housing A+; Watch: crime F.
- Huntsville City (urban): math 21% / reading 46% proficiency, ranked #48 of 129 in AL (top 37%) — families likely to look elsewhere, expect single-tenant / working-renter base with shorter leases.
- Zoned schools: Hampton Cove Elementary (math 60% / reading 77%, grade B+, #32 of 627 statewide, top 5%, 684 students, 9% FRL); Hampton Cove Middle School (math 45% / reading 72%, grade B, #12 of 257 statewide, top 4%, 735 students, 11% FRL); Huntsville High School (math 41% / reading 51%, grade D-, #18 of 305 statewide, top 6%, 1,826 students, 28% FRL) — zoned schools average 16% FRL vs 46% district-wide (31 pts lower); this property's tenant base skews higher-income than the district average.
- Zoned-school proficiency averages 58% at this address vs 34% district-wide (+24 pts) — the actual schools serving this property are materially stronger than the Huntsville City average implies; a family-tenant draw the district grade alone would hide.
- Market conditions: 184 active listings in the ZIP; 2 comparable units currently listed for rent nearby; 4,709 units permitted in Madison County in 2024 (1,186 in 5+ unit buildings).
Forward outlook
- In year one you build about $46k of equity ($3k loan paydown + $43k appreciation (10.0% local appreciation)).
- Madison County population projected at +18% by 2050 — long-run rental-demand tailwind backs the buy-and-hold thesis.
- By year 2, paydown + projected appreciation supports a ~$73k cash-out refi (75% LTV) — recoverable capital for the next deal without selling this one.
Negotiation context
- It's been on market 78 days — a 6% lower offer ($400k) is reasonable based on typical stale-listing flexibility.
Risks & watch-outs
- Climate carrying-cost: extreme-heat days projected 8→24/yr by 2055 (HVAC capex compounding) — expect insurance premiums to compound above CPI over the hold.
Questions for the listing agent
- What do current leases actually rent for vs. the listed asking? Can we see a recent rent roll and the last 12 months of T-12 income?
- It's been on market 78 days. Have you received any prior offers? Is the seller open to a 26% concession, seller financing, or rate buy-down credit?
- What does the HOA fee cover, when was the last increase, and are there any pending special assessments or reserve-fund shortfalls?
- Why hasn't it sold? Are there any deal-killer items the seller is aware of (foundation, flood, title, zoning, code violations)?
- Is there a deadline driving the sale (1031 exchange, divorce, estate, relocation)? That informs how much negotiation room exists.
- Crime grade is F in this area — have there been break-ins, vandalism, or insurance claims at this property in the last 3 years? What carrier currently insures it and at what premium?
- The area grade is low — what's the realistic commute time and amenity access for the typical tenant pool here? Any planned neighborhood developments (good or bad) we should know about?
- What's the average days-on-market for RENTAL listings here right now (not sales)? A rising rental-DOM trend means longer vacancies and softer asking-rent achievability than the comps imply.
- What's the recent tenant-quality profile in this submarket — average credit score on applications, eviction rate, late-payment / NSF rate, and stable-employment percentage? A property-management company in the area should have these aggregated.
- How much new for-sale + rental construction is in the pipeline within 1–3 miles? Heavy new supply typically softens prices + rents 12–24 months out; constrained supply supports both.
Investment metrics
- 1% rule
- 0.74% ✗
- Cap rate
- 4.95%
- Cash-on-cash
- -4.80%
- DSCR
- 0.79
- GRM
- 11.2
CMA / ARV
- ARV (on-the-fly)
- $438,555
- Comps found
- 12
Show comp detail 12 sales within ~0.75 mi
| Address | Dist | Beds/Ba | Sqft | Sold | Price | $/sf | Match |
|---|---|---|---|---|---|---|---|
| 8518 Sophia Nicolle Ct SE | 0.09mi | 4/3.0 | 2,595 (0%) | 1mo | $396,900 | $153 | 95 |
| 7100 Kalli Ilyssa Cir SE | 0.05mi | 4/3.0 | 2,647 (+2%) | 2mo | $519,900 | $196 | 93 |
| 8502 Sophia Nicolle Ct SE | 0.10mi | 4/3.0 | 2,595 (0%) | 6mo | $409,900 | $158 | 90 |
| 7070 Regency Ln SE | 0.14mi | 4/3.0 | 2,595 (0%) | 4mo | $409,900 | $158 | 90 |
| 7028 Regency Ln | 0.27mi | 4/3.0 | 2,589 (-0%) | 2mo | $474,900 | $183 | 86 |
| 7103 Raquel Cir | 0.05mi | 4/3.0 | 2,361 (-9%) | 2mo | $407,900 | $173 | 81 |
| 7108 Raquel Cir SE | 0.04mi | 4/3.0 | 2,361 (-9%) | 3mo | $434,580 | $184 | 81 |
| 8512 Sophia Nicolle Ct SE | 0.08mi | 4/3.0 | 2,377 (-8%) | 3mo | $380,000 | $160 | 80 |
| 8510 Sophia Nicolle Ct SE | 0.08mi | 4/3.0 | 2,377 (-8%) | 3mo | $408,900 | $172 | 80 |
| 8500 Sophia Nicolle Ct SE | 0.12mi | 4/3.0 | 2,361 (-9%) | 3mo | $389,900 | $165 | 77 |
| 7043 SE Regency Ln | 0.14mi | 4/2.5 | 2,359 (-9%) | 6mo | $367,000 | $156 | 72 |
| 9018 Mountain Preserve Blvd | 0.62mi | 4/2.0 | 2,314 (-11%) | 2mo | $390,000 | $169 | 47 |
Match score weights: distance 35% · size 25% · config 20% · recency 20%. Top-matched comps best support the ARV.
Projected returns pro-forma
10.0% appreciation · 3.0% rent growth · sell at horizon
- IRR
- 20.9%
- Equity multiple
- 2.69×
- Total profit
- $201,632
- Equity at exit
- $383,684
- IRR
- 18.9%
- Equity multiple
- 6.18×
- Total profit
- $617,821
- Equity at exit
- $827,430
Cash invested: $119,252 (down + closing). Projections, not guarantees.
Landlord ↔ Tenant lean methodology
- Overall (STATE)
- 90 Strongly Landlord-Friendly
- State Alabama
- 90 Strongly Landlord-Friendly · R+15
- County
- — inherits STATE
- City
- — inherits STATE
ZIP-level market 35748
- Home prices YoY
- 4.0%
- Active inventory
- 184
- Price-to-rent
- 11.2×
Monthly cashflow live
- Estimated rent
- $3,172 medium interval (Pro) →
- Mortgage (P&I)
- −$2,233
- Tax est. 1.5%
- −$532 /mo · $6,388/yr
- Insurance
- −$177
- HOA
- −$40
- Vacancy / Maint / Mgmt
- −$666
- Net cashflow
- $-477
Break-even live
UW: 25.0% down · 7.5% · 30yr · 1.5% tax · 5.0% vac · 8.0% maint · 8.0% mgmt
Financing live
Cash to close
- Down payment
- $106,475
- Closing costs
- $12,777
- Reserves months
- —
- Total cash needed
- —
Loan-product check · same deal, 3 products live
Conventional
25% down · 7.5% · 30yr
- Down + closing
- —
- Monthly P&I
- —
- Monthly cashflow
- —
- DSCR
- —
- Eligible?
- —
Personal DTI + credit; lowest rate.
DSCR
20% down · 8.5% · 30yr
- Down + closing
- —
- Monthly P&I
- —
- Monthly cashflow
- —
- DSCR
- —
- Eligible?
- —
No personal income docs; deal must DSCR.
Hard money
10% down · 12.0% · 12mo
- Down + closing
- —
- Monthly P&I
- —
- Monthly cashflow
- —
- DSCR
- —
- Eligible?
- —
Short-term bridge; refi at stabilization.
Rent comps 2 comps
| Address | Beds | Baths | Sqft | Rent | $/sqft | DOM | Units | Dist |
|---|---|---|---|---|---|---|---|---|
| 9041 Mountain Preserve Blvd SE Gurley, AL | 3.0 | 2.0 | 1833 | $2,700 | $1.47 | 14d | 1 | 0.50mi |
| 8889 Mountain Preserve Blvd SE Gurley, AL | 4.0 | 3.5 | 3350 | $4,000 | $1.19 | 43d | 1 | 0.96mi |
HOA detail
- Monthly dues
- $40 · $480/yr
Listing history 2 events
-
2026-04-24status Pending
-
2026-02-05$425,900 Active
ⓘ Source: listings_history table (triggers on properties + properties_extension) + one-shot
backfill from property_details.listing_events for pre-trigger history.
Climate risk First Street
- Flood 1/10 Low FEMA zone X (unshaded) · 0% chance over 30 yrs
- Wildfire 2/10 Low
- Heat 5/10 Major 8 d/yr ≥105°F today · 24 d/yr by 30 yrs out
- Wind 4/10 Moderate 22% chance of damaging wind over 30 yrs
- Air quality 1/10 Low 0 unhealthy d/yr today · 0 by 30 yrs out
Nearby sold comps map
Loading sold comps map…
Walkable amenities ~0.75 mi
Loading nearby amenities…
Taxation est. · year 1
- Rental income
- $38,066
- − Mortgage interest
- −$23,857
- − Property taxes
- −$6,388
- − Insurance
- −$2,130
- − Repairs & maintenance
- −$3,045
- − Management
- −$3,045
- − HOA
- −$480
- − Depreciation
- −$12,390
- Taxable loss
- −$13,269
- Est. tax savings @ 24.0%
- +$3,185
- After-tax cash flow
- $-2,543/yr
For passive investors: Depreciation is non-cash, so a rental often shows a tax loss while cash-flowing — sheltering income. Rental losses are passive: they offset passive income freely, and up to $25,000/yr can offset ordinary (W-2) income if you actively participate and your MAGI is under $100k (phasing out to $0 by $150k); unused losses carry forward. On sale, claimed depreciation is recaptured at up to 25%, and gains may owe capital-gains tax (a 1031 exchange can defer both). Figures are a year-1 estimate at your 24.0% rate — not tax advice; consult a CPA.
Schools (NCES district)
- District
- Huntsville City
- NCES district ID
- 0101800
- Math proficiency
- 21% ▼ -23.00%
- Reading proficiency
- 46% ▬ 0.00%
- Median HH income
- $48,264
- Composite
- 28.84/100
- National rank
- #6647
- State rank
- #48 of 129 in AL
Livability — Huntsville
- Score
- 82/100
- State rank
- #3
- US rank
- #1082
Category grades
Schools grade is shown separately in the Schools card above.
Census & demographics
- Census place
- Huntsville, AL
- City population
- 220,435
- Population (ZIP)
- 7,311
Population outlook (Madison County) Hauer SSP2
- Today (2025)
- 392,086 people
- By 2030
- 409,788 · +4.5%
- By 2040
- 440,557 · +12.4%
- By 2050
- 460,990 · +17.6%
- By 2075
- 502,872 · +28.3%
- By 2100
- 513,623 · +31.0%
Race, ethnicity, and origin ACS 2023
- Neighborhood character
- Predominantly White (92%)
- Race & ethnicity
- White 92% Two or more races 3% Black 3%
- Common ancestry
- Lithuanian 5% Slovak 4% Italian 1%
- Foreign-born
- 1%
- Languages at home
- 97% English-only · French/Haitian/Cajun 1% Other Indo-European 1% Tagalog/Filipino 1%
Political lean MEDSL · Madison
- 2024 margin
- Lean R (+9.0) · D 44.7% · R 53.7% · Other 1.6%
- 2008→2024 swing
- +6.0pp toward D · 2008: -14.9pp · 2024: -9.0pp
- All cycles
- 2024: R+9.0 2020: R+8.0 2016: R+16.8 2012: R+18.7 2008: R+14.9
Not yet ingested
- Civics
- —
Market trends
- HPI YoY
- ▲ 13.02%
- Current HPI
- 337.7613
- Rent YoY
- —
- Metro
- —
- State GDP YoY
- ▲ 2.94%
- F500 in state
- 4
Industry mix (Fortune 500 HQ in AL)
| Industry | F500 HQs | Revenue |
|---|---|---|
| Financial Services | 1 | $8B |
|
||
| Healthcare | 1 | $5B |
|
||
Price history
2 events — show timeline
- 2026-04-24 Pending — VMLS
- 2026-02-05 Listed $425,900 VMLS
Cash-flow waterfall
monthlySold comps — $/sqft
last 12 mo · ≤1 miLoading sold comps…