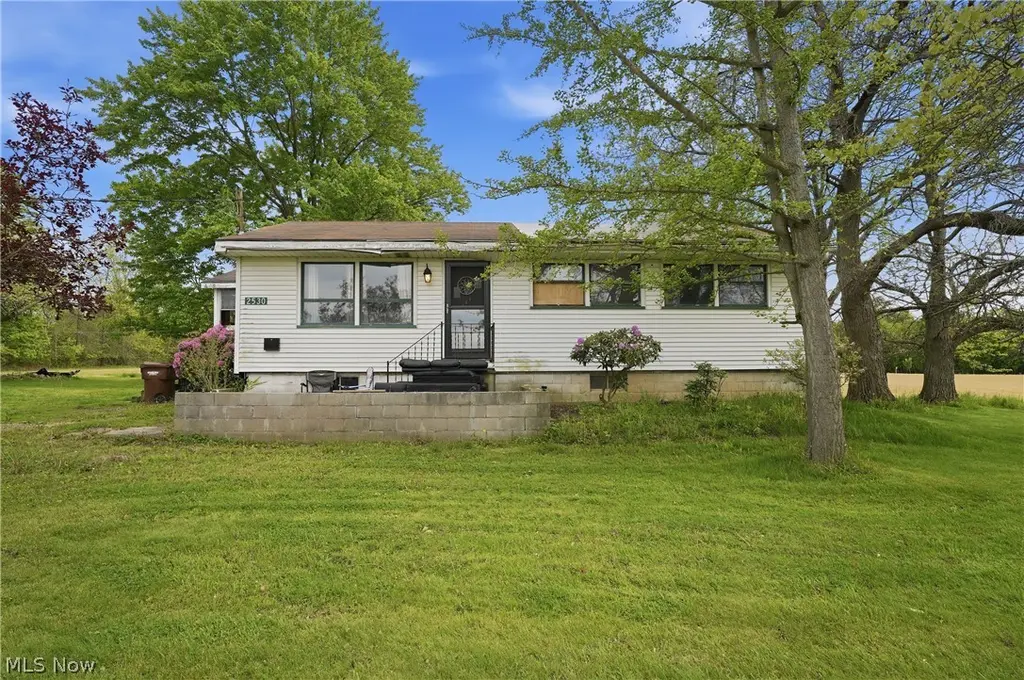
2530 Kinsman Rd NE · Cortland, OH
Flood risk 1/10 · Minimal
- FEMA flood zone
- X (unshaded)
- Chance of flooding over 30 yrs
- 0.0%
- Est. flood insurance / yr
- $473 – $860
Fire risk 1/10 · Minimal
- Est. fire insurance / yr
- $713 – $1,323
Heat risk 2/10 · Minimal
- Hot days now (above 96°F)
- 7 days/yr
- Hot days in 30 yrs
- 17 days/yr
Wind risk 1/10 · Minimal
- Chance of severe wind over 30 yrs
- —
Air-quality risk 3/10 · Minor
- Unhealthy air days now
- 1 days/yr
- Unhealthy air days in 30 yrs
- 4 days/yr
Risk factors via First Street. Map © Google.
Why this score? — see what drove the C- grade
The composite is a weighted blend of 9 inputs, each scored 0–100. Each bar is that input's sub-score; the figure is the points it added to the 100-point composite (weight × sub-score).
- Cash flow +14.2/30.0
- ARV discount +7.5/15.0
- Schools +6.9/10.0
- Appreciation +6.7/10.0
- DSCR +4.3/10.0
- Livability +4.2/5.0
- 1% rule +3.6/10.0
- Rent growth +2.5/5.0
- Condition / age +2.5/5.0
$119,900
🖨 Deal sheet (PDF) 📄 Offer letter ✓ Due diligence
Listing remarks
Attention all investors and renovation enthusiasts! This fixer-upper in Maplewood School District presents a great opportunity to put your own stamp on a property. This 3 bedroom home sitting on a gorgeous 2.61 acre lot, is a unique opportunity for the savvy buyer. Some improvements have been started throughout the home, and it also features a full basement and detached 2-car garage. Don't miss out – this is an AS IS, CASH sale. Present all offers; this will be an AS IS, CASH sale.
Key facts
- Full basement
- 2.61 acre lot
- 2.61 acre lot
Tags
Neighborhood map
What this means for you Summary
Snapshot
- This is a 3-bed/1.0-bath single-family listed at $120k.
Deal economics
- At list price, monthly cash flow is $20 ($239/yr) — positive.
- The deal already cash-flows at list — no discount required.
- To meet the 1% rule (rent ≥ 1% of price), the offer needs to be $103k (13.8% below list).
- Recommended offer: $103k (13.8% below list) — sets the bar for 1% rule.
- Cap rate 6.5% vs local median 3.2% in Cortland — top-decile yield for the area; either an underpriced asset or a hidden risk that comps aren't pricing in. Stress-test before assuming the spread holds.
Location & tenants
- Location reads 83/100 on livability (#64 in OH, #960 nationally) — a professional / high-income tenant draw. Strengths: crime A+, cost of living A+, housing A+; Watch: commute F.
- Maplewood Local (rural): math 83% / reading 81% proficiency, ranked #51 of 656 in OH (top 8%) — strong family-tenant draw, lease renewals of 3-5y typical.
- Zoned schools: Maplewood Elementary School (math 82% / reading 82%, grade A+, #116 of 1,584 statewide, top 9%, 335 students, 32% FRL); Maplewood High School (math 82% / reading 77%, grade A-, #35 of 781 statewide, top 6%, 276 students, 33% FRL) — zoned schools at 33% FRL track the district average.
- Market conditions: 6 active listings in the ZIP; 129 units permitted in Trumbull County in 2024 (0 in 5+ unit buildings).
Forward outlook
- In year one you build about $5k of equity ($829 loan paydown + $4k appreciation (3.5% local appreciation)).
- Trumbull County population projected at -22% by 2050 — secular population decline; favor cash flow + early exit over multi-decade hold.
- At projected returns (3.5% appreciation + 3.0% rent growth), your $34k cash investment doubles in ~6 years — after that, you're playing with house money.
- By year 7, paydown + projected appreciation supports a ~$32k cash-out refi (75% LTV) — recoverable capital for the next deal without selling this one.
Negotiation context
- It's been on market 24 days — a 2% lower offer ($118k) is reasonable based on typical stale-listing flexibility.
Questions for the listing agent
- Built in 1960 — when were the roof, HVAC, electrical panel, plumbing, and water heater last replaced?
- Is there a deadline driving the sale (1031 exchange, divorce, estate, relocation)? That informs how much negotiation room exists.
- Schools are A-rated — typically a magnet for longer-tenancy family renters. What's the average tenant stay here, and is there a school-zone premium baked into asking?
- What's the average days-on-market for RENTAL listings here right now (not sales)? A rising rental-DOM trend means longer vacancies and softer asking-rent achievability than the comps imply.
- What's the recent tenant-quality profile in this submarket — average credit score on applications, eviction rate, late-payment / NSF rate, and stable-employment percentage? A property-management company in the area should have these aggregated.
- How much new for-sale + rental construction is in the pipeline within 1–3 miles? Heavy new supply typically softens prices + rents 12–24 months out; constrained supply supports both.
Investment metrics
- 1% rule
- 0.86% ✗
- Cap rate
- 6.49%
- Cash-on-cash
- 0.71%
- DSCR
- 1.03
- GRM
- 9.7
CMA / ARV
No comps found within radius.
Projected returns pro-forma
3.49% appreciation · 3.0% rent growth · sell at horizon
- IRR
- 9.5%
- Equity multiple
- 1.56×
- Total profit
- $18,858
- Equity at exit
- $57,262
- IRR
- 11.7%
- Equity multiple
- 2.83×
- Total profit
- $61,546
- Equity at exit
- $90,945
Cash invested: $33,572 (down + closing). Projections, not guarantees.
Landlord ↔ Tenant lean methodology
- Overall (STATE)
- 73 Landlord-Friendly
- State Ohio
- 73 Landlord-Friendly · R+6
- County
- — inherits STATE
- City
- — inherits STATE
ZIP-level market 44450
- Home prices YoY
- 1.5%
- Active inventory
- 6
- Price-to-rent
- 9.7×
Monthly cashflow live
- Estimated rent
- $1,033 medium interval (Pro) →
- Mortgage (P&I)
- −$629
- Tax from tax record
- −$118 /mo · $1,413/yr
- Insurance
- −$50
- HOA
- −$0
- Vacancy / Maint / Mgmt
- −$217
- Net cashflow
- $20
Break-even live
Sensitivity live
| Price | -10% $88 | -5% $54 | +0% $20 | +5% $-14 | +10% $-48 |
|---|---|---|---|---|---|
| Rent | -10% $-62 | -5% $-21 | +0% $20 | +5% $61 | +10% $102 |
| Rate | -1.0pp $80 | -0.5pp $50 | base $20 | +0.5pp $-11 | +1.0pp $-43 |
UW: 25.0% down · 7.5% · 30yr · 1.5% tax · 5.0% vac · 8.0% maint · 8.0% mgmt
Financing live
Cash to close
- Down payment
- $29,975
- Closing costs
- $3,597
- Reserves months
- —
- Total cash needed
- —
Loan-product check · same deal, 3 products live
Conventional
25% down · 7.5% · 30yr
- Down + closing
- —
- Monthly P&I
- —
- Monthly cashflow
- —
- DSCR
- —
- Eligible?
- —
Personal DTI + credit; lowest rate.
DSCR
20% down · 8.5% · 30yr
- Down + closing
- —
- Monthly P&I
- —
- Monthly cashflow
- —
- DSCR
- —
- Eligible?
- —
No personal income docs; deal must DSCR.
Hard money
10% down · 12.0% · 12mo
- Down + closing
- —
- Monthly P&I
- —
- Monthly cashflow
- —
- DSCR
- —
- Eligible?
- —
Short-term bridge; refi at stabilization.
Listing history 10 events
-
2026-06-12statusdays on market $119,900 Pending 24 DOM
-
2026-06-09days on market $119,900 Contingent 23 DOM
-
2026-06-08days on market $119,900 Contingent 22 DOM
-
2026-06-08days on market $119,900 Contingent 21 DOM
-
2026-06-05days on market $119,900 Contingent 19 DOM
-
2026-06-04days on market $119,900 Contingent 17 DOM
-
2026-06-02days on market $119,900 Contingent 16 DOM
-
2026-06-01days on market $119,900 Contingent 15 DOM
-
2026-05-31days on market $119,900 Contingent 14 DOM
-
2026-05-17$119,900 Active
ⓘ Source: listings_history table (triggers on properties + properties_extension) + one-shot
backfill from property_details.listing_events for pre-trigger history.
Tax reassessment forecast OH · Partial reset (capped growth)
- Current annual tax
- $1,413 · $118/mo
- Projected year-2 tax
- $1,642 · $137/mo
- Expected delta
- +$229/yr (+$19/mo · 16.2%)
ⓘ Screening estimate from a state-policy table — verify with the county assessor before closing.
Climate risk First Street
- Flood 1/10 Low FEMA zone X (unshaded) · 0% chance over 30 yrs
- Wildfire 1/10 Low
- Heat 2/10 Low 7 d/yr ≥96°F today · 17 d/yr by 30 yrs out
- Wind 1/10 Low
- Air quality 3/10 Moderate 1 unhealthy d/yr today · 4 by 30 yrs out
Nearby sold comps map
Loading sold comps map…
Walkable amenities ~0.75 mi
Loading nearby amenities…
Taxation est. · year 1
- Rental income
- $12,401
- − Mortgage interest
- −$6,716
- − Property taxes
- −$1,413
- − Insurance
- −$600
- − Repairs & maintenance
- −$992
- − Management
- −$992
- − Depreciation
- −$3,488
- Taxable loss
- −$1,800
- Est. tax savings @ 24.0%
- +$432
- After-tax cash flow
- $671/yr
For passive investors: Depreciation is non-cash, so a rental often shows a tax loss while cash-flowing — sheltering income. Rental losses are passive: they offset passive income freely, and up to $25,000/yr can offset ordinary (W-2) income if you actively participate and your MAGI is under $100k (phasing out to $0 by $150k); unused losses carry forward. On sale, claimed depreciation is recaptured at up to 25%, and gains may owe capital-gains tax (a 1031 exchange can defer both). Figures are a year-1 estimate at your 24.0% rate — not tax advice; consult a CPA.
Schools (NCES district)
- District
- Maplewood Local
- NCES district ID
- 3905021
- Math proficiency
- 83% ▼ -7.00%
- Reading proficiency
- 81% ▼ -3.00%
- Median HH income
- $49,629
- Composite
- 69.3/100
- National rank
- #316
- State rank
- #51 of 656 in OH
Livability — Cortland
- Score
- 83/100
- State rank
- #64
- US rank
- #960
Category grades
Schools grade is shown separately in the Schools card above.
Census & demographics
- County
- Trumbull · 193,293 people
- Metro
- Youngstown-Warren, OH
- Population (ZIP)
- 2,217
- Household income
- $48,289
- Rent vs Own
- Severe rent burden
- 13.8
Population outlook (Trumbull County) Hauer SSP2
- Today (2025)
- 191,696 people
- By 2030
- 184,015 · -4.0%
- By 2040
- 166,810 · -13.0%
- By 2050
- 149,857 · -21.8%
- By 2075
- 115,769 · -39.6%
- By 2100
- 83,617 · -56.4%
Race, ethnicity, and origin ACS 2023
- Neighborhood character
- Predominantly White (89%)
- Race & ethnicity
- White 89% Two or more races 11%
- Common ancestry
- Polish 7% Serbian 2% Romanian 2%
- Foreign-born
- 1%
- Languages at home
- 85% English-only · German/W. Germanic 13% Russian/Polish/Slavic 1% Other Indo-European 1%
Political lean MEDSL · Trumbull
- 2024 margin
- R (+16.8) · D 41.2% · R 58.0%
- 2008→2024 swing
- -39.2pp toward R · 2008: 22.4pp · 2024: -16.8pp
- All cycles
- 2024: R+16.8 2020: R+10.6 2016: R+6.4 2012: D+22.2 2008: D+22.4
Not yet ingested
- Civics
- —
Market trends
- HPI YoY
- ▲ 3.49%
- Current HPI
- 236.704
- Rent YoY
- —
- Metro
- —
- State GDP YoY
- ▲ 1.98%
- F500 in state
- 48
Industry mix (Fortune 500 HQ in OH)
| Industry | F500 HQs | Revenue |
|---|---|---|
| Insurance | 3 | $145B |
|
||
| Industrial Machinery | 3 | $49B |
|
||
| Financial Services | 3 | $24B |
|
||
| Consumer Goods | 2 | $93B |
|
||
| Aerospace / Defense | 2 | $47B |
|
||
| Utilities | 2 | $33B |
|
||
Price history
1 event — show timeline
- 2026-05-17 Listed $119,900 MLSNOW
Property tax history
+5.4%/yrLatest (2025): $1,413 · +0.5% YoY. Source: county tax records.
Cash-flow waterfall
monthlySold comps — $/sqft
last 12 mo · ≤1 miLoading sold comps…