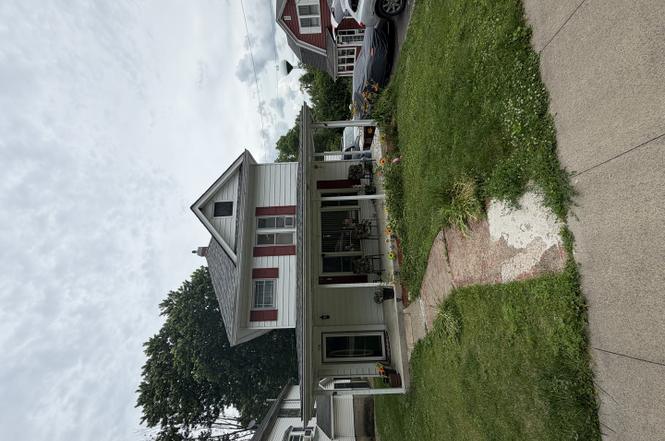
716 S Jackson St · Mount Carroll, IL
Flood risk 1/10 · Minimal
- FEMA flood zone
- X (unshaded)
- Chance of flooding over 30 yrs
- 0.0%
- Est. flood insurance / yr
- $473 – $860
Fire risk 1/10 · Minimal
- Est. fire insurance / yr
- $804 – $1,492
Heat risk 2/10 · Minimal
- Hot days now (above 102°F)
- 7 days/yr
- Hot days in 30 yrs
- 16 days/yr
Wind risk 2/10 · Minimal
- Chance of severe wind over 30 yrs
- —
Air-quality risk 2/10 · Minimal
- Unhealthy air days now
- 1 days/yr
- Unhealthy air days in 30 yrs
- 1 days/yr
Risk factors via First Street. Map © Google.
Why this score? — see what drove the D grade
The composite is a weighted blend of 9 inputs, each scored 0–100. Each bar is that input's sub-score; the figure is the points it added to the 100-point composite (weight × sub-score).
- Cash flow +11.1/30.0
- Appreciation +9.1/10.0
- ARV discount +7.5/15.0
- 1% rule +3.9/10.0
- Livability +3.4/5.0
- DSCR +3.2/10.0
- Rent growth +2.5/5.0
- Condition / age +2.5/5.0
- Schools +1.4/10.0
$150,000
🖨 Deal sheet (PDF) 📄 Offer letter ✓ Due diligence
Listing remarks MLS
This 2 Story, 3 to 4 bedroom, 2 bath home offering over 2200 finished square feet is a spacious and functional home designed for comfort and entertainment. Updates include shingles in 2018, carpet, luxury vinyl plank & laminate flooring in 2024. The main level consists of a living room, dining room, efficient kitchen, office area, laundry, rec room, and a family room or primary en suite with bathroom, walk-closet and back yard access. The second floor is accessed from an open staircase. There are three bedrooms, the second full bath and a walk-in storage closet on this level. The basement features a fun, Teke-themed bar room, adding a unique and fun element. This home offers a great blend of practical spaces and special features, making it ideal for both everyday living and entertaining.
Key facts
- Plenty of storage
- Flexible floor plan
- Spacious kitchen
Tags
Property features AI
Finance
- Other: Possession at closing; Living area is estimated
- HOA & community: No master association fee required
Exterior
- Parking: 2 parking spaces
- Utilities: Public water; Public sewer
- Home design: Detached single-family home; 2 stories; Fee simple ownership; Home is over 100 years old; Built before 1978
- Construction: Aluminum siding
- Exterior features: Lot dimensions approximately 50 x 130; Lot smaller than 0.25 acre; Asphalt parking surface
Interior
- Kitchen: Kitchen on main level (10 x 10)
- Bedrooms: 4 bedrooms (Master on main level; three additional bedrooms on second level)
- Bathrooms: 2 full bathrooms
- Heating & cooling: Forced air heating (Natural gas and electric); Central air conditioning
- Interior features: Partially finished basement; Total of 8 rooms
- Laundry & utility: Main-level laundry (10 x 9)
Neighborhood map
What this means for you Summary
Snapshot
- This is a 5-bed/2.0-bath other listed at $150k.
Deal economics
- At list price, monthly cash flow is $-60 ($-724/yr) — negative.
- To cash-flow at today's rent, offer at most $139k (7.1% below list).
- To meet the 1% rule (rent ≥ 1% of price), the offer needs to be $133k (11.4% below list).
- Recommended offer: $133k (11.4% below list) — sets the bar for 1% rule.
Location & tenants
- Location reads 67/100 on livability (#513 in IL) — a middle-class / working-renter tenant base. Strengths: cost of living A+, housing A+, crime B; Watch: amenities F, commute F, health & safety F.
- West Carroll CUSD 314 (rural): math 12% / reading 20% proficiency, ranked #498 of 620 in IL (top 80%) — low school quality limits family demand, transient renter base, plan for 1-2y turnover.
- Zoned schools: West Carroll Primary (math 12% / reading 17%, grade F, #1,278 of 2,056 statewide, top 65%, 416 students, 0% FRL); West Carroll Middle School (math 10% / reading 24%, grade F, #460 of 665 statewide, top 72%, 193 students, 0% FRL); West Carroll High School (math 15% / reading 15%, grade F, #462 of 693 statewide, top 68%, 286 students, 0% FRL) — zoned schools average 0% FRL vs 50% district-wide (50 pts lower); this property's tenant base skews higher-income than the district average.
- Market conditions: 21 active listings in the ZIP; 23 units permitted in Carroll County in 2024 (0 in 5+ unit buildings).
Forward outlook
- In year one you build about $13k of equity ($1k loan paydown + $12k appreciation (8.2% local appreciation)).
- Carroll County population projected at -30% by 2050 — secular population decline; favor cash flow + early exit over multi-decade hold.
- At projected returns (8.2% appreciation + 3.0% rent growth), your $42k cash investment doubles in ~4 years — after that, you're playing with house money.
- By year 3, paydown + projected appreciation supports a ~$33k cash-out refi (75% LTV) — recoverable capital for the next deal without selling this one.
Negotiation context
- Only 5 days on market — expect competitive offers; lowballing is unlikely to land.
- 2 sale attempts since 2y ago with the ask held roughly flat each time — persistent listings suggest the price (not the market) is what's stuck; bring a comps-based counter.
- Current owner paid $77k; list at $150k implies a 95% gain — meaningful room to come down on a strong offer.
Risks & watch-outs
- Watch-outs: built in 1903 — expect roof / HVAC / electrical / plumbing capex.
Questions for the listing agent
- What do current leases actually rent for vs. the listed asking? Can we see a recent rent roll and the last 12 months of T-12 income?
- Built in 1903 — when were the roof, HVAC, electrical panel, plumbing, and water heater last replaced?
- Is there a deadline driving the sale (1031 exchange, divorce, estate, relocation)? That informs how much negotiation room exists.
- Schools are F-rated, which usually means shorter tenancies and higher turnover. Who's the typical renter profile here, and what's been the actual vacancy rate?
- The area grade is low — what's the realistic commute time and amenity access for the typical tenant pool here? Any planned neighborhood developments (good or bad) we should know about?
- What's the average days-on-market for RENTAL listings here right now (not sales)? A rising rental-DOM trend means longer vacancies and softer asking-rent achievability than the comps imply.
- What's the recent tenant-quality profile in this submarket — average credit score on applications, eviction rate, late-payment / NSF rate, and stable-employment percentage? A property-management company in the area should have these aggregated.
- How much new for-sale + rental construction is in the pipeline within 1–3 miles? Heavy new supply typically softens prices + rents 12–24 months out; constrained supply supports both.
Investment metrics
- 1% rule
- 0.89% ✗
- Cap rate
- 5.81%
- Cash-on-cash
- -1.72%
- DSCR
- 0.92
- GRM
- 9.4
CMA / ARV
No comps found within radius.
Projected returns pro-forma
8.19% appreciation · 3.0% rent growth · sell at horizon
- IRR
- 19.1%
- Equity multiple
- 2.42×
- Total profit
- $59,799
- Equity at exit
- $115,855
- IRR
- 17.9%
- Equity multiple
- 5.20×
- Total profit
- $176,572
- Equity at exit
- $231,803
Cash invested: $42,000 (down + closing). Projections, not guarantees.
Landlord ↔ Tenant lean methodology
- Overall (STATE)
- 43 Moderately Tenant-Leaning
- State Illinois
- 43 Moderately Tenant-Leaning · D+7
- County
- — inherits STATE
- City
- — inherits STATE
ZIP-level market 61053
- Home prices YoY
- 5.4%
- Active inventory
- 21
- Price-to-rent
- 9.4×
Monthly cashflow live
- Estimated rent
- $1,330 medium interval (Pro) →
- Mortgage (P&I)
- −$787
- Tax from tax record
- −$262 /mo · $3,138/yr
- Insurance
- −$62
- HOA
- −$0
- Vacancy / Maint / Mgmt
- −$279
- Net cashflow
- $-60
Break-even live
Sensitivity live
| Price | -10% $25 | -5% $-18 | +0% $-60 | +5% $-103 | +10% $-145 |
|---|---|---|---|---|---|
| Rent | -10% $-165 | -5% $-113 | +0% $-60 | +5% $-8 | +10% $45 |
| Rate | -1.0pp $15 | -0.5pp $-22 | base $-60 | +0.5pp $-99 | +1.0pp $-139 |
UW: 25.0% down · 7.5% · 30yr · 1.5% tax · 5.0% vac · 8.0% maint · 8.0% mgmt
Financing live
Cash to close
- Down payment
- $37,500
- Closing costs
- $4,500
- Reserves months
- —
- Total cash needed
- —
Loan-product check · same deal, 3 products live
Conventional
25% down · 7.5% · 30yr
- Down + closing
- —
- Monthly P&I
- —
- Monthly cashflow
- —
- DSCR
- —
- Eligible?
- —
Personal DTI + credit; lowest rate.
DSCR
20% down · 8.5% · 30yr
- Down + closing
- —
- Monthly P&I
- —
- Monthly cashflow
- —
- DSCR
- —
- Eligible?
- —
No personal income docs; deal must DSCR.
Hard money
10% down · 12.0% · 12mo
- Down + closing
- —
- Monthly P&I
- —
- Monthly cashflow
- —
- DSCR
- —
- Eligible?
- —
Short-term bridge; refi at stabilization.
Listing history 5 events
-
2026-06-22days on market $150,000 Active 5 DOM
-
2026-06-21days on market $150,000 Active 4 DOM
-
2026-06-19days on market $150,000 Active 2 DOM
-
2026-06-17remarks 498-char remark
-
2026-06-17$150,000 Active 1 DOM
ⓘ Source: listings_history table (triggers on properties + properties_extension) + one-shot
backfill from property_details.listing_events for pre-trigger history.
Tax reassessment forecast IL · Partial reset (capped growth)
- Current annual tax
- $3,138 · $262/mo
- Projected year-2 tax
- $3,272 · $273/mo
- Expected delta
- +$133/yr (+$11/mo · 4.3%)
ⓘ Screening estimate from a state-policy table — verify with the county assessor before closing.
Climate risk First Street
- Flood 1/10 Low FEMA zone X (unshaded) · 0% chance over 30 yrs
- Wildfire 1/10 Low
- Heat 2/10 Low 7 d/yr ≥102°F today · 16 d/yr by 30 yrs out
- Wind 2/10 Low
- Air quality 2/10 Low 1 unhealthy d/yr today · 1 by 30 yrs out
Nearby sold comps map
Loading sold comps map…
Walkable amenities ~0.75 mi
Loading nearby amenities…
Taxation est. · year 1
- Rental income
- $15,954
- − Mortgage interest
- −$8,402
- − Property taxes
- −$3,138
- − Insurance
- −$750
- − Repairs & maintenance
- −$1,276
- − Management
- −$1,276
- − Depreciation
- −$4,364
- Taxable loss
- −$3,252
- Est. tax savings @ 24.0%
- +$781
- After-tax cash flow
- $57/yr
For passive investors: Depreciation is non-cash, so a rental often shows a tax loss while cash-flowing — sheltering income. Rental losses are passive: they offset passive income freely, and up to $25,000/yr can offset ordinary (W-2) income if you actively participate and your MAGI is under $100k (phasing out to $0 by $150k); unused losses carry forward. On sale, claimed depreciation is recaptured at up to 25%, and gains may owe capital-gains tax (a 1031 exchange can defer both). Figures are a year-1 estimate at your 24.0% rate — not tax advice; consult a CPA.
Schools (NCES district)
- District
- West Carroll CUSD 314
- NCES district ID
- 1700310
- Math proficiency
- 12% ▼ -5.00%
- Reading proficiency
- 20% ▼ -3.00%
- Median HH income
- $43,090
- Composite
- 13.91/100
- National rank
- #9483
- State rank
- #498 of 620 in IL
Livability — Mount Carroll
- Score
- 67/100
- State rank
- #513
- US rank
- #10633
Category grades
Schools grade is shown separately in the Schools card above.
Census & demographics
- Census place
- Mount Carroll, IL
- Population (ZIP)
- 2,902
Population outlook (Carroll County) Hauer SSP2
- Today (2025)
- 13,010 people
- By 2030
- 12,150 · -6.6%
- By 2040
- 10,462 · -19.6%
- By 2050
- 9,078 · -30.2%
- By 2075
- 6,704 · -48.5%
- By 2100
- 5,004 · -61.5%
Race, ethnicity, and origin ACS 2023
- Neighborhood character
- Predominantly White (94%)
- Race & ethnicity
- White 94% Two or more races 3% Hispanic / Latino 3% Asian 1%
- Common ancestry
- Slovak 2% Lithuanian 2% Portuguese 2%
- Foreign-born
- 1%
- Languages at home
- 90% English-only · German/W. Germanic 8% Other Indo-European 1% Spanish 1%
Political lean MEDSL · Carroll
- 2024 margin
- Solid R (+31.7) · D 33.2% · R 64.8% · Other 2.0%
- 2008→2024 swing
- -36.5pp toward R · 2008: 4.8pp · 2024: -31.7pp
- All cycles
- 2024: R+31.7 2020: R+29.4 2016: R+27.1 2012: D+1.4 2008: D+4.8
Not yet ingested
- Civics
- —
Market trends
- HPI YoY
- ▲ 8.19%
- Current HPI
- 160.8203
- Rent YoY
- —
- Metro
- —
- State GDP YoY
- ▲ 1.59%
- F500 in state
- 60
Industry mix (Fortune 500 HQ in IL)
| Industry | F500 HQs | Revenue |
|---|---|---|
| Insurance | 4 | $201B |
|
||
| Consumer Goods | 4 | $87B |
|
||
| Industrial Machinery | 3 | $64B |
|
||
| Healthcare | 2 | $55B |
|
||
| Retail / Pharmacy | 1 | $148B |
|
||
| Agriculture / Food | 1 | $86B |
|
||
Price history
+87.5% since first listed7 events — show timeline
- 2026-06-17 Listed $150,000 MRED as Distributed by MLS Grid
- 2025-02-05 Sold (Public Records) $77,000 Public Records
- 2025-02-04 Sold (MLS) $77,000 NWIAR
- 2025-01-21 Pending — NWIAR
- 2024-11-18 Price Changed $79,900 NWIAR
- 2024-08-13 Listed $89,900 NWIAR
- 2005-04-04 Sold (Public Records) $80,000 Public Records
Property tax history
+4.8%/yrLatest (2024): $3,138 · +3.1% YoY. Source: county tax records.
Cash-flow waterfall
monthlySold comps — $/sqft
last 12 mo · ≤1 miLoading sold comps…