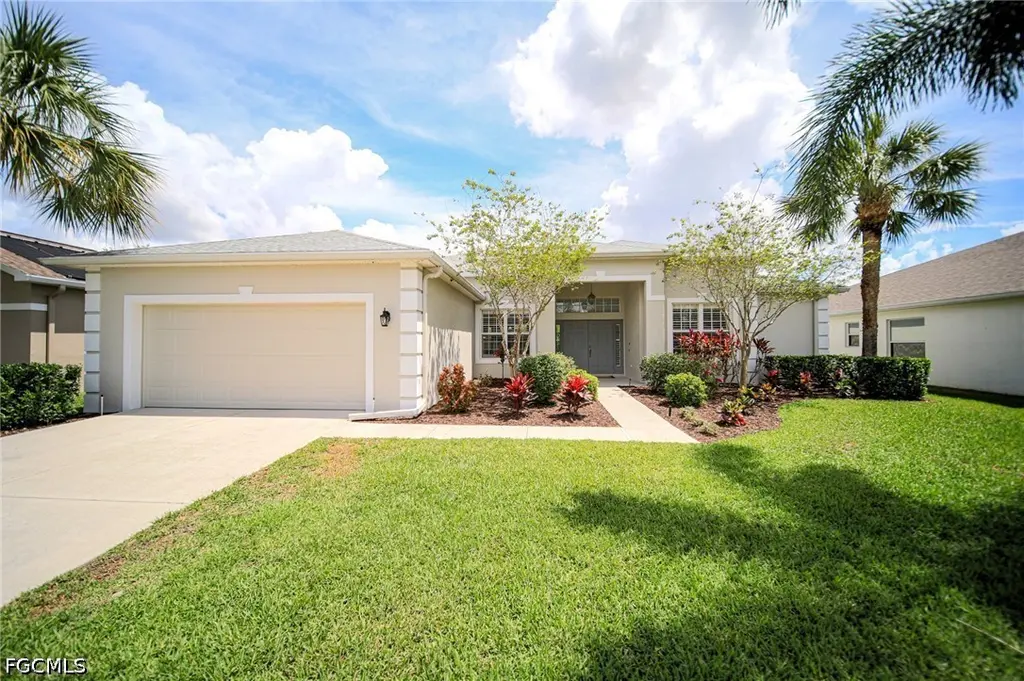
12765 Aston Oaks Dr · Fort Myers, FL
Flood risk 1/10 · Minimal
- FEMA flood zone
- X (unshaded)
- Chance of flooding over 30 yrs
- 0.0%
- Est. flood insurance / yr
- $507 – $1,088
Fire risk 4/10 · Minor
- Est. fire insurance / yr
- $947 – $1,759
Heat risk 10/10 · Severe
- Hot days now (above 107°F)
- 7 days/yr
- Hot days in 30 yrs
- 32 days/yr
Wind risk 10/10 · Severe
- Chance of severe wind over 30 yrs
- 99.0%
Air-quality risk 2/10 · Minimal
- Unhealthy air days now
- 1 days/yr
- Unhealthy air days in 30 yrs
- 1 days/yr
Risk factors via First Street. Map © Google.
Why this score? — see what drove the D- grade
The composite is a weighted blend of 9 inputs, each scored 0–100. Each bar is that input's sub-score; the figure is the points it added to the 100-point composite (weight × sub-score).
- Cash flow +10.0/30.0
- ARV discount +8.6/15.0
- Livability +4.3/5.0
- Schools +4.1/10.0
- DSCR +2.9/10.0
- Rent growth +2.7/5.0
- Condition / age +2.5/5.0
- 1% rule +2.4/10.0
- Appreciation +0.0/10.0
$444,900
🖨 Deal sheet 📄 Offer letter ✓ Due diligence
Listing remarks
You Will Be Amazed By This Completely Remodeled 4 Bedroom/2 Bathroom Home In The Very Desirable Danforth Lakes Community In Fort Myers, Florida. The Kitchen Comes With Brand New Textured Brush Granite Countertops, New Stainless Steel Appliances, New Sink/Faucet, New Brushed Nickle Pulls, A Granite Peninsula That Can Add 5 More Seats, And A Huge Walk-In Pantry. This Home Has Been Totally Repainted Inside, With New Lighting, New Carpeting In The Bedrooms, And New Granite Countertops In Both Bathrooms. The Roof Was New In 2022, It Also Has A Newer Water Heater And Newer A/C Units. The 4th Bedroom Has Double Wood French Doors And Can Also Be Used As A Private Home Office. Other Upgrades Include
Key facts
- Huge walk-in pantry
- Large breakfast nook
- Remodeled home
Tags
Property features AI
Finance
- Financial info: Pets allowed conditionally; contact for details (breed restrictions include no aggressive breeds)
- HOA & community: Homeowners association with monthly fee; Association management includes legal/accounting, reserve fund, road maintenance and street lights; Community amenities include clubhouse, fitness center, playground, pool, spa/hot tub, sidewalks, trails and satellite TV; Community is non-gated and has street lights
Exterior
- Parking: Attached garage with 2 covered spaces; Driveway with paved access and garage door opener
- Security: Owned security system and additional security system features; Key card entry; Smoke detectors
- Utilities: Public water; Public sewer; Cable available and high-speed internet available; Underground utilities; Municipal irrigation source
- Home design: Single-story residence; Resale property; Entry level: 1; Faces west
- Construction: Block, concrete and stucco construction; Shingle roof; Built on conventional foundation
- Exterior features: Open porch/lanai and screened porch; Room for pool; Automatic sprinklers / irrigation; Community pool; East exposure; Private paved road frontage maintained privately; Rectangular lot with dimensions approximately 70 x 120
Interior
- Kitchen: Range; Self-cleaning oven; Microwave; Dishwasher; Disposal; Icemaker; Refrigerator; Walk-in pantry; Eat-in kitchen and breakfast bar
- Bedrooms: Master bedroom on main level; Two additional bedrooms on main level
- Flooring: Carpet; Tile; Wood
- Bathrooms: Two full bathrooms
- Heating & cooling: Central heating (electric); Central air conditioning (electric); Ceiling fans
- Interior features: Breakfast bar and breakfast area; Built-in features and custom mirrors; Separate/formal dining room; Eat-in kitchen with pantry and walk-in pantry; High ceilings; Living/dining room combination; Main level primary bedroom with sitting area; Dual sinks, separate shower and bathtub; Closet cabinetry and walk-in closet(s); Window treatments and window types including single-hung, sliding and transom windows; French doors; Cable TV
- Laundry & utility: Washer and dryer included; Interior laundry/utility room
Neighborhood map
What this means for you Summary
Snapshot
- This is a 4-bed/2.0-bath single-family listed at $445k.
Deal economics
- At list price, monthly cash flow is $-265 ($-3k/yr) — negative.
- To cash-flow at today's rent, offer at most $398k (10.5% below list).
- To meet the 1% rule (rent ≥ 1% of price), the offer needs to be $329k (26.1% below list).
- Recommended offer: $329k (26.1% below list) — sets the bar for 1% rule.
- Cap rate 5.6% vs local median 3.0% in Fort Myers — top-decile yield for the area; either an underpriced asset or a hidden risk that comps aren't pricing in. Stress-test before assuming the spread holds.
Location & tenants
- Location reads 86/100 on livability (#14 in FL, #383 nationally) — a professional / high-income tenant draw. Strengths: amenities A+, commute A+, housing A+.
- Lee (suburban): math 47% / reading 50% proficiency, ranked #42 of 73 in FL (top 58%) — families likely to look elsewhere, expect single-tenant / working-renter base with shorter leases.
- Market conditions: Rents flat; 305 active listings in the ZIP; 22 comparable units currently listed for rent nearby; rentals at typical pace (median 24d on market — plan ~3-4 weeks tenant-placement turnaround); solid renter incomes; 15,411 units permitted in Lee County in 2024 (4,686 in 5+ unit buildings).
- This rent runs 38% of the median local income ($103k/yr) — at the standard rent-burdened threshold; future hikes will face affordability resistance.
Forward outlook
- Local home prices are declining (-3.0%/yr); year-one equity from $3k of loan paydown is wiped out by about $13k of value loss. Plan a longer hold.
- Lee County population projected at +44% by 2050 — long-run rental-demand tailwind backs the buy-and-hold thesis.
Negotiation context
- It's been on market 67 days — a 6% lower offer ($418k) is reasonable based on typical stale-listing flexibility.
- Current owner paid $300k; 48% above their basis — modest negotiation headroom, anchor on the comps not their cost.
Risks & watch-outs
- Climate carrying-cost: severe wind risk, 99% chance of damaging wind over 30y; extreme-heat days projected 7→32/yr by 2055 (HVAC capex compounding) — expect insurance premiums to compound above CPI over the hold.
Questions for the listing agent
- What do current leases actually rent for vs. the listed asking? Can we see a recent rent roll and the last 12 months of T-12 income?
- It's been on market 67 days. Have you received any prior offers? Is the seller open to a 26% concession, seller financing, or rate buy-down credit?
- What does the HOA fee cover, when was the last increase, and are there any pending special assessments or reserve-fund shortfalls?
- Why hasn't it sold? Are there any deal-killer items the seller is aware of (foundation, flood, title, zoning, code violations)?
- Is there a deadline driving the sale (1031 exchange, divorce, estate, relocation)? That informs how much negotiation room exists.
- The area grade is low — what's the realistic commute time and amenity access for the typical tenant pool here? Any planned neighborhood developments (good or bad) we should know about?
- What's the average days-on-market for RENTAL listings here right now (not sales)? A rising rental-DOM trend means longer vacancies and softer asking-rent achievability than the comps imply.
- What's the recent tenant-quality profile in this submarket — average credit score on applications, eviction rate, late-payment / NSF rate, and stable-employment percentage? A property-management company in the area should have these aggregated.
- How much new for-sale + rental construction is in the pipeline within 1–3 miles? Heavy new supply typically softens prices + rents 12–24 months out; constrained supply supports both.
Investment metrics
- 1% rule
- 0.74% ✗
- Cap rate
- 5.58%
- Cash-on-cash
- -2.55%
- DSCR
- 0.89
- GRM
- 11.3
CMA / ARV
- ARV (on-the-fly)
- $456,021
- Comps found
- 5
Show comp detail 5 sales within ~0.75 mi
| Address | Dist | Beds/Ba | Sqft | Sold | Price | $/sf | Match |
|---|---|---|---|---|---|---|---|
| 12600 Strathmore Loop | 0.41mi | 3/2.0 (-1) | 2,125 (-4%) | 5mo | $440,000 | $207 | 66 |
| 12841 Havenridge Cir | 0.33mi | 4/2.0 | 1,943 (-12%) | 1mo | $367,000 | $189 | 64 |
| 8860 Falcon Pointe Loop | 0.17mi | 3/2.5 (-1) | 2,527 (+15%) | 2mo | $335,900 | $133 | 58 |
| 12788 Aston Oaks Dr | 0.08mi | 3/2.0 (-1) | 1,877 (-15%) | 14mo | $390,000 | $208 | 54 |
| 8231 Arborfield Ct | 0.64mi | 3/2.0 (-1) | 2,075 (-6%) | 10mo | $517,000 | $249 | 48 |
Match score weights: distance 35% · size 25% · config 20% · recency 20%. Top-matched comps best support the ARV.
Projected returns pro-forma
-3.0% appreciation · 0.94% rent growth · sell at horizon
- IRR
- -22.7%
- Equity multiple
- 0.23×
- Total profit
- $-95,738
- Equity at exit
- $66,336
- IRR
- -22.9%
- Equity multiple
- -0.06×
- Total profit
- $-131,728
- Equity at exit
- $38,467
Cash invested: $124,572 (down + closing). Projections, not guarantees.
Landlord ↔ Tenant lean methodology
- Overall (STATE)
- 87 Strongly Landlord-Friendly
- State Florida
- 87 Strongly Landlord-Friendly · R+3
- County
- — inherits STATE
- City
- — inherits STATE
ZIP-level market 33912
- Rents YoY
- 0.9%
- Active inventory
- 305
- Price-to-rent
- 11.3×
Monthly cashflow live
- Estimated rent
- $3,287 high interval (Pro) →
- Mortgage (P&I)
- −$2,333
- Tax from tax record
- −$199 /mo · $2,382/yr
- Insurance
- −$185
- HOA
- −$145
- Vacancy / Maint / Mgmt
- −$690
- Net cashflow
- $-265
Break-even live
UW: 25.0% down · 7.5% · 30yr · 1.5% tax · 5.0% vac · 8.0% maint · 8.0% mgmt
Financing live
Cash to close
- Down payment
- $111,225
- Closing costs
- $13,347
- Reserves months
- —
- Total cash needed
- —
Loan-product check · same deal, 3 products live
Conventional
25% down · 7.5% · 30yr
- Down + closing
- —
- Monthly P&I
- —
- Monthly cashflow
- —
- DSCR
- —
- Eligible?
- —
Personal DTI + credit; lowest rate.
DSCR
20% down · 8.5% · 30yr
- Down + closing
- —
- Monthly P&I
- —
- Monthly cashflow
- —
- DSCR
- —
- Eligible?
- —
No personal income docs; deal must DSCR.
Hard money
10% down · 12.0% · 12mo
- Down + closing
- —
- Monthly P&I
- —
- Monthly cashflow
- —
- DSCR
- —
- Eligible?
- —
Short-term bridge; refi at stabilization.
Rent comps 22 comps
| Address | Beds | Baths | Sqft | Rent | $/sqft | DOM | Units | Dist |
|---|---|---|---|---|---|---|---|---|
| 12790 Meadow Hawk Dr Fort Myers, FL | 3.0 | 2.0 | 1905 | $2,800 | $1.47 | 15d | 1 | 0.09mi |
| 12986 Kedleston Cir Fort Myers, FL | 3.0 | 2.0 | 1931 | $3,200 | $1.66 | 24d | 1 | 0.19mi |
| 9281 Triana Ter #1 Fort Myers, FL | 3.0 | 2.0 | 1826 | $8,500 | $4.65 | 24d | 1 | 0.59mi |
| 12531 Villagio Way Fort Myers, FL | 3.0 | 2.0 | 1913 | $8,500 | $4.44 | 24d | 1 | 0.63mi |
| 9221 Triana Ter #4 Fort Myers, FL | 3.0 | 3.0 | 2520 | $11,500 | $4.56 | 24d | 1 | 0.65mi |
| 9340 Triana Ter #4 Fort Myers, FL | 3.0 | 3.0 | 2563 | $7,500 | $2.93 | 24d | 1 | 0.70mi |
| 11907 Nalda St #11906 Fort Myers, FL | 4.0 | 2.5 | 2005 | $7,500 | $3.74 | 24d | 1 | 0.72mi |
| 11908 Izarra Way #7005 Fort Myers, FL | 3.0 | 2.5 | 1637 | $5,500 | $3.36 | 24d | 1 | 0.74mi |
| 11850 Liana St #9001 Fort Myers, FL | 3.0 | 2.5 | 1674 | $6,500 | $3.88 | 24d | 1 | 0.77mi |
| 11890 Paseo Grande Blvd #4305 Fort Myers, FL | 3.0 | 2.5 | 1637 | $2,800 | $1.71 | 14d | 1 | 0.80mi |
| 11890 Paseo Grande Blvd #4305 Fort Myers, FL | 3.0 | 2.5 | 1637 | $2,800 | $1.71 | 3d | 1 | 0.80mi |
| 11907 Adoncia Way #3005 Fort Myers, FL | 3.0 | 2.0 | 1722 | $2,800 | $1.63 | 2d | 1 | 0.82mi |
| 11907 Adoncia Way #3002 Fort Myers, FL | 3.0 | 2.5 | 1637 | $2,600 | $1.59 | 24d | 1 | 0.82mi |
| 11845 Palba Way #7301 Fort Myers, FL | 3.0 | 2.5 | 2026 | $5,900 | $2.91 | 24d | 1 | 0.83mi |
| 8808 Cypress Preserve Pl Fort Myers, FL | 3.0 | 2.0 | 2250 | $2,900 | $1.29 | 3d | 1 | 1.31mi |
| 8808 Cypress Preserve Pl Fort Myers, FL | 3.0 | 2.0 | 2260 | $2,900 | $1.28 | 21d | 1 | 1.31mi |
| 8309 Adelio Ln Fort Myers, FL | 3.0 | 2.0 | 1809 | $6,500 | $3.59 | 3d | 1 | 1.31mi |
| 13337 Tall Grass Ct Unit 1 Fort Myers, FL | 3.0 | 2.5 | 1646 | $2,250 | $1.37 | 19d | 1 | 1.37mi |
| 8976 Cypress Preserve Pl Fort Myers, FL | 4.0 | 2.5 | 2410 | $2,690 | $1.12 | 2d | 1 | 1.38mi |
| 13633 Admiral Ct Fort Myers, FL | 3.0 | 2.0 | 1547 | $2,500 | $1.62 | 24d | 1 | 1.39mi |
| 13669 Admiral Ct Fort Myers, FL | 3.0 | 2.0 | 1860 | $2,500 | $1.34 | 24d | 1 | 1.43mi |
| 11072 Esteban Dr Fort Myers, FL | 3.0 | 3.0 | 1875 | $7,250 | $3.87 | 24d | 1 | 1.45mi |
HOA detail
- Monthly dues
- $145 · $1,740/yr
- Likely covers
- water
Listing history 20 events
-
2026-06-17days on market $444,900 Active 67 DOM
-
2026-06-16days on market $444,900 Active 66 DOM
-
2026-06-15days on market $444,900 Active 65 DOM
-
2026-06-13days on market $444,900 Active 63 DOM
-
2026-06-10days on market $444,900 Active 60 DOM
-
2026-06-09pricedays on market $444,900 Active 59 DOM
-
2026-06-07days on market $449,900 Active 57 DOM
-
2026-06-03days on market $449,900 Active 53 DOM
-
2026-06-02days on market $449,900 Active 52 DOM
-
2026-06-01days on market $449,900 Active 51 DOM
-
2026-05-31days on market $449,900 Active 50 DOM
-
2026-05-18price $449,900
-
2026-05-08price $459,900
-
2026-04-30price $464,900
-
2026-04-11$468,900 Active
-
2026-02-24soldstatus $300,000
-
2004-03-12soldstatus $232,000
-
2004-03-04soldstatus $232,000
-
2003-12-08price $232,900
-
1994-07-01soldstatus $1,280,000
ⓘ Source: listings_history table (triggers on properties + properties_extension) + one-shot
backfill from property_details.listing_events for pre-trigger history.
Tax reassessment forecast FL · Resets to sale price
- Current annual tax
- $2,382 · $199/mo
- Projected year-2 tax
- $3,693 · $308/mo
- Expected delta
- +$1,310/yr (+$109/mo · 55.0%)
ⓘ Screening estimate from a state-policy table — verify with the county assessor before closing.
Climate risk First Street
- Flood 1/10 Low FEMA zone X (unshaded) · 0% chance over 30 yrs
- Wildfire 4/10 Moderate
- Heat 10/10 Extreme 7 d/yr ≥107°F today · 32 d/yr by 30 yrs out
- Wind 10/10 Extreme 99% chance of damaging wind over 30 yrs
- Air quality 2/10 Low 1 unhealthy d/yr today · 1 by 30 yrs out
Nearby sold comps map
Loading sold comps map…
Walkable amenities ~0.75 mi
Loading nearby amenities…
Taxation est. · year 1
- Rental income
- $39,446
- − Mortgage interest
- −$24,921
- − Property taxes
- −$2,382
- − Insurance
- −$2,224
- − Repairs & maintenance
- −$3,156
- − Management
- −$3,156
- − HOA
- −$1,740
- − Depreciation
- −$12,943
- Taxable loss
- −$11,076
- Est. tax savings @ 24.0%
- +$2,658
- After-tax cash flow
- $-524/yr
For passive investors: Depreciation is non-cash, so a rental often shows a tax loss while cash-flowing — sheltering income. Rental losses are passive: they offset passive income freely, and up to $25,000/yr can offset ordinary (W-2) income if you actively participate and your MAGI is under $100k (phasing out to $0 by $150k); unused losses carry forward. On sale, claimed depreciation is recaptured at up to 25%, and gains may owe capital-gains tax (a 1031 exchange can defer both). Figures are a year-1 estimate at your 24.0% rate — not tax advice; consult a CPA.
Schools (NCES district)
- District
- Lee
- NCES district ID
- 1201080
- Math proficiency
- 47% ▼ -11.00%
- Reading proficiency
- 50% ▼ -4.00%
- Median HH income
- $49,518
- Composite
- 41.49/100
- National rank
- #3458
- State rank
- #42 of 73 in FL
Livability — Fort Myers
- Score
- 86/100
- State rank
- #14
- US rank
- #383
Category grades
Schools grade is shown separately in the Schools card above.
Census & demographics
- County
- Lee County · 788,662 people
- City population
- 278,598
- Metro
- Cape Coral-Fort Myers, FL
- Population (ZIP)
- 19,533
- Household income
- $103,194
- Rent vs Own
- Severe rent burden
- 292.0
Population outlook (Lee County) Hauer SSP2
- Today (2025)
- 871,946 people
- By 2030
- 955,468 · +9.6%
- By 2040
- 1,113,587 · +27.7%
- By 2050
- 1,256,891 · +44.1%
- By 2075
- 1,560,270 · +78.9%
- By 2100
- 1,726,848 · +98.0%
Race, ethnicity, and origin ACS 2023
- Neighborhood character
- Predominantly White (85%)
- Race & ethnicity
- White 85% Hispanic / Latino 8% Two or more races 7% Black 3% Asian 2%
- Hispanic origin (detail)
- Puerto Rican 2% Cuban 3%
- Common ancestry
- Romanian 4% Italian 3% Slovak 2%
- Foreign-born
- 11% · Canada, China, South Korea
- Languages at home
- 87% English-only · Spanish 7% French/Haitian/Cajun 2% Other Indo-European 2%
Political lean MEDSL · Lee
- 2024 margin
- Strong R (+28.4) · D 35.5% · R 63.9%
- 2008→2024 swing
- -18.0pp toward R · 2008: -10.4pp · 2024: -28.4pp
- All cycles
- 2024: R+28.4 2020: R+19.2 2016: R+20.4 2012: R+16.6 2008: R+10.4
Not yet ingested
- Civics
- —
Market trends
- HPI YoY
- ▼ -180.73%
- Current HPI
- 226.7102
- Rent YoY
- ▲ 0.94%
- Metro
- Cape Coral-Fort Myers, FL
- State GDP YoY
- ▲ 3.28%
- F500 in state
- 36
Industry mix (Fortune 500 HQ in FL)
| Industry | F500 HQs | Revenue |
|---|---|---|
| Industrial Technology | 2 | $29B |
|
||
| Insurance | 2 | $17B |
|
||
| Retail | 1 | $60B |
|
||
| Technology Distribution | 1 | $58B |
|
||
| Homebuilding | 1 | $35B |
|
||
| Technology Manufacturing | 1 | $35B |
|
||
Price history
-64.9% since first listed9 events — show timeline
- 2026-05-18 Price Changed $449,900 FORTMLS
- 2026-05-08 Price Changed $459,900 FORTMLS
- 2026-04-30 Price Changed $464,900 FORTMLS
- 2026-04-11 Listed $468,900 FORTMLS
- 2026-02-24 Sold (Public Records) $300,000 Public Records
- 2004-03-12 Sold (Public Records) $232,000 Public Records
- 2004-03-04 Sold (MLS) $232,000 FORTMLS
- 2003-12-08 Price Changed $232,900 FORTMLS
- 1994-07-01 Sold (Public Records) $1,280,000 Public Records
Property tax history
+1.2%/yrLatest (2025): $2,382 · +4.7% YoY. Source: county tax records.
Cash-flow waterfall
monthlySold comps — $/sqft
last 12 mo · ≤1 miLoading sold comps…