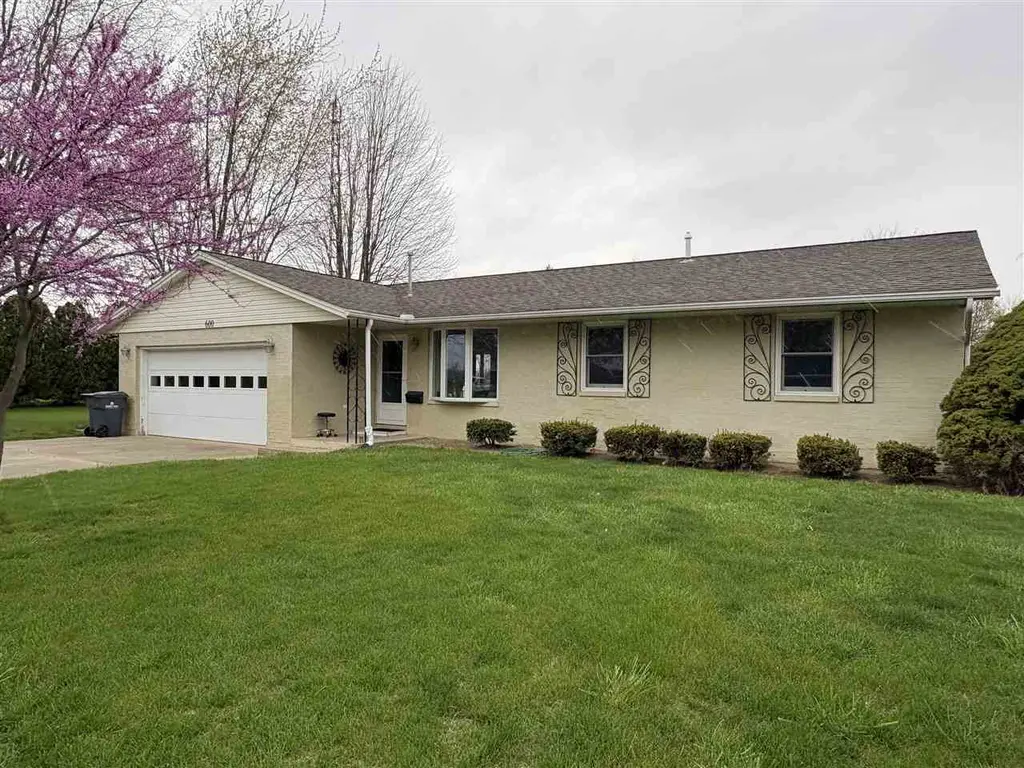
600 Glynn Ellen Dr · Union City, IN
Flood risk 1/10 · Minimal
- FEMA flood zone
- X (unshaded)
- Chance of flooding over 30 yrs
- 0.0%
- Est. flood insurance / yr
- $507 – $1,088
Fire risk 1/10 · Minimal
- Est. fire insurance / yr
- $717 – $1,331
Heat risk 3/10 · Minor
- Hot days now (above 100°F)
- 7 days/yr
- Hot days in 30 yrs
- 18 days/yr
Wind risk 2/10 · Minimal
- Chance of severe wind over 30 yrs
- 1.0%
Air-quality risk 3/10 · Minor
- Unhealthy air days now
- 2 days/yr
- Unhealthy air days in 30 yrs
- 3 days/yr
Risk factors via First Street. Map © Google.
Why this score? — see what drove the D grade
The composite is a weighted blend of 9 inputs, each scored 0–100. Each bar is that input's sub-score; the figure is the points it added to the 100-point composite (weight × sub-score).
- Cash flow +10.2/30.0
- Appreciation +10.0/10.0
- ARV discount +7.4/15.0
- Livability +3.2/5.0
- DSCR +2.9/10.0
- Rent growth +2.5/5.0
- Schools +2.5/10.0
- Condition / age +2.5/5.0
- 1% rule +2.3/10.0
$164,900
🖨 Deal sheet (PDF) 📄 Offer letter ✓ Due diligence
Listing remarks MLS
Introducing a charming and spacious Brick Ranch, boasting three bedrooms and one and a half baths. Spanning across 1418 square feet, this home offers a large open concept Family Kitchen area, a cozy living room, and the flexibility to utilize the third bedroom as a den if desired. Additionally, a two-car attached garage provides convenient parking and storage options. Nestled on a beautifully positioned corner lot, this property is situated in a serene and peaceful neighborhood in Union City. The tranquil surroundings ensure a peaceful and enjoyable living experience for you and your loved ones. Should you have any inquiries or wish to schedule a tour, please do not hesitate to contact us.
Key facts
- New anderson windows
- Updated brick ranch
- New flooring
Tags
Neighborhood map
What this means for you Summary
Snapshot
- This is a 3-bed/1.5-bath single-family listed at $165k.
Deal economics
- At list price, monthly cash flow is $-93 ($-1k/yr) — negative.
- To cash-flow at today's rent, offer at most $148k (10.0% below list).
- To meet the 1% rule (rent ≥ 1% of price), the offer needs to be $120k (27.5% below list).
- Recommended offer: $120k (27.5% below list) — sets the bar for 1% rule.
Location & tenants
- Location reads 63/100 on livability (#432 in IN) — a middle-class / working-renter tenant base. Strengths: cost of living A+, housing A+, crime A-; Watch: health & safety C-, amenities F, commute F.
- Randolph Eastern School Corporation (town): math 29% / reading 31% proficiency, ranked #246 of 301 in IN (top 82%) — families likely to look elsewhere, expect single-tenant / working-renter base with shorter leases.
- Zoned schools: North Side Elementary School (math 46% / reading 27%, grade F, #571 of 994 statewide, top 58%, 561 students, 72% FRL); Union City Community Jr/Sr High (math 9% / reading 36%, grade F, #337 of 369 statewide, top 92%, 367 students, 67% FRL) — zoned schools average 70% FRL vs 54% district-wide (15 pts higher); higher-poverty schools than district average — tighter screening recommended.
- Market conditions: 36 active listings in the ZIP; 19 units permitted in Randolph County in 2024 (0 in 5+ unit buildings).
Forward outlook
- In year one you build about $18k of equity ($1k loan paydown + $16k appreciation (10.0% local appreciation)).
- Randolph County population projected at -26% by 2050 — secular population decline; favor cash flow + early exit over multi-decade hold.
- By year 3, paydown + projected appreciation supports a ~$45k cash-out refi (75% LTV) — recoverable capital for the next deal without selling this one.
Negotiation context
- Only 4 days on market — expect competitive offers; lowballing is unlikely to land.
- 3 sale attempts since 3y ago with the ask held roughly flat each time — persistent listings suggest the price (not the market) is what's stuck; bring a comps-based counter.
- Current owner paid $135k; 22% above their basis — modest negotiation headroom, anchor on the comps not their cost.
Questions for the listing agent
- What do current leases actually rent for vs. the listed asking? Can we see a recent rent roll and the last 12 months of T-12 income?
- Built in 1975 — when were the roof, HVAC, electrical panel, plumbing, and water heater last replaced?
- Is there a deadline driving the sale (1031 exchange, divorce, estate, relocation)? That informs how much negotiation room exists.
- Schools are D-rated, which usually means shorter tenancies and higher turnover. Who's the typical renter profile here, and what's been the actual vacancy rate?
- The area grade is low — what's the realistic commute time and amenity access for the typical tenant pool here? Any planned neighborhood developments (good or bad) we should know about?
- What's the average days-on-market for RENTAL listings here right now (not sales)? A rising rental-DOM trend means longer vacancies and softer asking-rent achievability than the comps imply.
- What's the recent tenant-quality profile in this submarket — average credit score on applications, eviction rate, late-payment / NSF rate, and stable-employment percentage? A property-management company in the area should have these aggregated.
- How much new for-sale + rental construction is in the pipeline within 1–3 miles? Heavy new supply typically softens prices + rents 12–24 months out; constrained supply supports both.
Investment metrics
- 1% rule
- 0.73% ✗
- Cap rate
- 5.61%
- Cash-on-cash
- -2.42%
- DSCR
- 0.89
- GRM
- 11.5
CMA / ARV
- ARV (on-the-fly)
- $164,488
- Comps found
- 6
Show comp detail 6 sales within ~0.75 mi
| Address | Dist | Beds/Ba | Sqft | Sold | Price | $/sf | Match |
|---|---|---|---|---|---|---|---|
| 600 Glynn Ellen Dr | 0.00mi | 3/1.5 | 1,418 (0%) | 0mo | $165,000 | $116 | 100 |
| 522 Royale Dr | 0.06mi | 3/1.5 | 1,304 (-8%) | 6mo | $137,100 | $105 | 79 |
| 1229 N Plum St | 0.20mi | 3/1.0 | 1,346 (-5%) | 6mo | $119,000 | $88 | 75 |
| 384 Chatham Ct | 0.34mi | 3/2.0 | 1,452 (+2%) | 9mo | $190,000 | $131 | 70 |
| 744 N Howard St | 0.66mi | 3/2.0 | 1,461 (+3%) | 2mo | $189,900 | $130 | 61 |
| 942 W Division St | 0.75mi | 3/1.0 | 1,474 (+4%) | 20mo | $140,000 | $95 | 40 |
Match score weights: distance 35% · size 25% · config 20% · recency 20%. Top-matched comps best support the ARV.
Projected returns pro-forma
10.0% appreciation · 3.0% rent growth · sell at horizon
- IRR
- 22.5%
- Equity multiple
- 2.82×
- Total profit
- $83,825
- Equity at exit
- $148,555
- IRR
- 20.2%
- Equity multiple
- 6.45×
- Total profit
- $251,432
- Equity at exit
- $320,364
Cash invested: $46,172 (down + closing). Projections, not guarantees.
Landlord ↔ Tenant lean methodology
- Overall (STATE)
- 90 Strongly Landlord-Friendly
- State Indiana
- 90 Strongly Landlord-Friendly · R+11
- County
- — inherits STATE
- City
- — inherits STATE
ZIP-level market 47390
- Home prices YoY
- 9.1%
- Active inventory
- 36
- Price-to-rent
- 11.5×
Monthly cashflow live
- Estimated rent
- $1,196 medium interval (Pro) →
- Mortgage (P&I)
- −$865
- Tax from tax record
- −$104 /mo · $1,254/yr
- Insurance
- −$69
- HOA
- −$0
- Vacancy / Maint / Mgmt
- −$251
- Net cashflow
- $-93
Break-even live
Sensitivity live
| Price | -10% $0 | -5% $-47 | +0% $-93 | +5% $-140 | +10% $-187 |
|---|---|---|---|---|---|
| Rent | -10% $-188 | -5% $-140 | +0% $-93 | +5% $-46 | +10% $1 |
| Rate | -1.0pp $-10 | -0.5pp $-51 | base $-93 | +0.5pp $-136 | +1.0pp $-179 |
UW: 25.0% down · 7.5% · 30yr · 1.5% tax · 5.0% vac · 8.0% maint · 8.0% mgmt
Financing live
Cash to close
- Down payment
- $41,225
- Closing costs
- $4,947
- Reserves months
- —
- Total cash needed
- —
Loan-product check · same deal, 3 products live
Conventional
25% down · 7.5% · 30yr
- Down + closing
- —
- Monthly P&I
- —
- Monthly cashflow
- —
- DSCR
- —
- Eligible?
- —
Personal DTI + credit; lowest rate.
DSCR
20% down · 8.5% · 30yr
- Down + closing
- —
- Monthly P&I
- —
- Monthly cashflow
- —
- DSCR
- —
- Eligible?
- —
No personal income docs; deal must DSCR.
Hard money
10% down · 12.0% · 12mo
- Down + closing
- —
- Monthly P&I
- —
- Monthly cashflow
- —
- DSCR
- —
- Eligible?
- —
Short-term bridge; refi at stabilization.
Listing history 8 events
-
2026-04-17status Pending
-
2026-04-13$164,900 Active
-
2023-08-18soldstatus $135,000 Closed 698-char remark
Show marketing remark (698 chars)
Introducing a charming and spacious Brick Ranch, boasting three bedrooms and one and a half baths. Spanning across 1418 square feet, this home offers a large open concept Family Kitchen area, a cozy living room, and the flexibility to utilize the third bedroom as a den if desired. Additionally, a two-car attached garage provides convenient parking and storage options. Nestled on a beautifully positioned corner lot, this property is situated in a serene and peaceful neighborhood in Union City. The tranquil surroundings ensure a peaceful and enjoyable living experience for you and your loved ones. Should you have any inquiries or wish to schedule a tour, please do not hesitate to contact us.
-
2023-08-18soldstatus $135,000 Sold 698-char remark
Show marketing remark (698 chars)
Introducing a charming and spacious Brick Ranch, boasting three bedrooms and one and a half baths. Spanning across 1418 square feet, this home offers a large open concept Family Kitchen area, a cozy living room, and the flexibility to utilize the third bedroom as a den if desired. Additionally, a two-car attached garage provides convenient parking and storage options. Nestled on a beautifully positioned corner lot, this property is situated in a serene and peaceful neighborhood in Union City. The tranquil surroundings ensure a peaceful and enjoyable living experience for you and your loved ones. Should you have any inquiries or wish to schedule a tour, please do not hesitate to contact us.
-
2023-08-18soldstatus $135,000 698-char remark
Show marketing remark (698 chars)
Introducing a charming and spacious Brick Ranch, boasting three bedrooms and one and a half baths. Spanning across 1418 square feet, this home offers a large open concept Family Kitchen area, a cozy living room, and the flexibility to utilize the third bedroom as a den if desired. Additionally, a two-car attached garage provides convenient parking and storage options. Nestled on a beautifully positioned corner lot, this property is situated in a serene and peaceful neighborhood in Union City. The tranquil surroundings ensure a peaceful and enjoyable living experience for you and your loved ones. Should you have any inquiries or wish to schedule a tour, please do not hesitate to contact us.
-
2023-07-20historical Active/Pending 698-char remark
Show marketing remark (698 chars)
Introducing a charming and spacious Brick Ranch, boasting three bedrooms and one and a half baths. Spanning across 1418 square feet, this home offers a large open concept Family Kitchen area, a cozy living room, and the flexibility to utilize the third bedroom as a den if desired. Additionally, a two-car attached garage provides convenient parking and storage options. Nestled on a beautifully positioned corner lot, this property is situated in a serene and peaceful neighborhood in Union City. The tranquil surroundings ensure a peaceful and enjoyable living experience for you and your loved ones. Should you have any inquiries or wish to schedule a tour, please do not hesitate to contact us.
-
2023-07-18$137,900 Active 698-char remark
Show marketing remark (698 chars)
Introducing a charming and spacious Brick Ranch, boasting three bedrooms and one and a half baths. Spanning across 1418 square feet, this home offers a large open concept Family Kitchen area, a cozy living room, and the flexibility to utilize the third bedroom as a den if desired. Additionally, a two-car attached garage provides convenient parking and storage options. Nestled on a beautifully positioned corner lot, this property is situated in a serene and peaceful neighborhood in Union City. The tranquil surroundings ensure a peaceful and enjoyable living experience for you and your loved ones. Should you have any inquiries or wish to schedule a tour, please do not hesitate to contact us.
-
2023-07-18$137,900 698-char remark
Show marketing remark (698 chars)
Introducing a charming and spacious Brick Ranch, boasting three bedrooms and one and a half baths. Spanning across 1418 square feet, this home offers a large open concept Family Kitchen area, a cozy living room, and the flexibility to utilize the third bedroom as a den if desired. Additionally, a two-car attached garage provides convenient parking and storage options. Nestled on a beautifully positioned corner lot, this property is situated in a serene and peaceful neighborhood in Union City. The tranquil surroundings ensure a peaceful and enjoyable living experience for you and your loved ones. Should you have any inquiries or wish to schedule a tour, please do not hesitate to contact us.
ⓘ Source: listings_history table (triggers on properties + properties_extension) + one-shot
backfill from property_details.listing_events for pre-trigger history.
Tax reassessment forecast IN · Partial reset (capped growth)
- Current annual tax
- $1,254 · $104/mo
- Projected year-2 tax
- $1,328 · $111/mo
- Expected delta
- +$74/yr (+$6/mo · 5.9%)
ⓘ Screening estimate from a state-policy table — verify with the county assessor before closing.
Climate risk First Street
- Flood 1/10 Low FEMA zone X (unshaded) · 0% chance over 30 yrs
- Wildfire 1/10 Low
- Heat 3/10 Moderate 7 d/yr ≥100°F today · 18 d/yr by 30 yrs out
- Wind 2/10 Low 100% chance of damaging wind over 30 yrs
- Air quality 3/10 Moderate 2 unhealthy d/yr today · 3 by 30 yrs out
Nearby sold comps map
Loading sold comps map…
Walkable amenities ~0.75 mi
Loading nearby amenities…
Taxation est. · year 1
- Rental income
- $14,349
- − Mortgage interest
- −$9,237
- − Property taxes
- −$1,254
- − Insurance
- −$824
- − Repairs & maintenance
- −$1,148
- − Management
- −$1,148
- − Depreciation
- −$4,797
- Taxable loss
- −$4,059
- Est. tax savings @ 24.0%
- +$974
- After-tax cash flow
- $-145/yr
For passive investors: Depreciation is non-cash, so a rental often shows a tax loss while cash-flowing — sheltering income. Rental losses are passive: they offset passive income freely, and up to $25,000/yr can offset ordinary (W-2) income if you actively participate and your MAGI is under $100k (phasing out to $0 by $150k); unused losses carry forward. On sale, claimed depreciation is recaptured at up to 25%, and gains may owe capital-gains tax (a 1031 exchange can defer both). Figures are a year-1 estimate at your 24.0% rate — not tax advice; consult a CPA.
Schools (NCES district)
- District
- Randolph Eastern School Corporation
- NCES district ID
- 1803180
- Math proficiency
- 29% ▼ -15.00%
- Reading proficiency
- 31% ▼ -15.00%
- Median HH income
- $36,652
- Composite
- 24.92/100
- National rank
- #7570
- State rank
- #246 of 301 in IN
Livability — Union City
- Score
- 63/100
- State rank
- #432
- US rank
- #15530
Category grades
Schools grade is shown separately in the Schools card above.
Census & demographics
- Census place
- Union City, IN
- Population (ZIP)
- 5,084
Population outlook (Randolph County) Hauer SSP2
- Today (2025)
- 22,998 people
- By 2030
- 21,815 · -5.1%
- By 2040
- 19,360 · -15.8%
- By 2050
- 17,010 · -26.0%
- By 2075
- 12,491 · -45.7%
- By 2100
- 8,986 · -60.9%
Race, ethnicity, and origin ACS 2023
- Neighborhood character
- Predominantly White (79%)
- Race & ethnicity
- White 79% Hispanic / Latino 15% Two or more races 9% Black 3%
- Hispanic origin (detail)
- Mexican 10%
- Common ancestry
- Romanian 3% Portuguese 2% Italian 1%
- Foreign-born
- 6% · Canada, South Korea, Guatemala
- Languages at home
- 88% English-only · Spanish 10% Korean 1% Other Indo-European 1%
Political lean MEDSL · Randolph
- 2024 margin
- Solid R (+53.7) · D 22.3% · R 75.9% · Other 1.8%
- 2008→2024 swing
- -44.9pp toward R · 2008: -8.8pp · 2024: -53.7pp
- All cycles
- 2024: R+53.7 2020: R+52.4 2016: R+48.5 2012: R+24.1 2008: R+8.8
Not yet ingested
- Civics
- —
Market trends
- HPI YoY
- ▲ 22.82%
- Current HPI
- 273.6736
- Rent YoY
- —
- Metro
- —
- State GDP YoY
- ▲ 2.90%
- F500 in state
- 18
Industry mix (Fortune 500 HQ in IN)
| Industry | F500 HQs | Revenue |
|---|---|---|
| Industrial Machinery | 2 | $37B |
|
||
| Healthcare | 1 | $177B |
|
||
| Pharmaceuticals | 1 | $45B |
|
||
| Metals / Steel | 1 | $18B |
|
||
| Agriculture | 1 | $17B |
|
||
| Packaging | 1 | $12B |
|
||
Price history
+19.6% since first listed8 events — show timeline
- 2026-04-17 Pending — RRELMS
- 2026-04-13 Listed $164,900 RRELMS
- 2023-08-18 Sold (MLS) $135,000 RRELMS
- 2023-08-18 Sold (MLS) $135,000 Dayton MLS
- 2023-08-18 Sold (MLS) $135,000 Dayton MLS
- 2023-07-20 Contingent — Dayton MLS
- 2023-07-18 Listed $137,900 RRELMS
- 2023-07-18 Listed $137,900 Dayton MLS
Property tax history
+17.6%/yrLatest (2024): $1,254 · +340.2% YoY. Source: county tax records.
Cash-flow waterfall
monthlySold comps — $/sqft
last 12 mo · ≤1 miLoading sold comps…