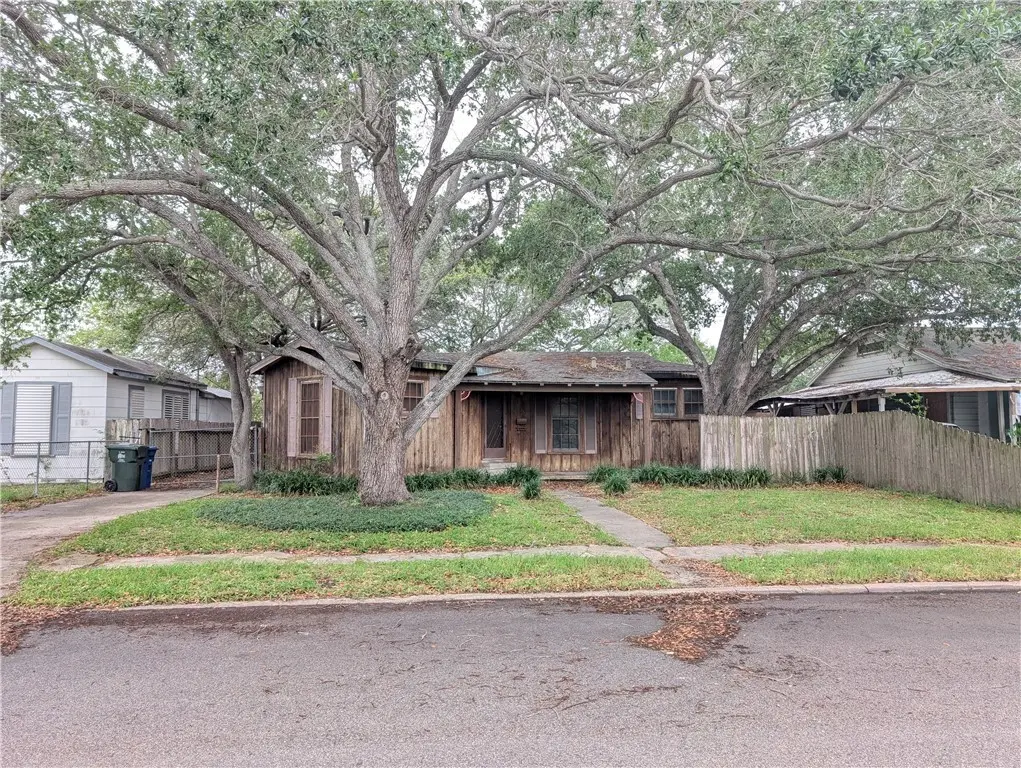
225 Glendale Dr · Corpus Christi, TX
Flood risk 5/10 · Moderate
- FEMA flood zone
- X (unshaded)
- Chance of flooding over 30 yrs
- 0.47%
- Est. flood insurance / yr
- $507 – $1,088
Fire risk 1/10 · Minimal
- Est. fire insurance / yr
- $1,222 – $2,270
Heat risk 10/10 · Severe
- Hot days now (above 107°F)
- 7 days/yr
- Hot days in 30 yrs
- 26 days/yr
Wind risk 9/10 · Severe
- Chance of severe wind over 30 yrs
- 99.0%
Air-quality risk 1/10 · Minimal
- Unhealthy air days now
- 0 days/yr
- Unhealthy air days in 30 yrs
- 0 days/yr
Risk factors via First Street. Map © Google.
Why this score? — see what drove the B- grade
The composite is a weighted blend of 9 inputs, each scored 0–100. Each bar is that input's sub-score; the figure is the points it added to the 100-point composite (weight × sub-score).
- Cash flow +25.6/30.0
- ARV discount +15.0/15.0
- DSCR +8.5/10.0
- 1% rule +7.0/10.0
- Livability +3.9/5.0
- Rent growth +3.0/5.0
- Schools +2.8/10.0
- Condition / age +2.5/5.0
- Appreciation +0.0/10.0
$129,200
🖨 Deal sheet (PDF) 📄 Offer letter ✓ Due diligence
Listing remarks MLS
Investment opportunity alert Priced to move and ready for its next owner. This property is perfect for investors looking to add to their portfolio or secure a solid flip or rental. With a motivated, but firm seller, some potential here to negotiate and maximize your return. Bring your vision, run your numbers, and don’t miss the chance to turn this one into your next win.
Key facts
- 7,375 sq ft lot
- Built 1938
- Listed 62 days
Neighborhood map
What this means for you Summary
Snapshot
- This is a 3-bed/2.0-bath single-family listed at $129k.
Deal economics
- At list price, monthly cash flow is $304 ($4k/yr) — positive.
- The deal already cash-flows at list — no discount required.
- Meets the 1% rule at list price ($2k rent vs $129k).
- Recommended offer: $121k (6.0% below list) — sets the bar for market timing.
- Cap rate 9.1% vs local median 3.6% in Corpus Christi — top-decile yield for the area; either an underpriced asset or a hidden risk that comps aren't pricing in. Stress-test before assuming the spread holds.
Location & tenants
- Location reads 78/100 on livability (#66 in TX, #2,404 nationally) — a middle-class / working-renter tenant base. Strengths: commute A+, cost of living A+, housing A+; Watch: crime F.
- Corpus Christi ISD (urban): math 31% / reading 35% proficiency, ranked #562 of 826 in TX (top 68%) — families likely to look elsewhere, expect single-tenant / working-renter base with shorter leases; 63% free/reduced lunch — lower-income household profile, screen leases tightly.
- Zoned schools: Windsor Park G/T (math 85% / reading 90%, grade A+, #6 of 4,322 statewide, top 0%, 609 students, 29% FRL); Adkins Middle (math 40% / reading 39%, grade F, #660 of 1,662 statewide, top 41%, 956 students, 48% FRL); Ray H S (math 49% / reading 47%, grade D, #571 of 1,632 statewide, top 36%, 1,640 students, 69% FRL).
- Zoned-school proficiency averages 58% at this address vs 33% district-wide (+25 pts) — the actual schools serving this property are materially stronger than the Corpus Christi ISD average implies; a family-tenant draw the district grade alone would hide.
- Market conditions: Rents rising (+1.9%/yr); 146 active listings in the ZIP; 35 comparable units currently listed for rent nearby; rentals at typical pace (median 24d on market — plan ~3-4 weeks tenant-placement turnaround); 49% of comp listings sitting > 30 days — soft ceiling on asking rent; 1,397 units permitted in Nueces County in 2024 (47 in 5+ unit buildings).
- This rent runs 30% of the median local income ($61k/yr) — at the standard rent-burdened threshold; future hikes will face affordability resistance.
Forward outlook
- Local home prices are declining (-3.0%/yr); year-one equity from $893 of loan paydown is wiped out by about $4k of value loss. Plan a longer hold.
- Nueces County population projected at +36% by 2050 — long-run rental-demand tailwind backs the buy-and-hold thesis.
Negotiation context
- It's been on market 62 days — a 6% lower offer ($121k) is reasonable based on typical stale-listing flexibility.
- 2 sale attempts since 2y ago; this cycle's ask has dropped $7k (5%) from the opening price — seller is motivated, your offer sets the floor, not the list.
Risks & watch-outs
- Watch-outs: built in 1938 — expect roof / HVAC / electrical / plumbing capex.
- Climate carrying-cost: moderate flood risk; severe wind risk, 99% chance of damaging wind over 30y; extreme-heat days projected 7→26/yr by 2055 (HVAC capex compounding) — expect insurance premiums to compound above CPI over the hold.
Questions for the listing agent
- It's been on market 62 days. Have you received any prior offers? Is the seller open to a 6% concession, seller financing, or rate buy-down credit?
- Built in 1938 — when were the roof, HVAC, electrical panel, plumbing, and water heater last replaced?
- Why hasn't it sold? Are there any deal-killer items the seller is aware of (foundation, flood, title, zoning, code violations)?
- Is there a deadline driving the sale (1031 exchange, divorce, estate, relocation)? That informs how much negotiation room exists.
- Crime grade is F in this area — have there been break-ins, vandalism, or insurance claims at this property in the last 3 years? What carrier currently insures it and at what premium?
- What's the average days-on-market for RENTAL listings here right now (not sales)? A rising rental-DOM trend means longer vacancies and softer asking-rent achievability than the comps imply.
- What's the recent tenant-quality profile in this submarket — average credit score on applications, eviction rate, late-payment / NSF rate, and stable-employment percentage? A property-management company in the area should have these aggregated.
- How much new for-sale + rental construction is in the pipeline within 1–3 miles? Heavy new supply typically softens prices + rents 12–24 months out; constrained supply supports both.
Investment metrics
- 1% rule
- 1.20% ✓
- Cap rate
- 9.11%
- Cash-on-cash
- 10.08%
- DSCR
- 1.45
- GRM
- 6.9
CMA / ARV
- ARV (median comp)
- $172,162
- List price
- $129,200
- Delta
- -24.95%
- Verdict
- UNDERPRICED
- Comps
- 20 within 1.0 mi
Show comp detail 12 sales within ~0.75 mi
| Address | Dist | Beds/Ba | Sqft | Sold | Price | $/sf | Match |
|---|---|---|---|---|---|---|---|
| 1725 15th St | 0.27mi | 3/2.5 | 1,447 (-1%) | 2mo | $190,000 | $131 | 83 |
| 2502 Lynch St | 0.41mi | 3/2.0 | 1,425 (-2%) | 3mo | $235,000 | $165 | 74 |
| 641 Naples St | 0.25mi | 2/2.0 (-1) | 1,376 (-6%) | 4mo | $205,000 | $149 | 71 |
| 702 Texas Ave | 0.49mi | 3/2.0 | 1,514 (+4%) | 2mo | $239,900 | $158 | 69 |
| 1113 Annapolis Dr | 0.54mi | 3/2.0 | 1,518 (+4%) | 4mo | $224,900 | $148 | 64 |
| 1201 Devon Dr | 0.71mi | 3/2.0 | 1,497 (+3%) | 1mo | $209,500 | $140 | 62 |
| 636 Texas Ave | 0.51mi | 3/2.0 | 1,342 (-8%) | 4mo | $149,900 | $112 | 60 |
| 634 Sorrell St | 0.69mi | 3/2.0 | 1,552 (+6%) | 1mo | $237,500 | $153 | 57 |
| 1652 16th St | 0.33mi | 4/2.0 (+1) | 1,260 (-14%) | 2mo | $170,000 | $135 | 55 |
| 2810 Topeka St | 0.72mi | 3/2.0 | 1,395 (-4%) | 5mo | $199,900 | $143 | 55 |
| 622 Atlantic St | 0.30mi | 2/1.0 (-1) | 1,260 (-14%) | 2mo | $110,000 | $87 | 52 |
| 1541 Clodah Dr | 0.44mi | 3/1.5 | 1,255 (-14%) | 6mo | $178,000 | $142 | 50 |
Match score weights: distance 35% · size 25% · config 20% · recency 20%. Top-matched comps best support the ARV.
Projected returns pro-forma
-3.0% appreciation · 1.87% rent growth · sell at horizon
- IRR
- -2.4%
- Equity multiple
- 0.91×
- Total profit
- $-3,294
- Equity at exit
- $19,264
- IRR
- 6.0%
- Equity multiple
- 1.42×
- Total profit
- $15,208
- Equity at exit
- $11,171
Cash invested: $36,176 (down + closing). Projections, not guarantees.
Landlord ↔ Tenant lean methodology
- Overall (STATE)
- 87 Strongly Landlord-Friendly
- State Texas
- 87 Strongly Landlord-Friendly · R+5
- County
- — inherits STATE
- City
- — inherits STATE
ZIP-level market 78404
- Rents YoY
- 1.9%
- Active inventory
- 146
- Price-to-rent
- 6.9×
Monthly cashflow live
- Estimated rent
- $1,554 high interval (Pro) →
- Mortgage (P&I)
- −$678
- Tax from tax record
- −$193 /mo · $2,313/yr
- Insurance
- −$54
- HOA
- −$0
- Lot rent
- −$0
- Vacancy / Maint / Mgmt
- −$326
- Net cashflow
- $304
Break-even live
Sensitivity live
| Price | -10% $377 | -5% $340 | +0% $304 | +5% $267 | +10% $231 |
|---|---|---|---|---|---|
| Rent | -10% $181 | -5% $242 | +0% $304 | +5% $365 | +10% $427 |
| Rate | -1.0pp $369 | -0.5pp $337 | base $304 | +0.5pp $270 | +1.0pp $236 |
UW: 25.0% down · 7.5% · 30yr · 1.5% tax · 5.0% vac · 8.0% maint · 8.0% mgmt
Financing live
Cash to close
- Down payment
- $32,300
- Closing costs
- $3,876
- Reserves months
- —
- Total cash needed
- —
Loan-product check · same deal, 3 products live
Conventional
25% down · 7.5% · 30yr
- Down + closing
- —
- Monthly P&I
- —
- Monthly cashflow
- —
- DSCR
- —
- Eligible?
- —
Personal DTI + credit; lowest rate.
DSCR
20% down · 8.5% · 30yr
- Down + closing
- —
- Monthly P&I
- —
- Monthly cashflow
- —
- DSCR
- —
- Eligible?
- —
No personal income docs; deal must DSCR.
Hard money
10% down · 12.0% · 12mo
- Down + closing
- —
- Monthly P&I
- —
- Monthly cashflow
- —
- DSCR
- —
- Eligible?
- —
Short-term bridge; refi at stabilization.
Rent comps 35 comps
| Address | Beds | Baths | Sqft | Rent | $/sqft | DOM | Units | Dist |
|---|---|---|---|---|---|---|---|---|
| 1802 16th St Unit B Corpus Christi, TX | 3.0 | 1.0 | 1575 | $1,000 | $0.63 | 46d | 1 | 0.20mi |
| 1628 18th St Corpus Christi, TX | 2.0 | 1.0 | 1112 | $1,000 | $0.90 | 46d | 1 | 0.32mi |
| 1201 York Ave Corpus Christi, TX | 3.0 | 1.0 | 888 | $1,550 | $1.75 | 23d | 1 | 0.40mi |
| 2622 Cloyde St Corpus Christi, TX | 2.0 | 1.0 | 1693 | $1,150 | $0.68 | 46d | 1 | 0.41mi |
| 1634 14th St Corpus Christi, TX | 2.0 | 1.5 | 980 | $1,090 | $1.11 | 46d | 1 | 0.41mi |
| 1525 S 19th St Unit B Corpus Christi, TX | 3.0 | 2.0 | 1062 | $2,100 | $1.98 | 16d | 1 | 0.46mi |
| 1722 Trenton Dr Corpus Christi, TX | 4.0 | 2.0 | 1432 | $2,100 | $1.47 | 16d | 1 | 0.52mi |
| 455 Louisiana Ave Corpus Christi, TX | 2.0 | 1.0 | 1528 | $3,000 | $1.96 | 23d | 1 | 0.60mi |
| 426 Palmero St Corpus Christi, TX | 3.0 | 2.0 | 1720 | $1,350 | $0.78 | 46d | 1 | 0.62mi |
| 200 Clemmer St Unit A Corpus Christi, TX | 3.0 | 1.0 | 950 | $1,199 | $1.26 | 46d | 1 | 0.66mi |
| 443 Indiana Ave Corpus Christi, TX | 2.0 | 1.0 | 968 | $1,650 | $1.70 | 46d | 1 | 0.69mi |
| 225 Watson St Corpus Christi, TX | 3.0 | 1.0 | 1472 | $1,295 | $0.88 | 46d | 1 | 0.75mi |
| 2522 Cleo St Corpus Christi, TX | 3.0 | 1.0 | 992 | $1,350 | $1.36 | 16d | 1 | 0.87mi |
| 332 Rosebud Ave Corpus Christi, TX | 2.0 | 1.0 | 942 | $1,150 | $1.22 | 23d | 1 | 0.87mi |
| 1318 6th St Corpus Christi, TX | 2.0 | 1.0 | 900 | $900 | $1.00 | 16d | 1 | 0.88mi |
| 1405 Annapolis Dr Corpus Christi, TX | 3.0 | 1.5 | 1502 | $2,000 | $1.33 | 16d | 1 | 0.88mi |
| 309 Rosebud Ave Unit D Corpus Christi, TX | 2.0 | 1.0 | 882 | $1,100 | $1.25 | 23d | 1 | 0.93mi |
| 2402 Segrest St Corpus Christi, TX | 2.0 | 1.0 | 1120 | $825 | $0.74 | 23d | 1 | 0.95mi |
| 1107 14th St Corpus Christi, TX | 4.0 | 1.5 | 1520 | $1,300 | $0.86 | 46d | 1 | 0.95mi |
| 2837 Santa Fe St Unit 2 Corpus Christi, TX | 2.0 | 1.0 | 1030 | $1,300 | $1.26 | 16d | 1 | 0.95mi |
| 1446 Annapolis Dr Corpus Christi, TX | 3.0 | 2.0 | 1500 | $1,700 | $1.13 | 46d | 1 | 0.99mi |
| 1522 Cambridge Dr Corpus Christi, TX | 3.0 | 1.5 | 1278 | $1,600 | $1.25 | 46d | 1 | 1.12mi |
| 826 Hancock Ave Unit 2 Corpus Christi, TX | 2.0 | 1.0 | 1000 | $950 | $0.95 | 23d | 1 | 1.14mi |
| 1117 Ocean Dr Unit B Corpus Christi, TX | 2.0 | 1.0 | 1543 | $3,000 | $1.94 | 46d | 1 | 1.17mi |
| 801 S Alameda St Unit A Corpus Christi, TX | 2.0 | 1.0 | 1760 | $900 | $0.51 | 46d | 1 | 1.18mi |
| 813 Furman Ave Apt 1 Corpus Christi, TX | 3.0 | 2.0 | 1430 | $1,475 | $1.03 | 16d | 1 | 1.19mi |
| 522 Hancock Ave Unit 1-319 Corpus Christi, TX | 2.0 | 2.0 | 1133 | $1,625 | $1.43 | 23d | 1 | 1.24mi |
| 616 16th St Unit A Corpus Christi, TX | 3.0 | 1.0 | 1040 | $1,050 | $1.01 | 46d | 1 | 1.24mi |
| 522 Hancock Ave Corpus Christi, TX | 1.0–2.0 | 1.0–2.0 | 915 | $2,000 | $2.18 | 16d | 10 | 1.26mi |
| 3102 Santa Fe St Corpus Christi, TX | 1.0–2.0 | 1.0–2.0 | 922 | $1,095 | $1.19 | 46d | 1 | 1.27mi |
| 823 S Water St Corpus Christi, TX | 2.0 | 2.0 | 1243 | $2,000 | $1.61 | 16d | 1 | 1.32mi |
| 802 S Carancahua St Corpus Christi, TX | 2.0 | 1.0–2.0 | 869 | $1,770 | $2.04 | 16d | 68 | 1.33mi |
| 4005 Green Grove Dr Corpus Christi, TX | 3.0 | 2.0 | 1406 | $1,695 | $1.21 | 46d | 1 | 1.38mi |
| 3314 Casa de Palmas Dr Corpus Christi, TX | 3.0 | 2.0 | 1869 | $2,300 | $1.23 | 16d | 1 | 1.39mi |
| 1837 Horne Rd Corpus Christi, TX | 3.0 | 2.0 | 1226 | $1,800 | $1.47 | 46d | 1 | 1.48mi |
Listing history 17 events
-
2026-06-14days on market $129,200 Active 62 DOM
-
2026-06-10days on market $129,200 Active 59 DOM
-
2026-06-09days on market $129,200 Active 58 DOM
-
2026-06-08days on market $129,200 Active 57 DOM
-
2026-06-07days on market $129,200 Active 56 DOM
-
2026-06-05days on market $129,200 Active 53 DOM
-
2026-06-03days on market $129,200 Active 52 DOM
-
2026-06-02days on market $129,200 Active 51 DOM
-
2026-06-01days on market $129,200 Active 50 DOM
-
2026-05-31days on market $129,200 Active 49 DOM
-
2026-05-30days on market $129,200 Active 48 DOM
-
2026-05-08price $129,200 384-char remark
Show marketing remark (384 chars)
Investment opportunity alert Priced to move and ready for its next owner. This property is perfect for investors looking to add to their portfolio or secure a solid flip or rental. With a motivated, but firm seller, some potential here to negotiate and maximize your return. Bring your vision, run your numbers, and don’t miss the chance to turn this one into your next win.
-
2026-04-12$136,200 Active 384-char remark
Show marketing remark (384 chars)
Investment opportunity alert Priced to move and ready for its next owner. This property is perfect for investors looking to add to their portfolio or secure a solid flip or rental. With a motivated, but firm seller, some potential here to negotiate and maximize your return. Bring your vision, run your numbers, and don’t miss the chance to turn this one into your next win.
-
2024-04-02soldstatus
-
2024-03-28soldstatus Closed 755-char remark
Show marketing remark (755 chars)
Nestled within a stand of mature oaks, the sunlight filters down to kiss this 1930's diamond in the rough, just waiting for you to take her and make her into a real jewel! Three bedrooms; two full baths; living room, dining room & kitchen. The old wood used in her construction is something to be appreciated and conserved, and she has some darling built-in's. The lot is deep and backs to Baldwin across the street from Del Mar's Heritage Campus. The lot has a long drive down the left side, which leads to a two car carport AND two car garage! Near the intersection of Staples & Baldwin, it's an easy commute to downtown employers, several hospitals & schools; not to mention the new bistro, bakeries and craft butcher on down Staples!
-
2024-03-11status Pending 755-char remark
Show marketing remark (755 chars)
Nestled within a stand of mature oaks, the sunlight filters down to kiss this 1930's diamond in the rough, just waiting for you to take her and make her into a real jewel! Three bedrooms; two full baths; living room, dining room & kitchen. The old wood used in her construction is something to be appreciated and conserved, and she has some darling built-in's. The lot is deep and backs to Baldwin across the street from Del Mar's Heritage Campus. The lot has a long drive down the left side, which leads to a two car carport AND two car garage! Near the intersection of Staples & Baldwin, it's an easy commute to downtown employers, several hospitals & schools; not to mention the new bistro, bakeries and craft butcher on down Staples!
-
2024-03-06$125,000 Active 755-char remark
Show marketing remark (755 chars)
Nestled within a stand of mature oaks, the sunlight filters down to kiss this 1930's diamond in the rough, just waiting for you to take her and make her into a real jewel! Three bedrooms; two full baths; living room, dining room & kitchen. The old wood used in her construction is something to be appreciated and conserved, and she has some darling built-in's. The lot is deep and backs to Baldwin across the street from Del Mar's Heritage Campus. The lot has a long drive down the left side, which leads to a two car carport AND two car garage! Near the intersection of Staples & Baldwin, it's an easy commute to downtown employers, several hospitals & schools; not to mention the new bistro, bakeries and craft butcher on down Staples!
ⓘ Source: listings_history table (triggers on properties + properties_extension) + one-shot
backfill from property_details.listing_events for pre-trigger history.
Tax reassessment forecast TX · Resets to sale price
- Current annual tax
- $2,313 · $193/mo
- Projected year-2 tax
- $2,364 · $197/mo
- Expected delta
- +$52/yr (+$4/mo · 2.2%)
ⓘ Screening estimate from a state-policy table — verify with the county assessor before closing.
Climate risk First Street
- Flood 5/10 Major FEMA zone X (unshaded) · 47% chance over 30 yrs
- Wildfire 1/10 Low
- Heat 10/10 Extreme 7 d/yr ≥107°F today · 26 d/yr by 30 yrs out
- Wind 9/10 Extreme 99% chance of damaging wind over 30 yrs
- Air quality 1/10 Low 0 unhealthy d/yr today · 0 by 30 yrs out
Nearby sold comps map
Loading sold comps map…
Walkable amenities ~0.75 mi
Loading nearby amenities…
Taxation est. · year 1
- Rental income
- $18,651
- − Mortgage interest
- −$7,237
- − Property taxes
- −$2,313
- − Insurance
- −$646
- − Repairs & maintenance
- −$1,492
- − Management
- −$1,492
- − Depreciation
- −$3,759
- Taxable income
- $1,713
- Est. tax owed @ 24.0%
- −$411
- After-tax cash flow
- $3,234/yr
For passive investors: Depreciation is non-cash, so a rental often shows a tax loss while cash-flowing — sheltering income. Rental losses are passive: they offset passive income freely, and up to $25,000/yr can offset ordinary (W-2) income if you actively participate and your MAGI is under $100k (phasing out to $0 by $150k); unused losses carry forward. On sale, claimed depreciation is recaptured at up to 25%, and gains may owe capital-gains tax (a 1031 exchange can defer both). Figures are a year-1 estimate at your 24.0% rate — not tax advice; consult a CPA.
Schools (NCES district)
- District
- Corpus Christi ISD
- NCES district ID
- 4815270
- Math proficiency
- 31% ▼ -18.00%
- Reading proficiency
- 35% ▼ -7.00%
- Median HH income
- $45,672
- Composite
- 28.27/100
- National rank
- #6793
- State rank
- #562 of 826 in TX
Livability — Corpus Christi
- Score
- 78/100
- State rank
- #66
- US rank
- #2404
Category grades
Schools grade is shown separately in the Schools card above.
Census & demographics
- Census place
- Corpus Christi, TX
- County
- Nueces County · 296,836 people
- City population
- 296,836
- Metro
- Corpus Christi, TX
- Population (ZIP)
- 12,635
- Household income
- $61,280
- Rent vs Own
- Severe rent burden
- 596.0
Population outlook (Nueces County) Hauer SSP2
- Today (2025)
- 418,037 people
- By 2030
- 447,123 · +7.0%
- By 2040
- 505,911 · +21.0%
- By 2050
- 567,522 · +35.8%
- By 2075
- 729,686 · +74.6%
- By 2100
- 847,087 · +102.6%
Race, ethnicity, and origin ACS 2023
- Neighborhood character
- Majority Hispanic (62%)
- Race & ethnicity
- Hispanic / Latino 62% White 32% Two or more races 29% Black 4%
- Hispanic origin (detail)
- Mexican 56%
- Common ancestry
- Slovak 3% Italian 2% Lithuanian 1%
- Foreign-born
- 9% · Canada
- Languages at home
- 61% English-only · Spanish 39%
Political lean MEDSL · Nueces
- 2024 margin
- R (+11.5) · D 43.8% · R 55.3%
- 2008→2024 swing
- -7.1pp toward R · 2008: -4.4pp · 2024: -11.5pp
- All cycles
- 2024: R+11.5 2020: R+2.9 2016: R+1.5 2012: R+3.2 2008: R+4.4
Not yet ingested
- Civics
- —
Market trends
- HPI YoY
- ▼ -211.10%
- Current HPI
- 177.4759
- Rent YoY
- ▲ 1.87%
- Metro
- Corpus Christi, TX
- State GDP YoY
- ▲ 3.95%
- F500 in state
- 110
Industry mix (Fortune 500 HQ in TX)
| Industry | F500 HQs | Revenue |
|---|---|---|
| Energy | 16 | $1,198B |
|
||
| Technology | 5 | $198B |
|
||
| Engineering / Construction | 4 | $72B |
|
||
| Energy Services | 3 | $60B |
|
||
| Utilities | 3 | $41B |
|
||
| Healthcare | 2 | $330B |
|
||
Price history
+3.4% since first listed6 events — show timeline
- 2026-05-08 Price Changed $129,200 CBMLS
- 2026-04-12 Listed $136,200 CBMLS
- 2024-04-02 Sold (Public Records) — Public Records
- 2024-03-28 Sold (MLS) — CBMLS
- 2024-03-11 Pending — CBMLS
- 2024-03-06 Listed $125,000 CBMLS
Property tax history
+2.3%/yrLatest (2025): $2,313 · -21.4% YoY. Source: county tax records.
Cash-flow waterfall
monthlySold comps — $/sqft
last 12 mo · ≤1 miLoading sold comps…