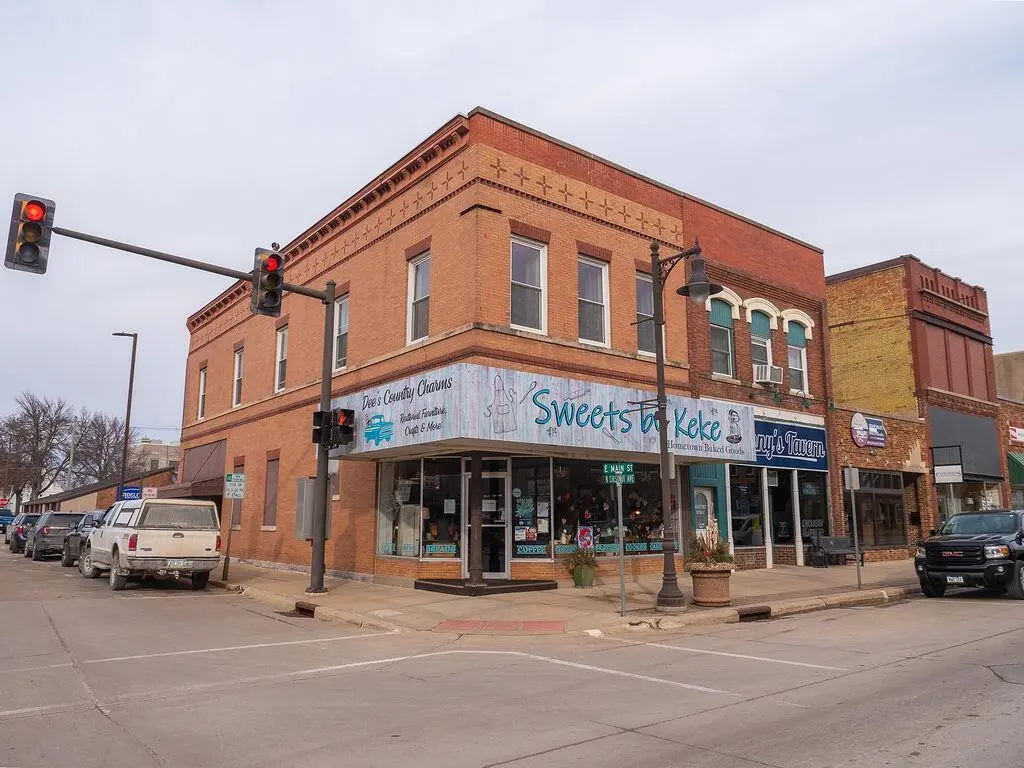
2 E Main St · New Hampton, IA
Flood risk No data
- FEMA flood zone
- —
- Chance of flooding over 30 yrs
- —
- Est. flood insurance / yr
- —
Fire risk No data
- Est. fire insurance / yr
- —
Heat risk No data
- Hot days now (above threshold)
- —
- Hot days in 30 yrs
- —
Wind risk No data
- Chance of severe wind over 30 yrs
- —
Air-quality risk No data
- Unhealthy air days now
- —
- Unhealthy air days in 30 yrs
- —
Risk factors via First Street. Map © Google.
Why this score? — see what drove the C- grade
The composite is a weighted blend of 9 inputs, each scored 0–100. Each bar is that input's sub-score; the figure is the points it added to the 100-point composite (weight × sub-score).
- ARV discount +15.0/15.0
- Appreciation +10.0/10.0
- Cash flow +7.7/30.0
- Schools +6.3/10.0
- Livability +3.9/5.0
- Rent growth +2.5/5.0
- Condition / age +2.5/5.0
- 1% rule +2.3/10.0
- DSCR +1.8/10.0
$135,000
🖨 Deal sheet (PDF) 📄 Offer letter ✓ Due diligence
Listing remarks
Live upstairs and let your investment work for you in this updated brick building on Main Street in New Hampton, Iowa. Renovated in 2021-2022, the property features a modern 1-bed, 1-bath apartment above with room to expand into 2 bedrooms -perfect for owner occupancy - while the main level offers a fully equipped commercial kitchen and flexible space with three separate entrances, ideal for rental income from a restaurant, cafe, bakery, or other business. Call today to learn more!
Key facts
- Flexible space
- Modern apartment
- 1,742 sq ft lot
Tags
Property features AI
Exterior
- Parking: 1 parking space
- Utilities: Municipal water; Municipal sewer; LP gas
- Home design: Two-story single-family home; Zoned RES/COMM; Less than 1/2 acre lot
- Construction: Estimated living area range: 2,501+ to 3,001–3,500 (estimate)
- Exterior features: Brick and brick/stone exterior
Interior
- Kitchen: Kitchen (Upper) — 15 x 10; Range; Refrigerator; Pantry (kitchen)
- Bedrooms: Master bedroom (Upper) — 12 x 12
- Bathrooms: 3 full bathrooms
- Heating & cooling: Forced air heating; Central air; LP gas fuel
- Interior features: High speed internet available; Pantry; Full basement
- Laundry & utility: Washer; Dryer
Neighborhood map
What this means for you Summary
Snapshot
- This is a 1-bed/3.0-bath single-family listed at $135k.
Deal economics
- At list price, monthly cash flow is $-154 ($-2k/yr) — negative.
- To cash-flow at today's rent, offer at most $113k (16.5% below list).
- To meet the 1% rule (rent ≥ 1% of price), the offer needs to be $99k (27.0% below list).
- Recommended offer: $99k (27.0% below list) — sets the bar for 1% rule.
Location & tenants
- Location reads 78/100 on livability (#147 in IA, #2,653 nationally) — a middle-class / working-renter tenant base. Strengths: crime A+, cost of living A+, housing A+; Watch: employment D, amenities F, commute F.
- New Hampton Community School District (town): math 76% / reading 73% proficiency, ranked #84 of 289 in IA (top 29%) — strong family-tenant draw, lease renewals of 3-5y typical.
- Zoned schools: New Hampton Elementary School (math 67% / reading 52%, grade B-, #390 of 616 statewide, top 69%, 401 students, 33% FRL); New Hampton Middle School (math 83% / reading 76%, grade A+, #35 of 246 statewide, top 16%, 279 students, 34% FRL); New Hampton High School (math 75% / reading 79%, grade A-, #60 of 336 statewide, top 21%, 339 students, 28% FRL).
- Market conditions: 29 active listings in the ZIP; 6 units permitted in Chickasaw County in 2024 (0 in 5+ unit buildings).
Forward outlook
- In year one you build about $14k of equity ($933 loan paydown + $14k appreciation (10.0% local appreciation)).
- Chickasaw County population projected at -13% by 2050 — secular population decline; favor cash flow + early exit over multi-decade hold.
- By year 3, paydown + projected appreciation supports a ~$37k cash-out refi (75% LTV) — recoverable capital for the next deal without selling this one.
Negotiation context
- Only 11 days on market — expect competitive offers; lowballing is unlikely to land.
Risks & watch-outs
- Watch-outs: built in 1900 — expect roof / HVAC / electrical / plumbing capex.
Questions for the listing agent
- What do current leases actually rent for vs. the listed asking? Can we see a recent rent roll and the last 12 months of T-12 income?
- Built in 1900 — when were the roof, HVAC, electrical panel, plumbing, and water heater last replaced?
- Is there a deadline driving the sale (1031 exchange, divorce, estate, relocation)? That informs how much negotiation room exists.
- Schools are A-rated — typically a magnet for longer-tenancy family renters. What's the average tenant stay here, and is there a school-zone premium baked into asking?
- What's the average days-on-market for RENTAL listings here right now (not sales)? A rising rental-DOM trend means longer vacancies and softer asking-rent achievability than the comps imply.
- What's the recent tenant-quality profile in this submarket — average credit score on applications, eviction rate, late-payment / NSF rate, and stable-employment percentage? A property-management company in the area should have these aggregated.
- How much new for-sale + rental construction is in the pipeline within 1–3 miles? Heavy new supply typically softens prices + rents 12–24 months out; constrained supply supports both.
Investment metrics
- 1% rule
- 0.73% ✗
- Cap rate
- 4.92%
- Cash-on-cash
- -4.90%
- DSCR
- 0.78
- GRM
- 11.4
CMA / ARV
- ARV (median comp)
- $192,781
- List price
- $135,000
- Delta
- -29.97%
- Verdict
- UNDERPRICED
- Comps
- 1 within 2.0 mi
Projected returns pro-forma
10.0% appreciation · 3.0% rent growth · sell at horizon
- IRR
- 20.8%
- Equity multiple
- 2.69×
- Total profit
- $63,706
- Equity at exit
- $121,619
- IRR
- 18.9%
- Equity multiple
- 6.17×
- Total profit
- $195,366
- Equity at exit
- $262,275
Cash invested: $37,800 (down + closing). Projections, not guarantees.
Landlord ↔ Tenant lean methodology
- Overall (STATE)
- 83 Strongly Landlord-Friendly
- State Iowa
- 83 Strongly Landlord-Friendly · R+6
- County
- — inherits STATE
- City
- — inherits STATE
ZIP-level market 50659
- Home prices YoY
- 13.9%
- Active inventory
- 29
- Price-to-rent
- 11.4×
Monthly cashflow live
- Estimated rent
- $986 medium interval (Pro) →
- Mortgage (P&I)
- −$708
- Tax est. 1.5%
- −$169 /mo · $2,025/yr
- Insurance
- −$56
- HOA
- −$0
- Vacancy / Maint / Mgmt
- −$207
- Net cashflow
- $-154
Break-even live
Sensitivity live
| Price | -10% $-61 | -5% $-108 | +0% $-154 | +5% $-201 | +10% $-248 |
|---|---|---|---|---|---|
| Rent | -10% $-232 | -5% $-193 | +0% $-154 | +5% $-115 | +10% $-77 |
| Rate | -1.0pp $-86 | -0.5pp $-120 | base $-154 | +0.5pp $-189 | +1.0pp $-225 |
UW: 25.0% down · 7.5% · 30yr · 1.5% tax · 5.0% vac · 8.0% maint · 8.0% mgmt
Financing live
Cash to close
- Down payment
- $33,750
- Closing costs
- $4,050
- Reserves months
- —
- Total cash needed
- —
Loan-product check · same deal, 3 products live
Conventional
25% down · 7.5% · 30yr
- Down + closing
- —
- Monthly P&I
- —
- Monthly cashflow
- —
- DSCR
- —
- Eligible?
- —
Personal DTI + credit; lowest rate.
DSCR
20% down · 8.5% · 30yr
- Down + closing
- —
- Monthly P&I
- —
- Monthly cashflow
- —
- DSCR
- —
- Eligible?
- —
No personal income docs; deal must DSCR.
Hard money
10% down · 12.0% · 12mo
- Down + closing
- —
- Monthly P&I
- —
- Monthly cashflow
- —
- DSCR
- —
- Eligible?
- —
Short-term bridge; refi at stabilization.
Listing history 3 events
-
2026-05-16status Pending 486-char remark
-
2026-05-08historical 486-char remark
-
2026-02-11$135,000 Active 486-char remark
ⓘ Source: listings_history table (triggers on properties + properties_extension) + one-shot
backfill from property_details.listing_events for pre-trigger history.
Nearby sold comps map
Loading sold comps map…
Walkable amenities ~0.75 mi
Loading nearby amenities…
Taxation est. · year 1
- Rental income
- $11,826
- − Mortgage interest
- −$7,562
- − Property taxes
- −$2,025
- − Insurance
- −$675
- − Repairs & maintenance
- −$946
- − Management
- −$946
- − Depreciation
- −$3,927
- Taxable loss
- −$4,255
- Est. tax savings @ 24.0%
- +$1,021
- After-tax cash flow
- $-831/yr
For passive investors: Depreciation is non-cash, so a rental often shows a tax loss while cash-flowing — sheltering income. Rental losses are passive: they offset passive income freely, and up to $25,000/yr can offset ordinary (W-2) income if you actively participate and your MAGI is under $100k (phasing out to $0 by $150k); unused losses carry forward. On sale, claimed depreciation is recaptured at up to 25%, and gains may owe capital-gains tax (a 1031 exchange can defer both). Figures are a year-1 estimate at your 24.0% rate — not tax advice; consult a CPA.
Schools (NCES district)
- District
- New Hampton Community School District
- NCES district ID
- 1920340
- Math proficiency
- 76% ▼ -4.00%
- Reading proficiency
- 73% ▲ 3.00%
- Median HH income
- $46,395
- Composite
- 62.78/100
- National rank
- #668
- State rank
- #84 of 289 in IA
Livability — New Hampton
- Score
- 78/100
- State rank
- #147
- US rank
- #2653
Category grades
Schools grade is shown separately in the Schools card above.
Census & demographics
- Census place
- New Hampton, IA
- Population (ZIP)
- 5,942
Population outlook (Chickasaw County) Hauer SSP2
- Today (2025)
- 11,503 people
- By 2030
- 11,187 · -2.7%
- By 2040
- 10,569 · -8.1%
- By 2050
- 9,997 · -13.1%
- By 2075
- 8,819 · -23.3%
- By 2100
- 7,126 · -38.1%
Race, ethnicity, and origin ACS 2023
- Neighborhood character
- Predominantly White (92%)
- Race & ethnicity
- White 92% Hispanic / Latino 6% Two or more races 3%
- Hispanic origin (detail)
- Mexican 5%
- Common ancestry
- Portuguese 7% Iranian 2% Serbian 1%
- Foreign-born
- 4% · Canada
- Languages at home
- 91% English-only · Spanish 5% German/W. Germanic 3%
Political lean MEDSL · Chickasaw
- 2024 margin
- Solid R (+37.2) · D 30.8% · R 68.0% · Other 1.2%
- 2008→2024 swing
- -57.9pp toward R · 2008: 20.8pp · 2024: -37.2pp
- All cycles
- 2024: R+37.2 2020: R+31.3 2016: R+23.2 2012: D+11.1 2008: D+20.8
Not yet ingested
- Civics
- —
Market trends
- HPI YoY
- ▲ 41.75%
- Current HPI
- 341.83
- Rent YoY
- —
- Metro
- —
- State GDP YoY
- ▲ 2.48%
- F500 in state
- 4
Industry mix (Fortune 500 HQ in IA)
| Industry | F500 HQs | Revenue |
|---|---|---|
| Financial Services | 1 | $16B |
|
||
| Retail / Convenience | 1 | $15B |
|
||
Price history
3 events — show timeline
- 2026-05-16 Pending — METROMLS
- 2026-05-08 Listing Removed — METROMLS
- 2026-02-11 Listed $135,000 METROMLS
Cash-flow waterfall
monthlySold comps — $/sqft
last 12 mo · ≤1 miLoading sold comps…