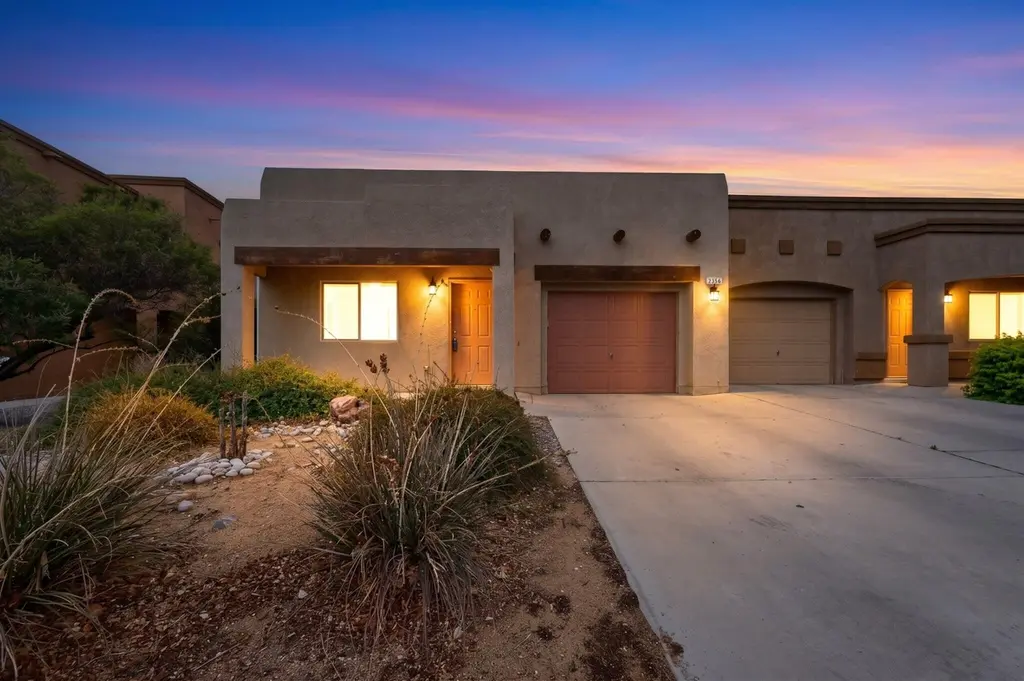
2364 Cortina Loop SE · Rio Rancho, NM
Flood risk 1/10 · Minimal
- FEMA flood zone
- X (unshaded)
- Chance of flooding over 30 yrs
- 0.0%
- Est. flood insurance / yr
- $507 – $1,088
Fire risk 3/10 · Minor
- Est. fire insurance / yr
- $706 – $1,312
Heat risk 4/10 · Minor
- Hot days now (above 96°F)
- 7 days/yr
- Hot days in 30 yrs
- 17 days/yr
Wind risk 1/10 · Minimal
- Chance of severe wind over 30 yrs
- —
Air-quality risk 3/10 · Minor
- Unhealthy air days now
- 3 days/yr
- Unhealthy air days in 30 yrs
- 4 days/yr
Risk factors via First Street. Map © Google.
Why this score? — see what drove the D grade
The composite is a weighted blend of 9 inputs, each scored 0–100. Each bar is that input's sub-score; the figure is the points it added to the 100-point composite (weight × sub-score).
- Cash flow +12.5/30.0
- ARV discount +7.7/15.0
- Schools +5.2/10.0
- DSCR +3.7/10.0
- Livability +3.6/5.0
- Rent growth +3.3/5.0
- 1% rule +2.9/10.0
- Condition / age +2.5/5.0
- Appreciation +0.0/10.0
$285,000
🖨 Deal sheet (PDF) 📄 Offer letter ✓ Due diligence
Listing remarks MLS
Quaint 2 bedroom, 1 bath with covered front porch in sought after Cabezon gated neighborhood of Astante Townhomes. Nicely updated bathroom and updated flooring with new carpet and laminate. Low maintenance, easy care yard and home. Perfect for singles, first-time homebuyers, downsizers and investors.
Key facts
- $60 HOA
- Garage
- Built 2009
Neighborhood map
What this means for you Summary
Snapshot
- This is a 3-bed/1.0-bath townhouse listed at $285k.
Deal economics
- At list price, monthly cash flow is $-44 ($-524/yr) — negative.
- To cash-flow at today's rent, offer at most $277k (2.7% below list).
- To meet the 1% rule (rent ≥ 1% of price), the offer needs to be $226k (20.9% below list).
- Recommended offer: $226k (20.9% below list) — sets the bar for 1% rule.
- Cap rate 6.1% vs local median 3.6% in Rio Rancho — top-decile yield for the area; either an underpriced asset or a hidden risk that comps aren't pricing in. Stress-test before assuming the spread holds.
Location & tenants
- Location reads 71/100 on livability (#17 in NM) — a middle-class / working-renter tenant base. Strengths: housing A+, cost of living A; Watch: amenities D, commute F.
- Rio Rancho Public Schools (suburban): math 48% / reading 73% proficiency, ranked #4 of 29 in NM (top 14%) — acceptable for families but not a draw, mixed tenant base, ~2y average lease.
- Zoned schools: Maggie Cordova Elementary School (674 students, 100% FRL); Lincoln Middle (823 students, 21% FRL); Rio Rancho High (math 52% / reading 77%, grade B-, #22 of 110 statewide, top 22%, 2,573 students, 22% FRL).
- Market conditions: Rents rising (+3.1%/yr); 837 active listings in the ZIP; 8 comparable units currently listed for rent nearby; rentals leasing fast (median 5d on market — plan ~1-2 weeks tenant-placement turnaround); solid renter incomes; 1,278 units permitted in Sandoval County in 2024 (216 in 5+ unit buildings).
- This rent runs 31% of the median local income ($87k/yr) — at the standard rent-burdened threshold; future hikes will face affordability resistance.
Forward outlook
- Local home prices are declining (-3.0%/yr); year-one equity from $2k of loan paydown is wiped out by about $9k of value loss. Plan a longer hold.
- Sandoval County population projected at +15% by 2050 — long-run rental-demand tailwind backs the buy-and-hold thesis.
Negotiation context
- It's been on market 45 days — a 3% lower offer ($276k) is reasonable based on typical stale-listing flexibility.
- 4 sale attempts since 9y ago with the ask held roughly flat each time — persistent listings suggest the price (not the market) is what's stuck; bring a comps-based counter.
Questions for the listing agent
- What do current leases actually rent for vs. the listed asking? Can we see a recent rent roll and the last 12 months of T-12 income?
- It's been on market 45 days. Have you received any prior offers? Is the seller open to a 21% concession, seller financing, or rate buy-down credit?
- What does the HOA fee cover, when was the last increase, and are there any pending special assessments or reserve-fund shortfalls?
- Is there a deadline driving the sale (1031 exchange, divorce, estate, relocation)? That informs how much negotiation room exists.
- The area grade is low — what's the realistic commute time and amenity access for the typical tenant pool here? Any planned neighborhood developments (good or bad) we should know about?
- What's the average days-on-market for RENTAL listings here right now (not sales)? A rising rental-DOM trend means longer vacancies and softer asking-rent achievability than the comps imply.
- What's the recent tenant-quality profile in this submarket — average credit score on applications, eviction rate, late-payment / NSF rate, and stable-employment percentage? A property-management company in the area should have these aggregated.
- How much new for-sale + rental construction is in the pipeline within 1–3 miles? Heavy new supply typically softens prices + rents 12–24 months out; constrained supply supports both.
Investment metrics
- 1% rule
- 0.79% ✗
- Cap rate
- 6.11%
- Cash-on-cash
- -0.66%
- DSCR
- 0.97
- GRM
- 10.5
CMA / ARV
- ARV (median comp)
- $286,368
- List price
- $285,000
- Delta
- -0.48%
- Verdict
- FAIR
- Comps
- 6 within 1.0 mi
Show comp detail 4 sales within ~0.75 mi
| Address | Dist | Beds/Ba | Sqft | Sold | Price | $/sf | Match |
|---|---|---|---|---|---|---|---|
| 2238 Cortina Loop SE | 0.02mi | 2/2.0 (-1) | 1,023 (+7%) | 4mo | $285,000 | $279 | 74 |
| 2451 Treviso Dr SE | 0.07mi | 2/2.0 (-1) | 1,026 (+8%) | 5mo | $280,000 | $273 | 71 |
| 2528 Pelizzano Dr SE | 0.14mi | 2/1.0 (-1) | 1,072 (+12%) | 2mo | $290,000 | $271 | 66 |
| 2474 Corvara Dr SE | 0.07mi | 2/1.0 (-1) | 1,062 (+11%) | 22mo | $291,900 | $275 | 54 |
Match score weights: distance 35% · size 25% · config 20% · recency 20%. Top-matched comps best support the ARV.
Projected returns pro-forma
-3.0% appreciation · 3.13% rent growth · sell at horizon
- IRR
- -17.3%
- Equity multiple
- 0.39×
- Total profit
- $-48,725
- Equity at exit
- $42,494
- IRR
- -9.1%
- Equity multiple
- 0.44×
- Total profit
- $-45,019
- Equity at exit
- $24,642
Cash invested: $79,800 (down + closing). Projections, not guarantees.
Landlord ↔ Tenant lean methodology
- Overall (STATE)
- 55 Moderately Landlord-Leaning
- State New Mexico
- 55 Moderately Landlord-Leaning · D+3
- County
- — inherits STATE
- City
- — inherits STATE
ZIP-level market 87124
- Rents YoY
- 3.1%
- Active inventory
- 837
- Price-to-rent
- 10.5×
Monthly cashflow live
- Estimated rent
- $2,255 high interval (Pro) →
- Mortgage (P&I)
- −$1,495
- Tax from tax record
- −$152 /mo · $1,824/yr
- Insurance
- −$119
- HOA
- −$60
- Vacancy / Maint / Mgmt
- −$474
- Net cashflow
- $-44
Break-even live
Sensitivity live
| Price | -10% $118 | -5% $37 | +0% $-44 | +5% $-124 | +10% $-205 |
|---|---|---|---|---|---|
| Rent | -10% $-222 | -5% $-133 | +0% $-44 | +5% $45 | +10% $134 |
| Rate | -1.0pp $100 | -0.5pp $29 | base $-44 | +0.5pp $-118 | +1.0pp $-193 |
UW: 25.0% down · 7.5% · 30yr · 1.5% tax · 5.0% vac · 8.0% maint · 8.0% mgmt
Financing live
Cash to close
- Down payment
- $71,250
- Closing costs
- $8,550
- Reserves months
- —
- Total cash needed
- —
Loan-product check · same deal, 3 products live
Conventional
25% down · 7.5% · 30yr
- Down + closing
- —
- Monthly P&I
- —
- Monthly cashflow
- —
- DSCR
- —
- Eligible?
- —
Personal DTI + credit; lowest rate.
DSCR
20% down · 8.5% · 30yr
- Down + closing
- —
- Monthly P&I
- —
- Monthly cashflow
- —
- DSCR
- —
- Eligible?
- —
No personal income docs; deal must DSCR.
Hard money
10% down · 12.0% · 12mo
- Down + closing
- —
- Monthly P&I
- —
- Monthly cashflow
- —
- DSCR
- —
- Eligible?
- —
Short-term bridge; refi at stabilization.
Rent comps 8 comps
| Address | Beds | Baths | Sqft | Rent | $/sqft | DOM | Units | Dist |
|---|---|---|---|---|---|---|---|---|
| 2301 Westside Blvd SE Rio Rancho, NM | 1.0–3.0 | 1.0–2.5 | 1156 | $2,900 | $2.51 | 17d | 14 | 0.37mi |
| 10800 Golf Course Rd NW Albuquerque, NM | 2.0 | 1.0–2.0 | 962 | $2,200 | $2.29 | 3d | 9 | 1.13mi |
| 5123 Prospector Way NW Albuquerque, NM | 1.0–3.0 | 1.0–2.0 | 980 | $2,084 | $2.13 | 5d | 12 | 1.22mi |
| 925 Country Club Dr SE Rio Rancho, NM | 2.0 | 2.0 | 1045 | $1,600 | $1.53 | 4d | 1 | 1.29mi |
| 10615 Monte Bello Ct NW Albuquerque, NM | 3.0 | 1.5 | 1070 | $2,050 | $1.92 | 4d | 1 | 1.30mi |
| 10615 Monte Bello Ct NW Albuquerque, NM | 3.0 | 1.5 | 1070 | $2,050 | $1.92 | 5d | 1 | 1.30mi |
| 937 Country Club Dr SE Unit J Rio Rancho, NM | 2.0 | 1.5 | 1100 | $1,300 | $1.18 | 45d | 1 | 1.32mi |
| 900 Country Club Dr SE Rio Rancho, NM | 1.0–2.0 | 1.0–2.0 | 730 | $1,567 | $2.15 | 3d | 12 | 1.37mi |
HOA detail
- Monthly dues
- $60 · $720/yr
- Likely covers
- security
Listing history 26 events
-
2026-06-15status $285,000 Pending 45 DOM
-
2026-06-15days on market $285,000 Active 45 DOM
-
2026-06-13days on market $285,000 Active 43 DOM
-
2026-06-13days on market $285,000 Active 42 DOM
-
2026-06-10remarks 348-char remark
-
2026-06-10days on market $285,000 Active 40 DOM
-
2026-06-09days on market $285,000 Active 39 DOM
-
2026-06-08days on market $285,000 Active 38 DOM
-
2026-06-07days on market $285,000 Active 37 DOM
-
2026-06-03days on market $285,000 Active 33 DOM
-
2026-06-02days on market $285,000 Active 32 DOM
-
2026-06-01days on market $285,000 Active 31 DOM
-
2026-05-31days on market $285,000 Active 30 DOM
-
2026-05-01$290,000 Active 301-char remark
Show marketing remark (301 chars)
Quaint 2 bedroom, 1 bath with covered front porch in sought after Cabezon gated neighborhood of Astante Townhomes. Nicely updated bathroom and updated flooring with new carpet and laminate. Low maintenance, easy care yard and home. Perfect for singles, first-time homebuyers, downsizers and investors.
-
2025-04-18historical $1,750
-
2025-04-15$1,750
-
2019-08-22historical
-
2019-08-21soldstatus
-
2019-07-10status Pending
-
2019-07-08$159,900 Active
-
2017-05-05historical
-
2017-05-03soldstatus
-
2017-03-25status Pending
-
2017-03-04$142,000 Active
-
2016-10-26price $145,000
-
2013-12-06soldstatus
ⓘ Source: listings_history table (triggers on properties + properties_extension) + one-shot
backfill from property_details.listing_events for pre-trigger history.
Tax reassessment forecast NM · Resets to sale price
- Current annual tax
- $1,824 · $152/mo
- Projected year-2 tax
- $2,280 · $190/mo
- Expected delta
- +$456/yr (+$38/mo · 25.0%)
ⓘ Screening estimate from a state-policy table — verify with the county assessor before closing.
Climate risk First Street
- Flood 1/10 Low FEMA zone X (unshaded) · 0% chance over 30 yrs
- Wildfire 3/10 Moderate
- Heat 4/10 Moderate 7 d/yr ≥96°F today · 17 d/yr by 30 yrs out
- Wind 1/10 Low
- Air quality 3/10 Moderate 3 unhealthy d/yr today · 4 by 30 yrs out
Nearby sold comps map
Loading sold comps map…
Walkable amenities ~0.75 mi
Loading nearby amenities…
Taxation est. · year 1
- Rental income
- $27,063
- − Mortgage interest
- −$15,964
- − Property taxes
- −$1,824
- − Insurance
- −$1,425
- − Repairs & maintenance
- −$2,165
- − Management
- −$2,165
- − HOA
- −$720
- − Depreciation
- −$8,291
- Taxable loss
- −$5,492
- Est. tax savings @ 24.0%
- +$1,318
- After-tax cash flow
- $794/yr
For passive investors: Depreciation is non-cash, so a rental often shows a tax loss while cash-flowing — sheltering income. Rental losses are passive: they offset passive income freely, and up to $25,000/yr can offset ordinary (W-2) income if you actively participate and your MAGI is under $100k (phasing out to $0 by $150k); unused losses carry forward. On sale, claimed depreciation is recaptured at up to 25%, and gains may owe capital-gains tax (a 1031 exchange can defer both). Figures are a year-1 estimate at your 24.0% rate — not tax advice; consult a CPA.
Schools (NCES district)
- District
- Rio Rancho Public Schools
- NCES district ID
- 3500010
- Math proficiency
- 48% ▲ 38.00%
- Reading proficiency
- 73% ▲ 48.00%
- Median HH income
- $59,410
- Composite
- 52.29/100
- National rank
- #1595
- State rank
- #4 of 29 in NM
Livability — Rio Rancho
- Score
- 71/100
- State rank
- #17
- US rank
- #7253
Category grades
Schools grade is shown separately in the Schools card above.
Census & demographics
- Census place
- Rio Rancho, NM
- County
- Sandoval County · 110,336 people
- City population
- 110,336
- Metro
- Albuquerque, NM
- Population (ZIP)
- 58,499
- Household income
- $86,555
- Rent vs Own
- Severe rent burden
- 1027.0
Population outlook (Sandoval County) Hauer SSP2
- Today (2025)
- 155,072 people
- By 2030
- 161,714 · +4.3%
- By 2040
- 171,831 · +10.8%
- By 2050
- 178,536 · +15.1%
- By 2075
- 192,517 · +24.1%
- By 2100
- 197,952 · +27.7%
Race, ethnicity, and origin ACS 2023
- Neighborhood character
- Diverse neighborhood (Simpson 0.61)
- Race & ethnicity
- White 47% Hispanic / Latino 41% Two or more races 18% Native American 5% Black 3% Asian 2%
- Hispanic origin (detail)
- Mexican 24% Puerto Rican 2%
- Common ancestry
- Lithuanian 3% Slovak 2% Italian 2%
- Foreign-born
- 6% · Canada, Vietnam, China
- Languages at home
- 84% English-only · Spanish 12% Vietnamese 1%
Political lean MEDSL · Sandoval
- 2024 margin
- Lean D (+5.8) · D 51.8% · R 46.0% · Other 2.2%
- 2008→2024 swing
- -7.0pp toward R · 2008: 12.8pp · 2024: 5.8pp
- All cycles
- 2024: D+5.8 2020: D+8.4 2016: D+2.7 2012: D+5.1 2008: D+12.8
Not yet ingested
- Civics
- —
Market trends
- HPI YoY
- ▼ -303.50%
- Current HPI
- 219.8377
- Rent YoY
- ▲ 3.13%
- Metro
- Albuquerque, NM
- State GDP YoY
- —
- F500 in state
- 0
Price history
+100.0% since first listed13 events — show timeline
- 2026-05-01 Listed $290,000 Southwest MLS
- 2025-04-18 Rental Removed $1,750 APPFOLIO
- 2025-04-15 Listed for Rent $1,750 APPFOLIO
- 2019-08-22 Delisted — Southwest MLS
- 2019-08-21 Sold (Public Records) — Public Records
- 2019-07-10 Pending — Southwest MLS
- 2019-07-08 Listed $159,900 Southwest MLS
- 2017-05-05 Delisted — Southwest MLS
- 2017-05-03 Sold (Public Records) — Public Records
- 2017-03-25 Pending — Southwest MLS
- 2017-03-04 Listed $142,000 Southwest MLS
- 2016-10-26 Price Changed $145,000 Southwest MLS
- 2013-12-06 Sold (Public Records) — Public Records
Property tax history
+0.9%/yrLatest (2024): $1,824 · +2.3% YoY. Source: county tax records.
Cash-flow waterfall
monthlySold comps — $/sqft
last 12 mo · ≤1 miLoading sold comps…