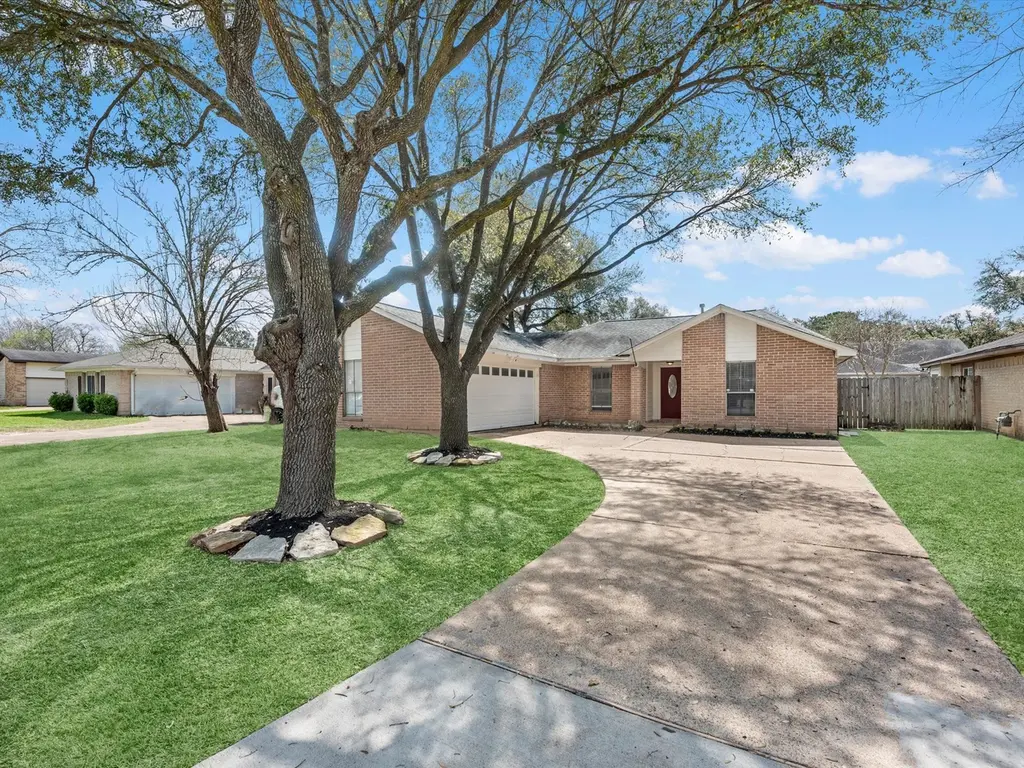
17519 Sundrop Ln · Houston, TX
Flood risk 1/10 · Minimal
- FEMA flood zone
- X (unshaded)
- Chance of flooding over 30 yrs
- 0.0%
- Est. flood insurance / yr
- $507 – $1,088
Fire risk 3/10 · Minor
- Est. fire insurance / yr
- $1,222 – $2,270
Heat risk 9/10 · Severe
- Hot days now (above 110°F)
- 7 days/yr
- Hot days in 30 yrs
- 23 days/yr
Wind risk 9/10 · Severe
- Chance of severe wind over 30 yrs
- 99.0%
Air-quality risk 2/10 · Minimal
- Unhealthy air days now
- 2 days/yr
- Unhealthy air days in 30 yrs
- 2 days/yr
Risk factors via First Street. Map © Google.
Why this score? — see what drove the D grade
The composite is a weighted blend of 9 inputs, each scored 0–100. Each bar is that input's sub-score; the figure is the points it added to the 100-point composite (weight × sub-score).
- ARV discount +10.5/15.0
- Cash flow +7.9/30.0
- Schools +5.7/10.0
- Appreciation +4.3/10.0
- Livability +3.7/5.0
- 1% rule +3.5/10.0
- Condition / age +2.5/5.0
- DSCR +2.0/10.0
- Rent growth +1.8/5.0
$245,000
🖨 Deal sheet (PDF) 📄 Offer letter ✓ Due diligence
Listing remarks MLS
Luxurious and modern 3 bed, 2 bath home that you must see to appreciate. Beautiful flooring, plenty of ceiling fans throughout, spectacular kitchen with modern stainless appliances and undermount sink. Numerous windows allow natural lighting, gorgeous fireplace in living area. Primary room is huge with a beautiful, modern bathroom and huge closet. Large yard with a big patio. This home is a must see hidden gem! This house DID FLOOD during hurricane Harvey.
Key facts
- Custom cabinetry
- Farmhouse sink
- Cozy fireplace
Tags
Property features AI
Finance
- Other: Lease not considered; Disclosures: Municipal Utility District disclosure, Seller disclosure
- HOA & community: Mayde Creek Community Association; Annual association fee of $565; Tennis courts
Exterior
- Parking: Attached 2-car garage
- Utilities: Public water; Public sewer
- Home design: Residential property; Built in 1982; Slab foundation
- Construction: Brick construction; Composition roof
- Exterior features: Cleared lot in a subdivision; Asphalt road access; Community pool
Interior
- Kitchen: Dishwasher; Electric oven; Gas cooktop; Garbage disposal; Microwave
- Bedrooms: Total rooms: 7
- Bathrooms: 2 full bathrooms
- Heating & cooling: Central heating (gas); Central electric air conditioning
- Interior features: Breakfast bar; Double vanity; Granite counters; Kitchen/family room combo; Pantry; Walk-in pantry; Tub/shower; Gas log fireplace (1)
- Laundry & utility: Washer hookup; Gas dryer hookup; Dryer (present)
Neighborhood map
What this means for you Summary
Snapshot
- This is a 4-bed/2.0-bath single-family listed at $245k.
Deal economics
- At list price, monthly cash flow is $-259 ($-3k/yr) — negative.
- To cash-flow at today's rent, offer at most $199k (18.7% below list).
- To meet the 1% rule (rent ≥ 1% of price), the offer needs to be $209k (14.8% below list).
- Recommended offer: $199k (18.7% below list) — sets the bar for cash-flow.
- Cap rate 5.0% vs local median 3.2% in Houston — top-decile yield for the area; either an underpriced asset or a hidden risk that comps aren't pricing in. Stress-test before assuming the spread holds.
Location & tenants
- Location reads 74/100 on livability (#184 in TX, #4,771 nationally) — a middle-class / working-renter tenant base. Strengths: amenities A+, cost of living A+, housing A+; Watch: crime F.
- Katy ISD (suburban): math 61% / reading 63% proficiency, ranked #29 of 826 in TX (top 4%) — acceptable for families but not a draw, mixed tenant base, ~2y average lease.
- Zoned schools: Jean & Betty Schmalz El (math 28% / reading 39%, grade F, #2,174 of 4,322 statewide, top 51%, 1,311 students, 77% FRL); Mayde Creek J H (math 41% / reading 48%, grade D, #491 of 1,662 statewide, top 31%, 1,273 students, 77% FRL); Katy H S (math 62% / reading 74%, grade B, #150 of 1,632 statewide, top 10%, 3,330 students, 38% FRL) — zoned schools average 64% FRL vs 27% district-wide (36 pts higher); higher-poverty schools than district average — tighter screening recommended.
- Zoned-school proficiency averages 49% at this address vs 62% district-wide (-13 pts) — the specific schools serving this property underperform the Katy ISD average; the district grade overstates school quality for this exact location.
- Market conditions: Rents soft (-2.9%/yr); 505 active listings in the ZIP; 40 comparable units currently listed for rent nearby; rentals leasing fast (median 12d on market — plan ~1-2 weeks tenant-placement turnaround); solid renter incomes; 29,883 units permitted in Harris County in 2024 (8,621 in 5+ unit buildings).
- This rent runs 31% of the median local income ($81k/yr) — at the standard rent-burdened threshold; future hikes will face affordability resistance.
Forward outlook
- Local home prices are declining (-1.4%/yr); year-one equity from $2k of loan paydown is wiped out by about $3k of value loss. Plan a longer hold.
- Harris County population projected at +47% by 2050 — long-run rental-demand tailwind backs the buy-and-hold thesis.
Negotiation context
- It's been on market 28 days — a 2% lower offer ($241k) is reasonable based on typical stale-listing flexibility.
- 4 sale attempts since 8y ago; this cycle's ask has dropped $20k (8%) from the opening price — seller is motivated, your offer sets the floor, not the list.
Risks & watch-outs
- Climate carrying-cost: severe wind risk, 99% chance of damaging wind over 30y; extreme-heat days projected 7→23/yr by 2055 (HVAC capex compounding) — expect insurance premiums to compound above CPI over the hold.
Questions for the listing agent
- What do current leases actually rent for vs. the listed asking? Can we see a recent rent roll and the last 12 months of T-12 income?
- What does the HOA fee cover, when was the last increase, and are there any pending special assessments or reserve-fund shortfalls?
- Is there a deadline driving the sale (1031 exchange, divorce, estate, relocation)? That informs how much negotiation room exists.
- Schools are D-rated, which usually means shorter tenancies and higher turnover. Who's the typical renter profile here, and what's been the actual vacancy rate?
- Crime grade is F in this area — have there been break-ins, vandalism, or insurance claims at this property in the last 3 years? What carrier currently insures it and at what premium?
- The area grade is low — what's the realistic commute time and amenity access for the typical tenant pool here? Any planned neighborhood developments (good or bad) we should know about?
- What's the average days-on-market for RENTAL listings here right now (not sales)? A rising rental-DOM trend means longer vacancies and softer asking-rent achievability than the comps imply.
- What's the recent tenant-quality profile in this submarket — average credit score on applications, eviction rate, late-payment / NSF rate, and stable-employment percentage? A property-management company in the area should have these aggregated.
- How much new for-sale + rental construction is in the pipeline within 1–3 miles? Heavy new supply typically softens prices + rents 12–24 months out; constrained supply supports both.
Investment metrics
- 1% rule
- 0.85% ✗
- Cap rate
- 5.02%
- Cash-on-cash
- -4.53%
- DSCR
- 0.80
- GRM
- 9.8
CMA / ARV
- ARV (median comp)
- $262,648
- List price
- $245,000
- Delta
- -2.53%
- Verdict
- FAIR
- Comps
- 20 within 1.0 mi
Show comp detail 12 sales within ~0.75 mi
| Address | Dist | Beds/Ba | Sqft | Sold | Price | $/sf | Match |
|---|---|---|---|---|---|---|---|
| 1902 Hollyoak Dr | 0.15mi | 3/2.0 (-1) | 1,688 (+8%) | 10mo | $269,000 | $159 | 67 |
| 2007 Fernspray Ln | 0.16mi | 4/2.0 | 1,795 (+14%) | 3mo | $275,000 | $153 | 66 |
| 2006 Waterelm Dr | 0.18mi | 3/2.0 (-1) | 1,799 (+15%) | 1mo | $195,000 | $108 | 61 |
| 1918 Marlberry Ln | 0.18mi | 3/2.0 (-1) | 1,800 (+15%) | 1mo | $254,000 | $141 | 61 |
| 1902 Marlberry Ln | 0.22mi | 3/2.0 (-1) | 1,717 (+9%) | 13mo | $285,000 | $166 | 58 |
| 1895 Barker Cypress Rd Unit 1126 | 0.41mi | 4/2.5 | 1,804 (+15%) | 14mo | $375,000 | $208 | 42 |
| 17127 White Acer Way | 0.66mi | 3/2.5 (-1) | 1,703 (+8%) | 10mo | $319,990 | $188 | 40 |
| 1520 Red Acer Dr | 0.60mi | 3/2.5 (-1) | 1,703 (+8%) | 13mo | $373,020 | $219 | 40 |
| 17113 White Acer Way | 0.67mi | 3/2.5 (-1) | 1,703 (+8%) | 9mo | $327,290 | $192 | 40 |
| 1506 Red Acer Dr | 0.64mi | 3/2.5 (-1) | 1,703 (+8%) | 14mo | $363,970 | $214 | 37 |
| 1517 Red Acer Dr | 0.61mi | 3/2.5 (-1) | 1,727 (+10%) | 14mo | $352,420 | $204 | 36 |
| 17109 White Acer Way | 0.68mi | 3/2.5 (-1) | 1,727 (+10%) | 12mo | $379,290 | $220 | 34 |
Match score weights: distance 35% · size 25% · config 20% · recency 20%. Top-matched comps best support the ARV.
Projected returns pro-forma
-1.4% appreciation · 0.0% rent growth · sell at horizon
- IRR
- -16.4%
- Equity multiple
- 0.34×
- Total profit
- $-45,246
- Equity at exit
- $54,513
- IRR
- -13.3%
- Equity multiple
- 0.01×
- Total profit
- $-68,066
- Equity at exit
- $53,387
Cash invested: $68,600 (down + closing). Projections, not guarantees.
Landlord ↔ Tenant lean methodology
- Overall (STATE)
- 87 Strongly Landlord-Friendly
- State Texas
- 87 Strongly Landlord-Friendly · R+5
- County
- — inherits STATE
- City
- — inherits STATE
ZIP-level market 77084
- Home prices YoY
- -0.6%
- Rents YoY
- -2.9%
- Active inventory
- 505
- Price-to-rent
- 9.8×
Monthly cashflow live
- Estimated rent
- $2,088 high interval (Pro) →
- Mortgage (P&I)
- −$1,285
- Tax from tax record
- −$474 /mo · $5,692/yr
- Insurance
- −$102
- HOA
- −$47
- Vacancy / Maint / Mgmt
- −$438
- Net cashflow
- $-259
Break-even live
Sensitivity live
| Price | -10% $-120 | -5% $-190 | +0% $-259 | +5% $-328 | +10% $-398 |
|---|---|---|---|---|---|
| Rent | -10% $-424 | -5% $-341 | +0% $-259 | +5% $-177 | +10% $-94 |
| Rate | -1.0pp $-136 | -0.5pp $-197 | base $-259 | +0.5pp $-322 | +1.0pp $-387 |
UW: 25.0% down · 7.5% · 30yr · 1.5% tax · 5.0% vac · 8.0% maint · 8.0% mgmt
Financing live
Cash to close
- Down payment
- $61,250
- Closing costs
- $7,350
- Reserves months
- —
- Total cash needed
- —
Loan-product check · same deal, 3 products live
Conventional
25% down · 7.5% · 30yr
- Down + closing
- —
- Monthly P&I
- —
- Monthly cashflow
- —
- DSCR
- —
- Eligible?
- —
Personal DTI + credit; lowest rate.
DSCR
20% down · 8.5% · 30yr
- Down + closing
- —
- Monthly P&I
- —
- Monthly cashflow
- —
- DSCR
- —
- Eligible?
- —
No personal income docs; deal must DSCR.
Hard money
10% down · 12.0% · 12mo
- Down + closing
- —
- Monthly P&I
- —
- Monthly cashflow
- —
- DSCR
- —
- Eligible?
- —
Short-term bridge; refi at stabilization.
Rent comps 40 comps
| Address | Beds | Baths | Sqft | Rent | $/sqft | DOM | Units | Dist |
|---|---|---|---|---|---|---|---|---|
| 1800 Barker Cypress Rd Unit 1833 Houston, TX | 3.0 | 2.0 | 1295 | $1,489 | $1.15 | 1d | 1 | 0.29mi |
| 1800 Barker Cypress Rd Unit 3047 Houston, TX | 3.0 | 2.0 | 1295 | $1,540 | $1.19 | 13d | 1 | 0.32mi |
| 1760 Barker Cypress Rd Unit 1793 Houston, TX | 3.0 | 2.0 | 1400 | $1,915 | $1.37 | 45d | 1 | 0.39mi |
| 1760 Barker Cypress Rd Unit 3174 Houston, TX | 3.0 | 2.0 | 1400 | $1,915 | $1.37 | 1d | 1 | 0.39mi |
| 1760 Barker Cypress Rd Unit 3148 Houston, TX | 3.0 | 2.0 | 1400 | $1,864 | $1.33 | 1d | 1 | 0.39mi |
| 1895 Barker Cypress Rd Unit 1928 Houston, TX | 3.0 | 2.0 | 1333 | $1,860 | $1.40 | 45d | 1 | 0.40mi |
| 1895 Barker Cypress Rd Unit 3174 Houston, TX | 3.0 | 2.0 | 1365 | $2,245 | $1.64 | 13d | 1 | 0.40mi |
| 1895 Barker Cypress Rd Unit 3165 Houston, TX | 3.0 | 2.0 | 1365 | $2,194 | $1.61 | 1d | 1 | 0.40mi |
| 1772 S Parkview Dr Houston, TX | 3.0 | 2.0 | 1400 | $1,910 | $1.36 | 45d | 1 | 0.40mi |
| 1895 Barker Cypress Rd Unit 3047 Houston, TX | 3.0 | 2.0 | 1365 | $2,245 | $1.64 | 1d | 1 | 0.43mi |
| 18108 S Parkview Dr Unit 3174 Houston, TX | 3.0 | 2.0 | 1395 | $2,244 | $1.61 | 12d | 1 | 0.43mi |
| 18108 S Parkview Dr Unit 3112 Houston, TX | 3.0 | 2.0 | 1395 | $2,204 | $1.58 | 1d | 1 | 0.43mi |
| 18108 S Parkview Dr Unit 18141 Houston, TX | 3.0 | 2.0 | 1395 | $2,255 | $1.62 | 45d | 1 | 0.43mi |
| 1672 Barker Cypress Rd Houston, TX | 3.0 | 2.0 | 1435 | $1,785 | $1.24 | 45d | 1 | 0.46mi |
| 1672 Barker Cypress Rd Houston, TX | 3.0 | 2.0 | 1435 | $1,785 | $1.24 | 26d | 1 | 0.46mi |
| 17972 Park Row Blvd Houston, TX | 3.0 | 2.0 | 1400 | $1,890 | $1.35 | 45d | 1 | 0.65mi |
| 1507 Red Acer Dr Houston, TX | 4.0 | 2.5 | 1989 | $2,695 | $1.35 | 45d | 1 | 0.65mi |
| 18600 S Parkview Dr Houston, TX | 1.0–3.0 | 1.0–2.0 | 1055 | $1,670 | $1.58 | 1d | 48 | 0.82mi |
| 2931 Barker Cypress Rd Houston, TX | 1.0–3.0 | 1.0–2.0 | 1065 | $1,796 | $1.69 | 3d | 20 | 0.85mi |
| 2926 Barker Cypress Rd Unit 3174 Houston, TX | 3.0 | 2.0 | 1424 | $2,189 | $1.54 | 12d | 1 | 0.86mi |
| 2926 Barker Cypress Rd Unit 2959 Houston, TX | 3.0 | 2.0 | 1424 | $2,110 | $1.48 | 45d | 1 | 0.86mi |
| 2926 Barker Cypress Rd Unit 3047 Houston, TX | 3.0 | 2.0 | 1424 | $2,200 | $1.54 | 13d | 1 | 0.89mi |
| 2926 Barker Cypress Rd Unit 3165 Houston, TX | 3.0 | 2.0 | 1424 | $2,149 | $1.51 | 1d | 1 | 0.89mi |
| 18606 S Parkview Dr Houston, TX | 3.0 | 2.0 | 1341 | $1,630 | $1.22 | 45d | 1 | 0.91mi |
| 2500 Greenhouse Rd Unit 3174 Houston, TX | 3.0 | 2.0 | 1440 | $2,094 | $1.45 | 1d | 1 | 1.06mi |
| 2500 Greenhouse Rd Unit 3112 Houston, TX | 3.0 | 2.0 | 1440 | $2,043 | $1.42 | 1d | 1 | 1.06mi |
| 2500 Greenhouse Rd Unit 2533 Houston, TX | 3.0 | 2.0 | 1440 | $2,094 | $1.45 | 45d | 1 | 1.06mi |
| 2218 Greenhouse Rd Houston, TX | 1.0–3.0 | 1.0–2.0 | 1066 | $2,236 | $2.10 | 0d | 25 | 1.12mi |
| 2411 Greenhouse Rd Houston, TX | 1.0–3.0 | 1.0–2.0 | 1109 | $1,931 | $1.74 | 1d | 39 | 1.22mi |
| 18407 Early Green Trl Unit 1316402P Houston, TX | 3.0 | 2.0 | 1550 | $3,988 | $2.57 | 4d | 1 | 1.26mi |
| 529 Barker Clodine Rd Houston, TX | 1.0–3.0 | 1.0–2.5 | 1095 | $2,430 | $2.22 | 26d | 22 | 1.27mi |
| 529 Barker Clodine Rd Houston, TX | 1.0–3.0 | 1.0–2.5 | 1095 | $2,501 | $2.28 | 45d | 39 | 1.27mi |
| 2219 Greenhouse Rd Unit 3112 Houston, TX | 3.0 | 2.0 | 1425 | $1,854 | $1.30 | 1d | 1 | 1.28mi |
| 2219 Greenhouse Rd Unit 2252 Houston, TX | 3.0 | 2.0 | 1425 | $1,905 | $1.34 | 45d | 1 | 1.28mi |
| 2219 Greenhouse Rd Unit 3174 Houston, TX | 3.0 | 2.0 | 1425 | $1,905 | $1.34 | 1d | 1 | 1.28mi |
| 2040 Greenhouse Rd Houston, TX | 1.0–3.0 | 1.0–2.5 | 1209 | $2,449 | $2.03 | 0d | 28 | 1.29mi |
| 3331 Dale Ridge Trl Houston, TX | 4.0 | 2.5 | 2216 | $2,121 | $0.96 | 24d | 1 | 1.32mi |
| 529 Barker-Clodine Rd Unit 562 Houston, TX | 3.0 | 2.0 | 1523 | $1,989 | $1.31 | 12d | 1 | 1.36mi |
| 529 Barker-Clodine Rd Unit 525 Houston, TX | 3.0 | 2.0 | 1523 | $1,949 | $1.28 | 1d | 1 | 1.36mi |
| 535 Barker-Clodine Rd Houston, TX | 3.0 | 2.0 | 1523 | $2,019 | $1.33 | 45d | 1 | 1.37mi |
HOA detail
- Monthly dues
- $47 · $564/yr
Listing history 29 events
-
2026-06-21days on market $245,000 Active 28 DOM
-
2026-06-18price $245,000 Active 25 DOM
-
2026-06-18days on market $265,000 Active 25 DOM
-
2026-06-17days on market $265,000 Active 24 DOM
-
2026-06-16days on market $265,000 Active 23 DOM
-
2026-06-15days on market $265,000 Active 22 DOM
-
2026-06-13days on market $265,000 Active 20 DOM
-
2026-06-09days on market $265,000 Active 16 DOM
-
2026-06-08days on market $265,000 Active 15 DOM
-
2026-06-07days on market $265,000 Active 14 DOM
-
2026-06-04days on market $265,000 Active 11 DOM
-
2026-06-03days on market $265,000 Active 10 DOM
-
2026-06-02days on market $265,000 Active 9 DOM
-
2026-06-01days on market $265,000 Active 8 DOM
-
2026-05-31days on market $265,000 Active 7 DOM
-
2026-04-29price $256,000 885-char remark
-
2026-04-09price $264,000 885-char remark
-
2026-03-08$275,000 Active 885-char remark
-
2021-03-04soldstatus
-
2021-02-24soldstatus Sold 460-char remark
Show marketing remark (460 chars)
Luxurious and modern 3 bed, 2 bath home that you must see to appreciate. Beautiful flooring, plenty of ceiling fans throughout, spectacular kitchen with modern stainless appliances and undermount sink. Numerous windows allow natural lighting, gorgeous fireplace in living area. Primary room is huge with a beautiful, modern bathroom and huge closet. Large yard with a big patio. This home is a must see hidden gem! This house DID FLOOD during hurricane Harvey.
-
2021-01-19status Pending 460-char remark
Show marketing remark (460 chars)
Luxurious and modern 3 bed, 2 bath home that you must see to appreciate. Beautiful flooring, plenty of ceiling fans throughout, spectacular kitchen with modern stainless appliances and undermount sink. Numerous windows allow natural lighting, gorgeous fireplace in living area. Primary room is huge with a beautiful, modern bathroom and huge closet. Large yard with a big patio. This home is a must see hidden gem! This house DID FLOOD during hurricane Harvey.
-
2021-01-08status Option Pending 460-char remark
Show marketing remark (460 chars)
Luxurious and modern 3 bed, 2 bath home that you must see to appreciate. Beautiful flooring, plenty of ceiling fans throughout, spectacular kitchen with modern stainless appliances and undermount sink. Numerous windows allow natural lighting, gorgeous fireplace in living area. Primary room is huge with a beautiful, modern bathroom and huge closet. Large yard with a big patio. This home is a must see hidden gem! This house DID FLOOD during hurricane Harvey.
-
2021-01-04$215,000 Active 460-char remark
Show marketing remark (460 chars)
Luxurious and modern 3 bed, 2 bath home that you must see to appreciate. Beautiful flooring, plenty of ceiling fans throughout, spectacular kitchen with modern stainless appliances and undermount sink. Numerous windows allow natural lighting, gorgeous fireplace in living area. Primary room is huge with a beautiful, modern bathroom and huge closet. Large yard with a big patio. This home is a must see hidden gem! This house DID FLOOD during hurricane Harvey.
-
2018-05-25soldstatus Sold
-
2018-05-25soldstatus
-
2018-05-15status Pending
-
2018-05-11$105,000 Active
-
2005-07-19soldstatus
-
1998-03-27soldstatus
ⓘ Source: listings_history table (triggers on properties + properties_extension) + one-shot
backfill from property_details.listing_events for pre-trigger history.
Tax reassessment forecast TX · Resets to sale price
- Current annual tax
- $5,692 · $474/mo
- Projected year-2 tax
- $5,692 · $474/mo
- Expected delta
- $0/yr ($0/mo · 0.0%)
ⓘ Screening estimate from a state-policy table — verify with the county assessor before closing.
Climate risk First Street
- Flood 1/10 Low FEMA zone X (unshaded) · 0% chance over 30 yrs
- Wildfire 3/10 Moderate
- Heat 9/10 Extreme 7 d/yr ≥110°F today · 23 d/yr by 30 yrs out
- Wind 9/10 Extreme 99% chance of damaging wind over 30 yrs
- Air quality 2/10 Low 2 unhealthy d/yr today · 2 by 30 yrs out
Nearby sold comps map
Loading sold comps map…
Walkable amenities ~0.75 mi
Loading nearby amenities…
Taxation est. · year 1
- Rental income
- $25,051
- − Mortgage interest
- −$13,724
- − Property taxes
- −$5,692
- − Insurance
- −$1,225
- − Repairs & maintenance
- −$2,004
- − Management
- −$2,004
- − HOA
- −$564
- − Depreciation
- −$7,127
- Taxable loss
- −$7,289
- Est. tax savings @ 24.0%
- +$1,749
- After-tax cash flow
- $-1,359/yr
For passive investors: Depreciation is non-cash, so a rental often shows a tax loss while cash-flowing — sheltering income. Rental losses are passive: they offset passive income freely, and up to $25,000/yr can offset ordinary (W-2) income if you actively participate and your MAGI is under $100k (phasing out to $0 by $150k); unused losses carry forward. On sale, claimed depreciation is recaptured at up to 25%, and gains may owe capital-gains tax (a 1031 exchange can defer both). Figures are a year-1 estimate at your 24.0% rate — not tax advice; consult a CPA.
Schools (NCES district)
- District
- Katy ISD
- NCES district ID
- 4825170
- Math proficiency
- 61% ▼ -7.00%
- Reading proficiency
- 63% ▼ -3.00%
- Median HH income
- $90,312
- Composite
- 56.59/100
- National rank
- #1146
- State rank
- #29 of 826 in TX
Livability — Houston
- Score
- 74/100
- State rank
- #184
- US rank
- #4771
Category grades
Schools grade is shown separately in the Schools card above.
Census & demographics
- Census place
- Houston, TX
- County
- Harris County · 4,702,590 people
- City population
- 3,226,434
- Metro
- Houston-The Woodlands-Sugar Land, TX
- Population (ZIP)
- 110,217
- Household income
- $80,575
- Rent vs Own
- Severe rent burden
- 3257.0
Population outlook (Harris County) Hauer SSP2
- Today (2025)
- 5,571,493 people
- By 2030
- 6,089,821 · +9.3%
- By 2040
- 7,142,806 · +28.2%
- By 2050
- 8,185,864 · +46.9%
- By 2075
- 10,574,329 · +89.8%
- By 2100
- 12,109,958 · +117.4%
Race, ethnicity, and origin ACS 2023
- Neighborhood character
- Diverse neighborhood (Simpson 0.69)
- Race & ethnicity
- Hispanic / Latino 48% Two or more races 22% White 22% Black 16% Asian 11% Native American 2%
- Hispanic origin (detail)
- Mexican 27% Cuban 2%
- Common ancestry
- Lithuanian 1% Romanian 1% Slovak 1%
- Foreign-born
- 32% · Canada, Vietnam, Jamaica
- Languages at home
- 48% English-only · Spanish 38% Other Indo-European 5% Vietnamese 3%
Political lean MEDSL · Harris
- 2024 margin
- Lean D (+5.5) · D 52.0% · R 46.4% · Other 1.6%
- 2008→2024 swing
- +3.9pp toward D · 2008: 1.6pp · 2024: 5.5pp
- All cycles
- 2024: D+5.5 2020: D+13.3 2016: D+12.4 2012: D+0.1 2008: D+1.6
Not yet ingested
- Civics
- —
Market trends
- HPI YoY
- ▼ -1.40%
- Current HPI
- 251.8474
- Rent YoY
- ▼ -2.89%
- Metro
- Houston-The Woodlands-Sugar Land, TX
- State GDP YoY
- ▲ 3.95%
- F500 in state
- 110
Industry mix (Fortune 500 HQ in TX)
| Industry | F500 HQs | Revenue |
|---|---|---|
| Energy | 16 | $1,198B |
|
||
| Technology | 5 | $198B |
|
||
| Engineering / Construction | 4 | $72B |
|
||
| Energy Services | 3 | $60B |
|
||
| Utilities | 3 | $41B |
|
||
| Healthcare | 2 | $330B |
|
||
Price history
+133.3% since first listed17 events — show timeline
- 2026-06-18 Price Changed $245,000 HARMLS
- 2026-05-24 Listed $265,000 HARMLS
- 2026-05-23 Listing Removed — HARMLS
- 2026-04-29 Price Changed $256,000 HARMLS
- 2026-04-09 Price Changed $264,000 HARMLS
- 2026-03-08 Listed $275,000 HARMLS
- 2021-03-04 Sold (Public Records) — Public Records
- 2021-02-24 Sold (MLS) — HARMLS
- 2021-01-19 Pending — HARMLS
- 2021-01-08 Pending — HARMLS
- 2021-01-04 Listed $215,000 HARMLS
- 2018-05-25 Sold (Public Records) — Public Records
- 2018-05-25 Sold (MLS) — HARMLS
- 2018-05-15 Pending — HARMLS
- 2018-05-11 Listed $105,000 HARMLS
- 2005-07-19 Sold (Public Records) — Public Records
- 1998-03-27 Sold (Public Records) — Public Records
Property tax history
+5.1%/yrLatest (2025): $5,692 · +21.1% YoY. Source: county tax records.
Cash-flow waterfall
monthlySold comps — $/sqft
last 12 mo · ≤1 miLoading sold comps…