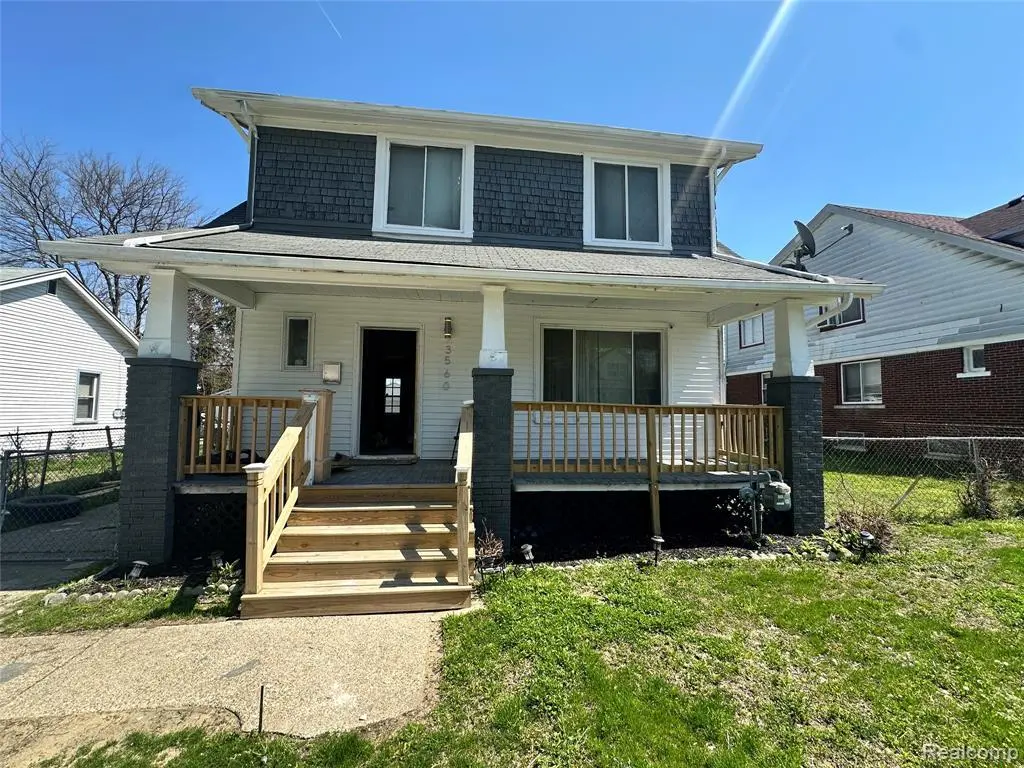
3560 Guilford St · Detroit, MI
Flood risk 1/10 · Minimal
- FEMA flood zone
- X (unshaded)
- Chance of flooding over 30 yrs
- 0.0%
- Est. flood insurance / yr
- $473 – $860
Fire risk 1/10 · Minimal
- Est. fire insurance / yr
- $784 – $1,456
Heat risk 3/10 · Minor
- Hot days now (above 96°F)
- 7 days/yr
- Hot days in 30 yrs
- 15 days/yr
Wind risk 2/10 · Minimal
- Chance of severe wind over 30 yrs
- —
Air-quality risk 3/10 · Minor
- Unhealthy air days now
- 3 days/yr
- Unhealthy air days in 30 yrs
- 4 days/yr
Risk factors via First Street. Map © Google.
Why this score? — see what drove the B- grade
The composite is a weighted blend of 9 inputs, each scored 0–100. Each bar is that input's sub-score; the figure is the points it added to the 100-point composite (weight × sub-score).
- Cash flow +30.0/30.0
- 1% rule +10.0/10.0
- DSCR +10.0/10.0
- ARV discount +7.5/15.0
- Livability +3.7/5.0
- Rent growth +2.7/5.0
- Condition / age +2.5/5.0
- Schools +1.3/10.0
- Appreciation +0.0/10.0
$95,000
🖨 Deal sheet 📄 Offer letter ✓ Due diligence
Listing remarks
Great opportunity on this vacant 3-bedroom, 1.1-bath 2-story home that is approximately 90% renovated. Major updates have already been completed, leaving only finishing touches needed to bring this property to its full potential. Home needs grout work in the kitchen, minor drywall repairs throughout, and garage clean-out. Ideal for investors or owner-occupants looking for a value-add opportunity. Spacious layout with strong upside potential. Listing broker holds contractual equitable interest in the property and may receive consideration from the transaction. Property is being marketed pursuant to a purchase agreement with the seller. Closing will be conducted via contract assignment or dou
Key facts
- 6,534 sq ft lot
- Garage
- Built 1930
Property features AI
Exterior
- Parking: Detached 1-car garage
- Utilities: Public water; Public sewer
- Home design: Single-family residence; Two levels; Ground-level entry with steps
- Construction: Aluminum siding; Block foundation; Built with an above-grade finished area and a partially finished lower level
- Exterior features: Exterior lighting; Deck; Porch; Back yard fencing; Asphalt roof; Paved road access
Interior
- Bathrooms: 1 full bathroom; 1 half bathroom
- Heating & cooling: Forced air heating (natural gas); Ceiling fans; No central air
- Interior features: Gas water heater; Basement is partially finished; 6 total rooms
- Laundry & utility: Washer hookup; Gas dryer hookup
Neighborhood map
What this means for you Summary
Snapshot
- This is a 3-bed/1.0-bath single-family listed at $95k.
Deal economics
- At list price, monthly cash flow is $548 ($7k/yr) — positive.
- The deal already cash-flows at list — no discount required.
- Meets the 1% rule at list price ($2k rent vs $95k).
- Recommended offer: $94k (1.5% below list) — sets the bar for market timing.
- Cap rate 13.2% vs local median 10.2% in Detroit — meaningfully above typical; check what's discounted (condition, days-on-market, listing class) to confirm the premium yield is real.
Location & tenants
- Location reads 73/100 on livability (#218 in MI) — a middle-class / working-renter tenant base. Strengths: amenities A+, commute A+, cost of living A+; Watch: schools F, crime F, employment F.
- Detroit Public Schools Community District (urban): math 10% / reading 24% proficiency, ranked #499 of 540 in MI (top 92%) — low school quality limits family demand, transient renter base, plan for 1-2y turnover; 90% free/reduced lunch — lower-income household profile, screen leases tightly.
- Market conditions: Rents flat; 484 active listings in the ZIP; 35 comparable units currently listed for rent nearby; rentals at typical pace (median 24d on market — plan ~3-4 weeks tenant-placement turnaround); lower-income renter base — watch delinquency; 2,639 units permitted in Wayne County in 2024 (1,216 in 5+ unit buildings).
- This rent runs 41% of the median local income ($45k/yr) — at the standard rent-burdened threshold; future hikes will face affordability resistance.
Forward outlook
- Local home prices are declining (-3.0%/yr); year-one equity from $657 of loan paydown is wiped out by about $3k of value loss. Plan a longer hold.
- Wayne County population projected at -17% by 2050 — secular population decline; favor cash flow + early exit over multi-decade hold.
- At projected returns (-3.0% appreciation + 0.7% rent growth), your $27k cash investment doubles in ~6 years — after that, you're playing with house money.
Negotiation context
- It's been on market 19 days — a 2% lower offer ($94k) is reasonable based on typical stale-listing flexibility.
- 24 sale attempts since 23y ago; this cycle's ask has dropped $10k (10%) from the opening price — seller is motivated, your offer sets the floor, not the list.
- Current owner paid $65k; 46% above their basis — modest negotiation headroom, anchor on the comps not their cost.
Risks & watch-outs
- Watch-outs: built in 1930 — expect roof / HVAC / electrical / plumbing capex.
Questions for the listing agent
- Built in 1930 — when were the roof, HVAC, electrical panel, plumbing, and water heater last replaced?
- Is there a deadline driving the sale (1031 exchange, divorce, estate, relocation)? That informs how much negotiation room exists.
- Schools are F-rated, which usually means shorter tenancies and higher turnover. Who's the typical renter profile here, and what's been the actual vacancy rate?
- Crime grade is F in this area — have there been break-ins, vandalism, or insurance claims at this property in the last 3 years? What carrier currently insures it and at what premium?
- What's the average days-on-market for RENTAL listings here right now (not sales)? A rising rental-DOM trend means longer vacancies and softer asking-rent achievability than the comps imply.
- What's the recent tenant-quality profile in this submarket — average credit score on applications, eviction rate, late-payment / NSF rate, and stable-employment percentage? A property-management company in the area should have these aggregated.
- How much new for-sale + rental construction is in the pipeline within 1–3 miles? Heavy new supply typically softens prices + rents 12–24 months out; constrained supply supports both.
Investment metrics
- 1% rule
- 1.62% ✓
- Cap rate
- 13.22%
- Cash-on-cash
- 24.72%
- DSCR
- 2.10
- GRM
- 5.1
CMA / ARV
- ARV (median comp)
- $362,814
- List price
- $95,000
- Delta
- -73.82%
- Verdict
- UNDERPRICED
- Comps
- 20 within 1.0 mi
Show comp detail 12 sales within ~0.75 mi
| Address | Dist | Beds/Ba | Sqft | Sold | Price | $/sf | Match |
|---|---|---|---|---|---|---|---|
| 833 University Pl | 0.25mi | 3/2.0 | 1,456 (0%) | 1mo | $361,000 | $248 | 84 |
| 3930 Cadieux Rd | 0.20mi | 3/1.5 | 1,400 (-4%) | 4mo | $92,000 | $66 | 79 |
| 879 Grosse Pointe Ct | 0.12mi | 2/1.0 (-1) | 1,570 (+8%) | 2mo | $290,000 | $185 | 75 |
| 4121 Harvard St | 0.31mi | 3/1.5 | 1,373 (-6%) | 1mo | $189,000 | $138 | 74 |
| 847 University Pl | 0.24mi | 3/2.0 | 1,638 (+12%) | 0mo | $437,500 | $267 | 64 |
| 818 Neff Rd | 0.25mi | 4/2.0 (+1) | 1,625 (+12%) | 4mo | $372,000 | $229 | 56 |
| 4403 Guilford St | 0.43mi | 3/1.0 | 1,270 (-13%) | 4mo | $35,900 | $28 | 56 |
| 4224 Bishop St | 0.45mi | 2/1.0 (-1) | 1,296 (-11%) | 7mo | $99,000 | $76 | 50 |
| 3500 Yorkshire Rd | 0.41mi | 3/2.0 | 1,664 (+14%) | 7mo | $245,000 | $147 | 47 |
| 631 Washington Rd | 0.56mi | 3/2.0 | 1,651 (+13%) | 1mo | $550,000 | $333 | 47 |
| 745 Lincoln Rd | 0.49mi | 3/1.5 | 1,654 (+14%) | 6mo | $438,000 | $265 | 47 |
| 4517 Lodewyck St | 0.58mi | 3/1.0 | 1,245 (-14%) | 7mo | $77,500 | $62 | 43 |
Match score weights: distance 35% · size 25% · config 20% · recency 20%. Top-matched comps best support the ARV.
Projected returns pro-forma
-3.0% appreciation · 0.73% rent growth · sell at horizon
- IRR
- 15.5%
- Equity multiple
- 1.61×
- Total profit
- $16,104
- Equity at exit
- $14,165
- IRR
- 22.4%
- Equity multiple
- 2.71×
- Total profit
- $45,614
- Equity at exit
- $8,214
Cash invested: $26,600 (down + closing). Projections, not guarantees.
Landlord ↔ Tenant lean methodology
- Overall (STATE)
- 62 Landlord-Friendly
- State Michigan
- 62 Landlord-Friendly · EVEN
- County
- — inherits STATE
- City
- — inherits STATE
ZIP-level market 48224
- Rents YoY
- 0.7%
- Active inventory
- 484
- Price-to-rent
- 5.1×
Monthly cashflow live
- Estimated rent
- $1,539 high interval (Pro) →
- Mortgage (P&I)
- −$498
- Tax from tax record
- −$130 /mo · $1,559/yr
- Insurance
- −$40
- HOA
- −$0
- Vacancy / Maint / Mgmt
- −$323
- Net cashflow
- $548
Break-even live
UW: 25.0% down · 7.5% · 30yr · 1.5% tax · 5.0% vac · 8.0% maint · 8.0% mgmt
Financing live
Cash to close
- Down payment
- $23,750
- Closing costs
- $2,850
- Reserves months
- —
- Total cash needed
- —
Loan-product check · same deal, 3 products live
Conventional
25% down · 7.5% · 30yr
- Down + closing
- —
- Monthly P&I
- —
- Monthly cashflow
- —
- DSCR
- —
- Eligible?
- —
Personal DTI + credit; lowest rate.
DSCR
20% down · 8.5% · 30yr
- Down + closing
- —
- Monthly P&I
- —
- Monthly cashflow
- —
- DSCR
- —
- Eligible?
- —
No personal income docs; deal must DSCR.
Hard money
10% down · 12.0% · 12mo
- Down + closing
- —
- Monthly P&I
- —
- Monthly cashflow
- —
- DSCR
- —
- Eligible?
- —
Short-term bridge; refi at stabilization.
Rent comps 35 comps
| Address | Beds | Baths | Sqft | Rent | $/sqft | DOM | Units | Dist |
|---|---|---|---|---|---|---|---|---|
| 890 Neff Rd Grosse Pointe, MI | 2.0 | 1.0 | 1100 | $2,000 | $1.82 | 24d | 1 | 0.15mi |
| 17137 Ontario St Unit 1 Detroit, MI | 2.0 | 1.0 | 982 | $1,123 | $1.14 | 24d | 1 | 0.56mi |
| 3626 Courville St Detroit, MI | 3.0 | 1.0 | 1260 | $1,300 | $1.03 | 43d | 1 | 0.67mi |
| 542 Neff Ln Grosse Pointe, MI | 2.0 | 1.0 | 900 | $1,595 | $1.77 | 43d | 1 | 0.79mi |
| 509 Saint Clair Ave Grosse Pointe, MI | 2.0 | 1.0 | 1000 | $1,300 | $1.30 | 43d | 1 | 0.85mi |
| 4627 Bedford St Unit 1 Detroit, MI | 2.0 | 1.0 | 1050 | $945 | $0.90 | 19d | 1 | 0.94mi |
| 3651 Buckingham Ave Detroit, MI | 3.0 | 1.0 | 1320 | $1,300 | $0.98 | 17d | 1 | 0.97mi |
| 371 Neff Rd Grosse Pointe, MI | 3.0 | 1.5 | 1835 | $2,395 | $1.31 | 24d | 1 | 1.06mi |
| 5028 Bedford St Detroit, MI | 3.0 | 1.0 | 1000 | $1,400 | $1.40 | 4d | 1 | 1.07mi |
| 389 Saint Clair Ave Grosse Pointe, MI | 2.0 | 2.0 | 1000 | $3,150 | $3.15 | 43d | 1 | 1.08mi |
| 3625 Chatsworth St Detroit, MI | 3.0 | 1.5 | 1182 | $1,295 | $1.10 | 24d | 1 | 1.08mi |
| 5031 Bedford St Detroit, MI | 2.0 | 1.0 | 876 | $1,870 | $2.13 | 1d | 1 | 1.10mi |
| 295 Rivard Blvd heuristic Grosse Pointe, MI | 2.0 | 1.0 | 1000 | $2,000 | $2.00 | 24d | 1 | 1.15mi |
| 5786 Neff Ave Detroit, MI | 3.0 | 1.5 | 1100 | $1,225 | $1.11 | 16d | 1 | 1.18mi |
| 5112 Haverhill St Unit 1 Detroit, MI | 2.0 | 1.0 | 1000 | $1,100 | $1.10 | 43d | 1 | 1.20mi |
| 5783 Yorkshire Rd Detroit, MI | 2.0 | 1.0 | 1040 | $1,200 | $1.15 | 43d | 1 | 1.24mi |
| 1312 Somerset Ave Grosse Pointe Park, MI | 2.0 | 1.0 | 1200 | $1,400 | $1.17 | 16d | 1 | 1.25mi |
| 4151 Nottingham Rd Detroit, MI | 2.0 | 1.0 | 1022 | $1,275 | $1.25 | 17d | 1 | 1.28mi |
| 5267 Haverhill St Detroit, MI | 3.0 | 1.5 | 1458 | $1,300 | $0.89 | 17d | 1 | 1.28mi |
| 5267 Haverhill St Detroit, MI | 3.0 | 1.5 | 1458 | $1,300 | $0.89 | 16d | 1 | 1.28mi |
| 5915 Farmbrook St Detroit, MI | 3.0 | 1.5 | 1000 | $1,250 | $1.25 | 24d | 1 | 1.29mi |
| 4391 Nottingham Rd Unit 4393 Detroit, MI | 2.0 | 1.0 | 1038 | $950 | $0.92 | 4d | 1 | 1.32mi |
| 5235 Chatsworth St Detroit, MI | 2.0 | 1.0 | 900 | $1,050 | $1.17 | 43d | 1 | 1.38mi |
| 1236 Beaconsfield Ave Unit 1 Grosse Pointe Park, MI | 2.0 | 1.0 | 1100 | $1,600 | $1.45 | 24d | 1 | 1.39mi |
| 6154 Woodhall St Detroit, MI | 2.0 | 1.0 | 1136 | $1,000 | $0.88 | 43d | 1 | 1.39mi |
| 5574 Buckingham Ave Detroit, MI | 3.0 | 1.0 | 1430 | $1,450 | $1.01 | 4d | 1 | 1.40mi |
| 19000 Chandler Park Dr Grosse Pointe, MI | 2.0 | 1.0 | 1374 | $2,300 | $1.67 | 1d | 1 | 1.40mi |
| 19000 Chandler Park Dr Grosse Pointe, MI | 2.0 | 1.0 | 1374 | $2,300 | $1.67 | 4d | 1 | 1.40mi |
| 6181 Neff Ave Detroit, MI | 3.0 | 1.0 | 1102 | $1,299 | $1.18 | 17d | 1 | 1.41mi |
| 6175 Marseilles St Detroit, MI | 3.0 | 1.0 | 1100 | $1,100 | $1.00 | 43d | 1 | 1.44mi |
| 6225 Oldtown St Detroit, MI | 3.0 | 1.0 | 1330 | $1,199 | $0.90 | 17d | 1 | 1.46mi |
| 6304 Bluehill St Detroit, MI | 3.0 | 1.0 | 1088 | $1,500 | $1.38 | 43d | 1 | 1.46mi |
| 1334 Maryland St Grosse Pointe Park, MI | 2.0 | 1.0 | 1786 | $1,200 | $0.67 | 17d | 1 | 1.48mi |
| 6325 Neff Ave Detroit, MI | 3.0 | 1.0 | 1000 | $1,500 | $1.50 | 2d | 1 | 1.49mi |
| 1314 Maryland St Grosse Pointe Park, MI | 2.0 | 1.0 | 1008 | $1,250 | $1.24 | 43d | 1 | 1.49mi |
Listing history 50 events
-
2026-06-01days on market $95,000 Active 19 DOM
-
2026-05-31days on market $95,000 Active 18 DOM
-
2026-05-18price $95,000 1040-char remark
-
2026-05-18price $95,000 1040-char remark
-
2026-05-13$105,000 Active 1040-char remark
-
2026-05-13$105,000 Active 1040-char remark
-
2026-01-26historical
-
2026-01-26historical
-
2025-12-16price $169,000
-
2025-12-15price $169,000
-
2025-11-16price $180,000
-
2025-11-15price $180,000
-
2025-11-15price $199,999
-
2025-11-14price $199,999
-
2025-10-29price $217,000
-
2025-10-29price $217,000
-
2025-10-26$225,000 Active
-
2025-10-25$225,000 Active
-
2025-09-25soldstatus $65,000
-
2017-06-22soldstatus $31,000 Sold
-
2017-06-22soldstatus $31,000 Closed
-
2017-06-02status Pending
-
2017-06-02status Pending
-
2017-04-25$31,500 Active
-
2017-04-25$31,500 Active
-
2017-04-18historical
-
2017-04-18historical
-
2017-04-01$45,000 Active
-
2017-04-01$45,000 Active
-
2017-03-29historical
-
2017-03-28historical
-
2017-02-28price $49,000
-
2017-02-27price $49,000
-
2017-02-27status Active
-
2017-02-27status Active
-
2017-02-14status Pending
-
2017-02-14status Pending
-
2016-11-16$55,000 Active
-
2016-11-16$55,000 Active
-
2014-07-28soldstatus $38,000
-
2014-07-28soldstatus $38,000
-
2014-07-28soldstatus $38,000
-
2014-07-06historical
-
2013-10-22$38,000
-
2013-10-22$38,000
-
2013-10-22$38,000
-
2013-10-22historical
-
2013-10-22historical
-
2013-10-22historical
-
2013-09-03$40,000
ⓘ Source: listings_history table (triggers on properties + properties_extension) + one-shot
backfill from property_details.listing_events for pre-trigger history.
Tax reassessment forecast MI · Partial reset (capped growth)
- Current annual tax
- $1,559 · $130/mo
- Projected year-2 tax
- $1,559 · $130/mo
- Expected delta
- $0/yr ($0/mo · 0.0%)
ⓘ Screening estimate from a state-policy table — verify with the county assessor before closing.
Climate risk First Street
- Flood 1/10 Low FEMA zone X (unshaded) · 0% chance over 30 yrs
- Wildfire 1/10 Low
- Heat 3/10 Moderate 7 d/yr ≥96°F today · 15 d/yr by 30 yrs out
- Wind 2/10 Low
- Air quality 3/10 Moderate 3 unhealthy d/yr today · 4 by 30 yrs out
Nearby sold comps map
Loading sold comps map…
Walkable amenities ~0.75 mi
Loading nearby amenities…
Taxation est. · year 1
- Rental income
- $18,467
- − Mortgage interest
- −$5,321
- − Property taxes
- −$1,559
- − Insurance
- −$475
- − Repairs & maintenance
- −$1,477
- − Management
- −$1,477
- − Depreciation
- −$2,764
- Taxable income
- $5,393
- Est. tax owed @ 24.0%
- −$1,294
- After-tax cash flow
- $5,282/yr
For passive investors: Depreciation is non-cash, so a rental often shows a tax loss while cash-flowing — sheltering income. Rental losses are passive: they offset passive income freely, and up to $25,000/yr can offset ordinary (W-2) income if you actively participate and your MAGI is under $100k (phasing out to $0 by $150k); unused losses carry forward. On sale, claimed depreciation is recaptured at up to 25%, and gains may owe capital-gains tax (a 1031 exchange can defer both). Figures are a year-1 estimate at your 24.0% rate — not tax advice; consult a CPA.
Schools (NCES district)
- District
- Detroit Public Schools Community District
- NCES district ID
- 2601103
- Math proficiency
- 10% ▼ -2.00%
- Reading proficiency
- 24% ▲ 6.00%
- Median HH income
- $25,815
- Composite
- 13.06/100
- National rank
- #9564
- State rank
- #499 of 540 in MI
Livability — Detroit
- Score
- 73/100
- State rank
- #218
- US rank
- #5427
Category grades
Schools grade is shown separately in the Schools card above.
Census & demographics
- Census place
- Detroit, MI
- County
- Wayne County · 1,562,939 people
- City population
- 572,865
- Metro
- Detroit-Warren-Dearborn, MI
- Population (ZIP)
- 39,668
- Household income
- $44,856
- Rent vs Own
- Severe rent burden
- 2515.0
Population outlook (Wayne County) Hauer SSP2
- Today (2025)
- 1,675,273 people
- By 2030
- 1,620,300 · -3.3%
- By 2040
- 1,502,341 · -10.3%
- By 2050
- 1,384,039 · -17.4%
- By 2075
- 1,124,592 · -32.9%
- By 2100
- 881,193 · -47.4%
Race, ethnicity, and origin ACS 2023
- Neighborhood character
- Predominantly Black (88%)
- Race & ethnicity
- Black 88% White 8% Two or more races 3% Hispanic / Latino 1%
- Common ancestry
- Iranian 1% Romanian 1% Lithuanian 1%
- Foreign-born
- 1%
- Languages at home
- 97% English-only · Spanish 2%
Political lean MEDSL · Wayne
- 2024 margin
- Strong D (+29.0) · D 62.7% · R 33.7% · Other 3.6%
- 2008→2024 swing
- -20.5pp toward R · 2008: 49.5pp · 2024: 29.0pp
- All cycles
- 2024: D+29.0 2020: D+38.1 2016: D+37.3 2012: D+46.9 2008: D+49.5
Not yet ingested
- Civics
- —
Market trends
- HPI YoY
- ▼ -226.38%
- Current HPI
- 161.886
- Rent YoY
- ▲ 0.73%
- Metro
- Detroit-Warren-Dearborn, MI
- State GDP YoY
- ▲ 1.37%
- F500 in state
- 28
Industry mix (Fortune 500 HQ in MI)
| Industry | F500 HQs | Revenue |
|---|---|---|
| Automotive Parts | 3 | $48B |
|
||
| Automotive | 2 | $372B |
|
||
| Chemicals | 1 | $45B |
|
||
| Automotive Retail | 1 | $29B |
|
||
| Healthcare / Medical Devices | 1 | $23B |
|
||
| Automotive Technology | 1 | $20B |
|
||
Price history
-2.6% since first listed64 events — show timeline
- 2026-06-02 Listing Removed — REALCOMP
- 2026-06-02 Listing Removed — MiRealSource-MiMLS
- 2026-05-18 Price Changed $95,000 MiRealSource-MiMLS
- 2026-05-18 Price Changed $95,000 REALCOMP
- 2026-05-13 Listed $105,000 REALCOMP
- 2026-05-13 Listed $105,000 MiRealSource-MiMLS
- 2026-01-26 Listing Removed — MiRealSource-MiMLS
- 2026-01-26 Listing Removed — REALCOMP
- 2025-12-16 Price Changed $169,000 MiRealSource-MiMLS
- 2025-12-15 Price Changed $169,000 REALCOMP
- 2025-11-16 Price Changed $180,000 MiRealSource-MiMLS
- 2025-11-15 Price Changed $180,000 REALCOMP
- 2025-11-15 Price Changed $199,999 MiRealSource-MiMLS
- 2025-11-14 Price Changed $199,999 REALCOMP
- 2025-10-29 Price Changed $217,000 MiRealSource-MiMLS
- 2025-10-29 Price Changed $217,000 REALCOMP
- 2025-10-26 Listed $225,000 REALCOMP
- 2025-10-25 Listed $225,000 MiRealSource-MiMLS
- 2025-09-25 Sold (Public Records) $65,000 Public Records
- 2017-06-22 Sold (MLS) $31,000 MiRealSource-MiMLS
- 2017-06-22 Sold (MLS) $31,000 REALCOMP
- 2017-06-02 Pending — MiRealSource-MiMLS
- 2017-06-02 Pending — REALCOMP
- 2017-04-25 Listed $31,500 MiRealSource-MiMLS
- 2017-04-25 Listed $31,500 REALCOMP
- 2017-04-18 Listing Removed — REALCOMP
- 2017-04-18 Listing Removed — MiRealSource-MiMLS
- 2017-04-01 Listed $45,000 MiRealSource-MiMLS
- 2017-04-01 Listed $45,000 REALCOMP
- 2017-03-29 Listing Removed — REALCOMP
- 2017-03-28 Listing Removed — MiRealSource-MiMLS
- 2017-02-28 Price Changed $49,000 MiRealSource-MiMLS
- 2017-02-27 Price Changed $49,000 REALCOMP
- 2017-02-27 Relisted — MiRealSource-MiMLS
- 2017-02-27 Relisted — REALCOMP
- 2017-02-14 Pending — MiRealSource-MiMLS
- 2017-02-14 Pending — REALCOMP
- 2016-11-16 Listed $55,000 MiRealSource-MiMLS
- 2016-11-16 Listed $55,000 REALCOMP
- 2014-07-28 Sold (MLS) $38,000 REALCOMP
- 2014-07-28 Sold (MLS) $38,000 MiRealSource-MiMLS
- 2014-07-28 Sold (MLS) $38,000 MiRealSource-MiMLS
- 2014-07-06 Listing Removed — MiRealSource-MiMLS
- 2013-10-22 Listing Removed — REALCOMP
- 2013-10-22 Listing Removed — MiRealSource-MiMLS
- 2013-10-22 Listing Removed — MiRealSource-MiMLS
- 2013-10-22 Listed $38,000 REALCOMP
- 2013-10-22 Listed $38,000 MiRealSource-MiMLS
- 2013-10-22 Listed $38,000 MiRealSource-MiMLS
- 2013-09-03 Listed $40,000 REALCOMP
- 2013-09-03 Listed $40,000 MiRealSource-MiMLS
- 2013-09-03 Listed $40,000 MiRealSource-MiMLS
- 2013-08-31 Listing Removed — MiRealSource-MiMLS
- 2013-08-30 Listing Removed — MiRealSource-MiMLS
- 2013-08-30 Listing Removed — REALCOMP
- 2013-05-21 Listed $50,000 MiRealSource-MiMLS
- 2013-05-21 Listed $50,000 REALCOMP
- 2013-05-21 Listed $50,000 MiRealSource-MiMLS
- 2003-08-04 Listing Removed — REALCOMP
- 2003-07-10 Listing Removed — REALCOMP
- 2003-07-10 Listed $97,500 REALCOMP
- 2003-05-29 Listing Removed — REALCOMP
- 2003-05-29 Listed $97,500 REALCOMP
- 2003-04-12 Listed $97,500 REALCOMP
Property tax history
+6.3%/yrLatest (2025): $1,559 · -30.8% YoY. Source: county tax records.
Cash-flow waterfall
monthlySold comps — $/sqft
last 12 mo · ≤1 miLoading sold comps…