 Duplex
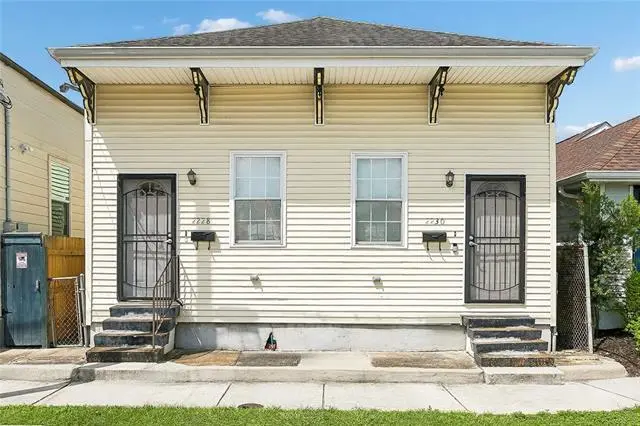
2228-2230 1st St · New Orleans, LA
Flood risk 8/10 · Major
- FEMA flood zone
- X
- Chance of flooding over 30 yrs
- 0.75%
- Est. flood insurance / yr
- $507 – $1,088
Fire risk 1/10 · Minimal
- Est. fire insurance / yr
- $1,269 – $2,357
Heat risk 10/10 · Severe
- Hot days now (above 108°F)
- 7 days/yr
- Hot days in 30 yrs
- 21 days/yr
Wind risk 10/10 · Severe
- Chance of severe wind over 30 yrs
- 99.0%
Air-quality risk 3/10 · Minor
- Unhealthy air days now
- 3 days/yr
- Unhealthy air days in 30 yrs
- 4 days/yr
Risk factors via First Street. Map © Google.
Why this score? — see what drove the A- grade
The composite is a weighted blend of 9 inputs, each scored 0–100. Each bar is that input's sub-score; the figure is the points it added to the 100-point composite (weight × sub-score).
- Cash flow +28.8/30.0
- ARV discount +13.8/15.0
- DSCR +10.0/10.0
- Appreciation +10.0/10.0
- 1% rule +8.0/10.0
- Rent growth +4.0/5.0
- Livability +4.0/5.0
- Condition / age +2.5/5.0
- Schools +1.6/10.0
$219,000
🖨 Deal sheet (PDF) 📄 Offer letter ✓ Due diligence
Multi-family units
County records classify this as Multi-Family (2-4 Unit). Listing-text estimate: 2 units. confirmed
Listing remarks
VACANT DUPLEX OPPORTUNITY Whether you are searching for an investment opportunity or a property with flexible living arrangements, this duplex offers strong potential in today’s market. The property features two 2-bedroom, 1-bath units with approximately 1,664 total living square feet. Major components, including the roof, HVAC systems, and water heaters, are reported to be in average to updated condition, helping support long-term functionality and maintenance considerations. This property may appeal to investors seeking income-producing potential, owner-occupants interested in multi-unit living arrangements, or buyers exploring future use flexibility, subject to buyer verification
Key facts
- 3,005 sq ft lot
- 2 parking spots
- Listed 2 days
Property features AI
Exterior
- Parking: 2 parking spaces; On-street parking; Open parking available
- Security: Smoke detector(s)
- Utilities: Public water; Public sewer
- Home design: Duplex residential income property
- Construction: Frame construction; Pillar/post/pier foundation; Built as a duplex
- Exterior features: Exterior lighting; Chain link and wood fencing; Shingle roof
Interior
- Flooring: Wood
- Heating & cooling: Central heating; Heat pump; Central air conditioning
- Interior features: Wood flooring; Lighting (exterior lighting noted under exterior); Smoke detector(s)
- Laundry & utility: Gas dryer hookup
Neighborhood map
What this means for you Summary
Snapshot
- This is a 2 × 2-bed/1-bath units multifamily listed at $219k.
Deal economics
- At list price, monthly cash flow is $668 ($8k/yr) — positive. Per door: $334/mo.
- The deal already cash-flows at list — no discount required.
- Meets the 1% rule at list price ($3k rent vs $219k).
- Cap rate 10.3% vs local median 4.4% in New Orleans — top-decile yield for the area; either an underpriced asset or a hidden risk that comps aren't pricing in. Stress-test before assuming the spread holds.
Location & tenants
- Location reads 81/100 on livability (#3 in LA, #1,383 nationally) — a professional / high-income tenant draw. Strengths: amenities A+, commute A+, health & safety A+; Watch: crime C-, employment D.
- Orleans Parish (urban): math 11% / reading 27% proficiency, ranked #69 of 98 in LA (top 70%) — low school quality limits family demand, transient renter base, plan for 1-2y turnover; 68% free/reduced lunch — lower-income household profile, screen leases tightly.
- Market conditions: Rents rising fast (+6.0%/yr); 137 active listings in the ZIP; 40 comparable units currently listed for rent nearby; rentals at typical pace (median 25d on market — plan ~3-4 weeks tenant-placement turnaround); lower-income renter base — watch delinquency; 710 units permitted in Orleans Parish in 2024 (244 in 5+ unit buildings).
- At $2,846/mo this rent would consume 87% of the median local household income ($39k/yr) (locally 714% of renters already pay >50% of income on rent) — very limited rent-growth headroom before tenants either downsize or default.
Forward outlook
- In year one you build about $23k of equity ($2k loan paydown + $22k appreciation (10.0% local appreciation)).
- Orleans County population projected at +61% by 2050 — long-run rental-demand tailwind backs the buy-and-hold thesis.
- At projected returns (10.0% appreciation + 6.0% rent growth), your $61k cash investment doubles in ~2 years — after that, you're playing with house money.
- By year 2, paydown + projected appreciation supports a ~$38k cash-out refi (75% LTV) — recoverable capital for the next deal without selling this one.
Negotiation context
- Only 3 days on market — expect competitive offers; lowballing is unlikely to land.
- 3 sale attempts with the ask held roughly flat each time — persistent listings suggest the price (not the market) is what's stuck; bring a comps-based counter.
Risks & watch-outs
- Watch-outs: flood insurance adds $66/mo; built in 1900 — expect roof / HVAC / electrical / plumbing capex.
- Climate carrying-cost: severe flood risk; severe wind risk, 99% chance of damaging wind over 30y; extreme-heat days projected 7→21/yr by 2055 (HVAC capex compounding) — expect insurance premiums to compound above CPI over the hold.
Questions for the listing agent
- Can we see the unit-by-unit rent roll, current vacancy, and any below-market leases? What's the average tenancy length?
- What capital expenditures (roof, boiler, parking lot, exteriors) have been made in the last 5 years, and what's planned in the next 2?
- Built in 1900 — when were the roof, HVAC, electrical panel, plumbing, and water heater last replaced?
- What's the actual annual flood-insurance premium (NFIP or private), and is the property in a SFHA with mandatory coverage?
- Is there a deadline driving the sale (1031 exchange, divorce, estate, relocation)? That informs how much negotiation room exists.
- What's the average days-on-market for RENTAL listings here right now (not sales)? A rising rental-DOM trend means longer vacancies and softer asking-rent achievability than the comps imply.
- What's the recent tenant-quality profile in this submarket — average credit score on applications, eviction rate, late-payment / NSF rate, and stable-employment percentage? A property-management company in the area should have these aggregated.
- How much new apartment / multifamily construction is in the pipeline within 1–3 miles? Heavy new supply (>2% of stock underway) typically softens rents 12–24 months out; light construction supports rent growth.
Investment metrics
- 1% rule
- 1.30% ✓
- Cap rate
- 10.32%
- Cash-on-cash
- 14.38%
- DSCR
- 1.64
- GRM
- 6.4
CMA / ARV
- ARV (on-the-fly)
- $254,592
- Comps found
- 12
Show comp detail 12 sales within ~0.75 mi
| Address | Dist | Beds/Ba | Sqft | Sold | Price | $/sf | Match |
|---|---|---|---|---|---|---|---|
| 2113 15 S Liberty St | 0.19mi | 4/2.0 | 1,624 (-2%) | 10mo | $228,500 | $141 | 78 |
| 1809 11 Third St | 0.31mi | 4/2.0 | 1,585 (-5%) | 1mo | $260,000 | $164 | 77 |
| 718 20 Fourth St | 0.17mi | 4/2.0 | 1,596 (-4%) | 13mo | $270,000 | $169 | 75 |
| 2219 21 Toledano St | 0.44mi | 4/2.0 | 1,640 (-1%) | 4mo | $232,000 | $141 | 74 |
| 2624-2626 Jackson Ave | 0.35mi | 4/2.0 | 1,713 (+3%) | 6mo | $159,900 | $93 | 73 |
| 2620-22 Philip St | 0.27mi | 4/2.0 | 1,472 (-12%) | 8mo | $159,000 | $108 | 61 |
| 1713 15 8th St | 0.54mi | 4/2.0 | 1,750 (+5%) | 7mo | $280,000 | $160 | 60 |
| 3511 13 Third St | 0.61mi | 4/2.0 | 1,680 (+1%) | 12mo | $80,000 | $48 | 60 |
| 2223 25 Felicity St | 0.32mi | 4/2.0 | 1,465 (-12%) | 9mo | $155,000 | $106 | 57 |
| 2521 23 Carondelet St | 0.37mi | 4/2.5 | 1,873 (+13%) | 6mo | $490,000 | $262 | 55 |
| 2514-16 Second St | 0.21mi | 4/3.0 | 1,910 (+15%) | 12mo | $293,000 | $153 | 51 |
| 1930-1932 Delachaise St | 0.66mi | 4/2.0 | 1,467 (-12%) | 22mo | $350,000 | $239 | 32 |
Match score weights: distance 35% · size 25% · config 20% · recency 20%. Top-matched comps best support the ARV.
Projected returns pro-forma
10.0% appreciation · 5.98% rent growth · sell at horizon
- IRR
- 35.4%
- Equity multiple
- 3.78×
- Total profit
- $170,717
- Equity at exit
- $197,293
- IRR
- 31.6%
- Equity multiple
- 8.98×
- Total profit
- $489,531
- Equity at exit
- $425,469
Cash invested: $61,320 (down + closing). Projections, not guarantees.
Landlord ↔ Tenant lean methodology
- Overall (STATE)
- 90 Strongly Landlord-Friendly
- State Louisiana
- 90 Strongly Landlord-Friendly · R+12
- County
- — inherits STATE
- City
- — inherits STATE
ZIP-level market 70113
- Rents YoY
- 6.0%
- Active inventory
- 137
- Price-to-rent
- 12.8×
Monthly cashflow live
- Estimated rent
- $2,846 high interval (Pro) →
- Mortgage (P&I)
- −$1,148
- Tax est. 1.5%
- −$274 /mo · $3,285/yr
- Insurance
- −$91
- Flood insurance flood zone
- −$66 /mo · $798/yr
- HOA
- −$0
- Vacancy / Maint / Mgmt
- −$598
- Net cashflow
- $668
Break-even live
Sensitivity live
| Price | -10% $820 | -5% $744 | +0% $668 | +5% $593 | +10% $517 |
|---|---|---|---|---|---|
| Rent | -10% $444 | -5% $556 | +0% $668 | +5% $781 | +10% $893 |
| Rate | -1.0pp $779 | -0.5pp $724 | base $668 | +0.5pp $612 | +1.0pp $554 |
2-unit breakdown (identical units grouped — click to expand)
| Units | Beds | Baths | Est. rent |
|---|---|---|---|
| 2× units | 2 | 1 | $2,846 |
| #1 | 2 | 1 | $1,423 |
| #2 | 2 | 1 | $1,423 |
| Total (2 units) | $2,846 | ||
UW: 25.0% down · 7.5% · 30yr · 1.5% tax · 5.0% vac · 8.0% maint · 8.0% mgmt
Financing live
Cash to close
- Down payment
- $54,750
- Closing costs
- $6,570
- Reserves months
- —
- Total cash needed
- —
Loan-product check · same deal, 3 products live
Conventional
25% down · 7.5% · 30yr
- Down + closing
- —
- Monthly P&I
- —
- Monthly cashflow
- —
- DSCR
- —
- Eligible?
- —
Personal DTI + credit; lowest rate.
DSCR
20% down · 8.5% · 30yr
- Down + closing
- —
- Monthly P&I
- —
- Monthly cashflow
- —
- DSCR
- —
- Eligible?
- —
No personal income docs; deal must DSCR.
Hard money
10% down · 12.0% · 12mo
- Down + closing
- —
- Monthly P&I
- —
- Monthly cashflow
- —
- DSCR
- —
- Eligible?
- —
Short-term bridge; refi at stabilization.
Rent comps 40 comps
| Address | Beds | Baths | Sqft | Rent | $/sqft | DOM | Units | Dist |
|---|---|---|---|---|---|---|---|---|
| 2225 2nd St New Orleans, LA | 3.0 | 2.0 | 1100 | $1,800 | $1.64 | 24d | 1 | 0.02mi |
| 2403 S Saratoga St New Orleans, LA | 3.0 | 2.5 | 1600 | $2,500 | $1.56 | 24d | 1 | 0.10mi |
| 2231 S Liberty St New Orleans, LA | 3.0 | 3.5 | 1752 | $2,000 | $1.14 | 17d | 1 | 0.12mi |
| 2107 Fourth St New Orleans, LA | 3.0 | 1.0 | 1292 | $1,775 | $1.37 | 17d | 1 | 0.17mi |
| 1944 Jackson Ave New Orleans, LA | 3.0 | 2.5 | 1572 | $2,500 | $1.59 | 44d | 1 | 0.18mi |
| 2717 Loyola Ave New Orleans, LA | 3.0 | 2.0 | 1250 | $2,300 | $1.84 | 2d | 1 | 0.19mi |
| 2717 Loyola Ave New Orleans, LA | 3.0 | 2.0 | 1232 | $2,300 | $1.87 | 24d | 1 | 0.19mi |
| 1915 Philip St New Orleans, LA | 3.0 | 1.5 | 1300 | $2,450 | $1.88 | 24d | 1 | 0.19mi |
| 2123 S Liberty St Unit 2125 New Orleans, LA | 3.0 | 2.0 | 1500 | $2,100 | $1.40 | 4d | 1 | 0.19mi |
| 2301 Dryades St New Orleans, LA | 3.0 | 3.0 | 2070 | $3,000 | $1.45 | 3d | 1 | 0.22mi |
| 2102 Josephine St New Orleans, LA | 4.0 | 2.0 | 1286 | $2,100 | $1.63 | 24d | 1 | 0.22mi |
| 2733 Danneel St New Orleans, LA | 4.0 | 2.0 | 1350 | $1,775 | $1.31 | 24d | 1 | 0.26mi |
| 2608 Magnolia St New Orleans, LA | 4.0 | 2.5 | 1950 | $3,200 | $1.64 | 44d | 1 | 0.31mi |
| 2625 Baronne St Unit 1 New Orleans, LA | 3.0 | 1.5 | 2100 | $2,600 | $1.24 | 44d | 1 | 0.32mi |
| 2713 Baronne St New Orleans, LA | 3.0 | 2.5 | 1600 | $2,300 | $1.44 | 24d | 1 | 0.33mi |
| 2318 Martin Luther King Junior Blvd New Orleans, LA | 3.0 | 2.0 | 1400 | $1,700 | $1.21 | 24d | 1 | 0.42mi |
| 2526 Martin Luther King Junior Blvd New Orleans, LA | 3.0 | 2.0 | 1200 | $2,200 | $1.83 | 4d | 1 | 0.44mi |
| 2931 Baronne St New Orleans, LA | 3.0 | 1.0 | 1145 | $1,510 | $1.32 | 24d | 1 | 0.47mi |
| 3212 Danneel St New Orleans, LA | 3.0 | 2.0 | 1945 | $2,000 | $1.03 | 24d | 1 | 0.48mi |
| 2722 Martin L King Bl New Orleans, LA | 3.0 | 2.5 | 1350 | $1,800 | $1.33 | 24d | 1 | 0.48mi |
| 1407 Magnolia St New Orleans, LA | 3.0 | 2.0 | 1824 | $1,500 | $0.82 | 24d | 1 | 0.53mi |
| 3108 Second St New Orleans, LA | 3.0 | 3.0 | 1216 | $2,100 | $1.73 | 4d | 1 | 0.60mi |
| 3120 Second St New Orleans, LA | 3.0 | 3.0 | 1256 | $2,050 | $1.63 | 24d | 1 | 0.62mi |
| 3435 Magnolia St New Orleans, LA | 3.0 | 1.0 | 1050 | $1,500 | $1.43 | 24d | 1 | 0.62mi |
| 2539 Amelia St New Orleans, LA | 3.0 | 2.0 | 1296 | $2,200 | $1.70 | 24d | 1 | 0.62mi |
| 3122 2nd St New Orleans, LA | 3.0 | 3.0 | 1206 | $2,075 | $1.72 | 24d | 1 | 0.62mi |
| 3429 Clara St New Orleans, LA | 3.0 | 2.0 | 1620 | $2,350 | $1.45 | 15d | 1 | 0.65mi |
| 2833 S Derbigny St New Orleans, LA | 3.0 | 2.0 | 1500 | $1,795 | $1.20 | 24d | 1 | 0.66mi |
| 3429 Baronne St New Orleans, LA | 3.0 | 2.5 | 1600 | $2,500 | $1.56 | 44d | 1 | 0.66mi |
| 1410 6th St New Orleans, LA | 3.0 | 2.0 | 1400 | $5,000 | $3.57 | 16d | 1 | 0.69mi |
| 1201 Baronne St #1 New Orleans, LA | 3.0 | 2.5 | 1892 | $2,700 | $1.43 | 17d | 1 | 0.71mi |
| 3044 Louisiana Avenue Pkwy New Orleans, LA | 3.0 | 2.0 | 1800 | $1,900 | $1.06 | 24d | 1 | 0.73mi |
| 2535 Marengo St New Orleans, LA | 3.0 | 1.0 | 1300 | $1,200 | $0.92 | 15d | 1 | 0.74mi |
| 1525 Melpomene St Unit Na New Orleans, LA | 3.0 | 1.5 | 1700 | $4,000 | $2.35 | 44d | 1 | 0.74mi |
| 3218 Jackson Ave New Orleans, LA | 3.0 | 2.0 | 1267 | $1,750 | $1.38 | 24d | 1 | 0.75mi |
| 3035 Delachaise St New Orleans, LA | 3.0 | 1.0 | 1968 | $1,750 | $0.89 | 2d | 1 | 0.76mi |
| 2614 S Johnson St New Orleans, LA | 3.0 | 2.0 | 1536 | $2,079 | $1.35 | 15d | 1 | 0.76mi |
| 1306 Felicity St Unit C New Orleans, LA | 3.0 | 3.0 | 1500 | $2,450 | $1.63 | 17d | 1 | 0.78mi |
| 3208 Louisiana Avenue Pkwy New Orleans, LA | 3.0 | 2.0 | 1391 | $1,900 | $1.37 | 17d | 1 | 0.79mi |
| 1204 Saint Andrew St Unit 1204 New Orleans, LA | 3.0 | 2.0 | 1600 | $2,300 | $1.44 | 24d | 1 | 0.80mi |
Listing history 5 events
-
2026-06-03days on market $219,000 Active 3 DOM
-
2026-06-02days on market $219,000 Active 2 DOM
-
2026-06-01statusdays on market $219,000 Active 1 DOM
-
2026-05-31days on market $219,000 Coming Soon 8 DOM
-
2026-05-13$235,000 Active
ⓘ Source: listings_history table (triggers on properties + properties_extension) + one-shot
backfill from property_details.listing_events for pre-trigger history.
Climate risk First Street
- Flood 8/10 Severe FEMA zone X · 75% chance over 30 yrs
- Wildfire 1/10 Low
- Heat 10/10 Extreme 7 d/yr ≥108°F today · 21 d/yr by 30 yrs out
- Wind 10/10 Extreme 99% chance of damaging wind over 30 yrs
- Air quality 3/10 Moderate 3 unhealthy d/yr today · 4 by 30 yrs out
Nearby sold comps map
Loading sold comps map…
Walkable amenities ~0.75 mi
Loading nearby amenities…
Taxation est. · year 1
- Rental income
- $34,152
- − Mortgage interest
- −$12,267
- − Property taxes
- −$3,285
- − Insurance
- −$1,892
- − Repairs & maintenance
- −$2,732
- − Management
- −$2,732
- − Depreciation
- −$6,371
- Taxable income
- $4,872
- Est. tax owed @ 24.0%
- −$1,169
- After-tax cash flow
- $6,852/yr
For passive investors: Depreciation is non-cash, so a rental often shows a tax loss while cash-flowing — sheltering income. Rental losses are passive: they offset passive income freely, and up to $25,000/yr can offset ordinary (W-2) income if you actively participate and your MAGI is under $100k (phasing out to $0 by $150k); unused losses carry forward. On sale, claimed depreciation is recaptured at up to 25%, and gains may owe capital-gains tax (a 1031 exchange can defer both). Figures are a year-1 estimate at your 24.0% rate — not tax advice; consult a CPA.
Schools (NCES district)
- District
- Orleans Parish
- NCES district ID
- 2201170
- Math proficiency
- 11% ▼ -52.00%
- Reading proficiency
- 27% ▼ -46.00%
- Median HH income
- $37,011
- Composite
- 15.78/100
- National rank
- #9271
- State rank
- #69 of 98 in LA
Livability — New Orleans
- Score
- 81/100
- State rank
- #3
- US rank
- #1383
Category grades
Schools grade is shown separately in the Schools card above.
Census & demographics
- Census place
- New Orleans, LA
- County
- Orleans Parish · 338,817 people
- City population
- 338,817
- Metro
- New Orleans-Metairie, LA
- Population (ZIP)
- 9,387
- Household income
- $39,333
- Rent vs Own
- Severe rent burden
- 714.0
Population outlook (Orleans County) Hauer SSP2
- Today (2025)
- 513,025 people
- By 2030
- 575,781 · +12.2%
- By 2040
- 700,174 · +36.5%
- By 2050
- 826,541 · +61.1%
- By 2075
- 1,123,374 · +119.0%
- By 2100
- 1,355,609 · +164.2%
Race, ethnicity, and origin ACS 2023
- Neighborhood character
- Diverse neighborhood (Simpson 0.57)
- Race & ethnicity
- Black 61% White 20% Hispanic / Latino 13% Two or more races 11% Asian 2%
- Hispanic origin (detail)
- Mexican 2%
- Common ancestry
- Lithuanian 2% Portuguese 1% Slovak 1%
- Foreign-born
- 13% · Canada, Vietnam, China
- Languages at home
- 86% English-only · Spanish 11% Other Indo-European 1% Vietnamese 1%
Political lean MEDSL · Orleans
- 2024 margin
- Solid D (+67.0) · D 82.2% · R 15.2% · Other 2.7%
- 2008→2024 swing
- +6.7pp toward D · 2008: 60.3pp · 2024: 67.0pp
- All cycles
- 2024: D+67.0 2020: D+68.2 2016: D+66.2 2012: D+62.5 2008: D+60.3
Not yet ingested
- Civics
- —
Market trends
- HPI YoY
- ▲ 65.92%
- Current HPI
- 229.3968
- Rent YoY
- ▲ 5.98%
- Metro
- New Orleans-Metairie, LA
- State GDP YoY
- ▲ 3.29%
- F500 in state
- 10
Industry mix (Fortune 500 HQ in LA)
| Industry | F500 HQs | Revenue |
|---|---|---|
| Telecommunications | 2 | $23B |
|
||
| Utilities | 1 | $12B |
|
||
| Wholesale / Distribution | 1 | $5B |
|
||
| Advertising | 1 | $2B |
|
||
Price history
-6.8% since first listed5 events — show timeline
- 2026-05-31 Listed $219,000 AcadianaMLS
- 2026-05-31 Listed $219,000 GBRMLS
- 2026-05-24 Coming Soon — AcadianaMLS
- 2026-05-23 Coming Soon — GBRMLS
- 2026-05-13 Listed $235,000 AcadianaMLS
Property tax history
+0.8%/yrLatest (2026): $85 · +0.0% YoY. Source: county tax records.
Cash-flow waterfall
monthlySold comps — $/sqft
last 12 mo · ≤1 miLoading sold comps…