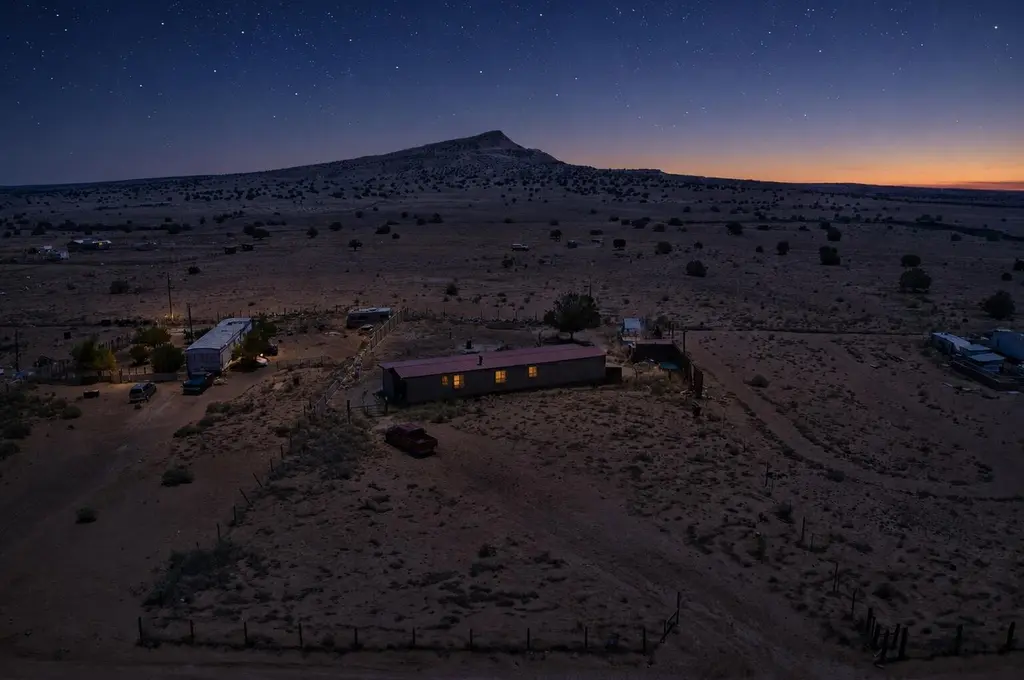
36 San Simon Rd · Highland Meadows, NM
Flood risk 1/10 · Minimal
- FEMA flood zone
- X (unshaded)
- Chance of flooding over 30 yrs
- 0.0%
- Est. flood insurance / yr
- $507 – $1,088
Fire risk 3/10 · Minor
- Est. fire insurance / yr
- $706 – $1,312
Heat risk 5/10 · Moderate
- Hot days now (above 94°F)
- 7 days/yr
- Hot days in 30 yrs
- 19 days/yr
Wind risk 1/10 · Minimal
- Chance of severe wind over 30 yrs
- —
Air-quality risk 2/10 · Minimal
- Unhealthy air days now
- 0 days/yr
- Unhealthy air days in 30 yrs
- 1 days/yr
Risk factors via First Street. Map © Google.
Why this score? — see what drove the B grade
The composite is a weighted blend of 9 inputs, each scored 0–100. Each bar is that input's sub-score; the figure is the points it added to the 100-point composite (weight × sub-score).
- Cash flow +30.0/30.0
- 1% rule +10.0/10.0
- DSCR +10.0/10.0
- ARV discount +7.5/15.0
- Appreciation +5.0/10.0
- Schools +2.6/10.0
- Rent growth +2.5/5.0
- Condition / age +2.5/5.0
- Livability +2.2/5.0
$70,000
🖨 Deal sheet 📄 Offer letter ✓ Due diligence
Listing remarks
Escape to peaceful country living on this beautiful 1-acre property featuring breathtaking views of New Mexico nature and unforgettable star-filled night skies. This 3-bedroom, 2-bath home offers privacy, tranquility, and multiple storage buildings for added functionality. Recently upgraded with a newly installed septic tank and serviced by a shared well. Enjoy the quiet lifestyle of rural living while staying conveniently located just 15-20 minutes from the Walmart Distribution Center and approximately 20 minutes from Route 66 Casino, with easy access to Albuquerque and Los Lunas. Owner-to-owner financing available. THIS PROPERTY IS NOT ON TRIBAL LAND. IT IS CONSIDERED IN VALENCIA COUNTY.
Key facts
- 1 acre lot
- Built 1983
- Listed 4 days
Property features AI
Exterior
- Utilities: Electricity connected; Propane; Phone connected; Shared well; Septic tank
- Home design: Single-story; Faces west; Resale property
- Construction: Frame construction with vinyl siding; Metal pitched roof; Custom builder; Mobile home dimensions approximately 12' x 18'
- Exterior features: Private yard; Owned propane tank; Full fencing; On-site storage
Interior
- Kitchen: Free-standing gas range; Refrigerator
- Bedrooms: Primary bedroom on the main level
- Flooring: Carpet; Laminate; Vinyl
- Bathrooms: 2 full bathrooms
- Heating & cooling: Pellet stove; Wall furnace; Has heating
- Interior features: Ceiling fan(s); Main level primary; Single-pane windows
- Laundry & utility: Electric dryer hookup
Neighborhood map
What this means for you Summary
Snapshot
- This is a 3-bed/2.0-bath other listed at $70k.
Deal economics
- At list price, monthly cash flow is $538 ($6k/yr) — positive.
- The deal already cash-flows at list — no discount required.
- Meets the 1% rule at list price ($1k rent vs $70k).
Location & tenants
- Location reads 44/100 on livability (#354 in NM) — a working-class tenant base; expect higher turnover. Strengths: cost of living A+, crime A; Watch: schools F, amenities F, commute F.
- Los Lunas Public Schools (suburban): math 20% / reading 34% proficiency, ranked #34 of 95 in NM (top 36%) — low school quality limits family demand, transient renter base, plan for 1-2y turnover; 63% free/reduced lunch — lower-income household profile, screen leases tightly.
- Market conditions: 12 active listings in the ZIP; 1 comparable units currently listed for rent nearby; 303 units permitted in Valencia County in 2024 (0 in 5+ unit buildings).
Forward outlook
- In year one you build about $3k of equity ($484 loan paydown + $2k appreciation (3.0% local appreciation)).
- Valencia County population projected at -14% by 2050 — secular population decline; favor cash flow + early exit over multi-decade hold.
- At projected returns (3.0% appreciation + 3.0% rent growth), your $20k cash investment doubles in ~3 years — after that, you're playing with house money.
Negotiation context
- Only 4 days on market — expect competitive offers; lowballing is unlikely to land.
- 3 sale attempts since 2y ago with the ask held roughly flat each time — persistent listings suggest the price (not the market) is what's stuck; bring a comps-based counter.
Risks & watch-outs
- Climate carrying-cost: extreme-heat days projected 7→19/yr by 2055 (HVAC capex compounding) — expect insurance premiums to compound above CPI over the hold.
Questions for the listing agent
- Is there a deadline driving the sale (1031 exchange, divorce, estate, relocation)? That informs how much negotiation room exists.
- Schools are F-rated, which usually means shorter tenancies and higher turnover. Who's the typical renter profile here, and what's been the actual vacancy rate?
- What's the average days-on-market for RENTAL listings here right now (not sales)? A rising rental-DOM trend means longer vacancies and softer asking-rent achievability than the comps imply.
- What's the recent tenant-quality profile in this submarket — average credit score on applications, eviction rate, late-payment / NSF rate, and stable-employment percentage? A property-management company in the area should have these aggregated.
- How much new for-sale + rental construction is in the pipeline within 1–3 miles? Heavy new supply typically softens prices + rents 12–24 months out; constrained supply supports both.
Investment metrics
- 1% rule
- 1.71% ✓
- Cap rate
- 15.51%
- Cash-on-cash
- 32.91%
- DSCR
- 2.46
- GRM
- 4.9
CMA / ARV
No comps found within radius.
Projected returns pro-forma
3.0% appreciation · 3.0% rent growth · sell at horizon
- IRR
- 38.6%
- Equity multiple
- 3.18×
- Total profit
- $42,645
- Equity at exit
- $31,475
- IRR
- 38.6%
- Equity multiple
- 6.30×
- Total profit
- $103,800
- Equity at exit
- $48,507
Cash invested: $19,600 (down + closing). Projections, not guarantees.
Landlord ↔ Tenant lean methodology
- Overall (STATE)
- 55 Moderately Landlord-Leaning
- State New Mexico
- 55 Moderately Landlord-Leaning · D+3
- County
- — inherits STATE
- City
- — inherits STATE
ZIP-level market 87026
- Active inventory
- 12
- Price-to-rent
- 4.9×
Monthly cashflow live
- Estimated rent
- $1,200 medium interval (Pro) →
- Mortgage (P&I)
- −$367
- Tax from tax record
- −$14 /mo · $170/yr
- Insurance
- −$29
- HOA
- −$0
- Vacancy / Maint / Mgmt
- −$252
- Net cashflow
- $538
Break-even live
UW: 25.0% down · 7.5% · 30yr · 1.5% tax · 5.0% vac · 8.0% maint · 8.0% mgmt
Financing live
Cash to close
- Down payment
- $17,500
- Closing costs
- $2,100
- Reserves months
- —
- Total cash needed
- —
Loan-product check · same deal, 3 products live
Conventional
25% down · 7.5% · 30yr
- Down + closing
- —
- Monthly P&I
- —
- Monthly cashflow
- —
- DSCR
- —
- Eligible?
- —
Personal DTI + credit; lowest rate.
DSCR
20% down · 8.5% · 30yr
- Down + closing
- —
- Monthly P&I
- —
- Monthly cashflow
- —
- DSCR
- —
- Eligible?
- —
No personal income docs; deal must DSCR.
Hard money
10% down · 12.0% · 12mo
- Down + closing
- —
- Monthly P&I
- —
- Monthly cashflow
- —
- DSCR
- —
- Eligible?
- —
Short-term bridge; refi at stabilization.
Rent comps 1 comps
| Address | Beds | Baths | Sqft | Rent | $/sqft | DOM | Units | Dist |
|---|---|---|---|---|---|---|---|---|
| 45 Baca Laguna, NM | 2.0 | 2.0 | 940 | $1,200 | $1.28 | 1d | 1 | 1.34mi |
Listing history 5 events
-
2026-06-18days on market $70,000 Active 4 DOM
-
2026-06-17days on market $70,000 Active 3 DOM
-
2026-06-16days on market $70,000 Active 2 DOM
-
2026-06-15remarks 699-char remark
-
2026-06-15$70,000 Active 1 DOM
ⓘ Source: listings_history table (triggers on properties + properties_extension) + one-shot
backfill from property_details.listing_events for pre-trigger history.
Tax reassessment forecast NM · Resets to sale price
- Current annual tax
- $170 · $14/mo
- Projected year-2 tax
- $560 · $47/mo
- Expected delta
- +$390/yr (+$33/mo · 229.6%)
ⓘ Screening estimate from a state-policy table — verify with the county assessor before closing.
Climate risk First Street
- Flood 1/10 Low FEMA zone X (unshaded) · 0% chance over 30 yrs
- Wildfire 3/10 Moderate
- Heat 5/10 Major 7 d/yr ≥94°F today · 19 d/yr by 30 yrs out
- Wind 1/10 Low
- Air quality 2/10 Low 0 unhealthy d/yr today · 1 by 30 yrs out
Nearby sold comps map
Loading sold comps map…
Walkable amenities ~0.75 mi
Loading nearby amenities…
Taxation est. · year 1
- Rental income
- $14,400
- − Mortgage interest
- −$3,921
- − Property taxes
- −$170
- − Insurance
- −$350
- − Repairs & maintenance
- −$1,152
- − Management
- −$1,152
- − Depreciation
- −$2,036
- Taxable income
- $5,619
- Est. tax owed @ 24.0%
- −$1,348
- After-tax cash flow
- $5,103/yr
For passive investors: Depreciation is non-cash, so a rental often shows a tax loss while cash-flowing — sheltering income. Rental losses are passive: they offset passive income freely, and up to $25,000/yr can offset ordinary (W-2) income if you actively participate and your MAGI is under $100k (phasing out to $0 by $150k); unused losses carry forward. On sale, claimed depreciation is recaptured at up to 25%, and gains may owe capital-gains tax (a 1031 exchange can defer both). Figures are a year-1 estimate at your 24.0% rate — not tax advice; consult a CPA.
Schools (NCES district)
- District
- Los Lunas Public Schools
- NCES district ID
- 3501680
- Math proficiency
- 20% —
- Reading proficiency
- 34% —
- Median HH income
- $44,438
- Composite
- 26.11/100
- National rank
- #12724
- State rank
- #34 of 95 in NM
Livability — Highland Meadows
- Score
- 44/100
- State rank
- #354
- US rank
- #26726
Category grades
Schools grade is shown separately in the Schools card above.
Census & demographics
- Census place
- Highland Meadows, NM
- Population (ZIP)
- 3,465
Population outlook (Valencia County) Hauer SSP2
- Today (2025)
- 73,788 people
- By 2030
- 72,101 · -2.3%
- By 2040
- 67,930 · -7.9%
- By 2050
- 63,191 · -14.4%
- By 2075
- 53,644 · -27.3%
- By 2100
- 40,882 · -44.6%
Race, ethnicity, and origin ACS 2023
- Neighborhood character
- Highly diverse neighborhood (Simpson 0.99)
- Race & ethnicity
- Native American 84% White 8% Hispanic / Latino 5% Two or more races 5%
- Common ancestry
- Italian 1%
- Languages at home
- 56% English-only · Spanish 2%
Political lean MEDSL · Valencia
- 2024 margin
- R (+16.4) · D 40.9% · R 57.3% · Other 1.8%
- 2008→2024 swing
- -24.1pp toward R · 2008: 7.7pp · 2024: -16.4pp
- All cycles
- 2024: R+16.4 2020: R+9.6 2016: R+8.7 2012: D+2.5 2008: D+7.7
Not yet ingested
- Civics
- —
Market trends
- HPI YoY
- —
- Current HPI
- —
- Rent YoY
- —
- Metro
- —
- State GDP YoY
- —
- F500 in state
- 0
Price history
-16.7% since first listed9 events — show timeline
- 2026-06-14 Relisted — Southwest MLS
- 2026-06-05 Delisted — Southwest MLS
- 2026-06-05 Listed $70,000 Southwest MLS
- 2026-06-01 Price Changed $70,000 Southwest MLS
- 2024-10-03 Sold (Public Records) — Public Records
- 2024-10-02 Sold (Public Records) — Public Records
- 2024-08-29 Pending — Southwest MLS
- 2024-06-01 Listed $84,000 Southwest MLS
- 2004-04-26 Sold (Public Records) — Public Records
Property tax history
+1.0%/yrLatest (2025): $170 · +23.4% YoY. Source: county tax records.
Cash-flow waterfall
monthlySold comps — $/sqft
last 12 mo · ≤1 miLoading sold comps…