102 Turnbull Ln · Perry, PA
Flood risk 9/10 · Severe
- FEMA flood zone
- X (unshaded)
- Chance of flooding over 30 yrs
- 0.98%
- Est. flood insurance / yr
- $473 – $860
Fire risk 1/10 · Minimal
- Est. fire insurance / yr
- $511 – $949
Heat risk 3/10 · Minor
- Hot days now (above 97°F)
- 7 days/yr
- Hot days in 30 yrs
- 18 days/yr
Wind risk 2/10 · Minimal
- Chance of severe wind over 30 yrs
- —
Air-quality risk 2/10 · Minimal
- Unhealthy air days now
- 1 days/yr
- Unhealthy air days in 30 yrs
- 2 days/yr
Risk factors via First Street. Map © Google.
Why this score? — see what drove the B grade
The composite is a weighted blend of 9 inputs, each scored 0–100. Each bar is that input's sub-score; the figure is the points it added to the 100-point composite (weight × sub-score).
- Cash flow +30.0/30.0
- 1% rule +10.0/10.0
- DSCR +10.0/10.0
- ARV discount +7.5/15.0
- Appreciation +5.0/10.0
- Schools +3.3/10.0
- Rent growth +2.5/5.0
- Livability +2.5/5.0
- Condition / age +2.5/5.0
$59,900
🖨 Deal sheet 📄 Offer letter ✓ Due diligence
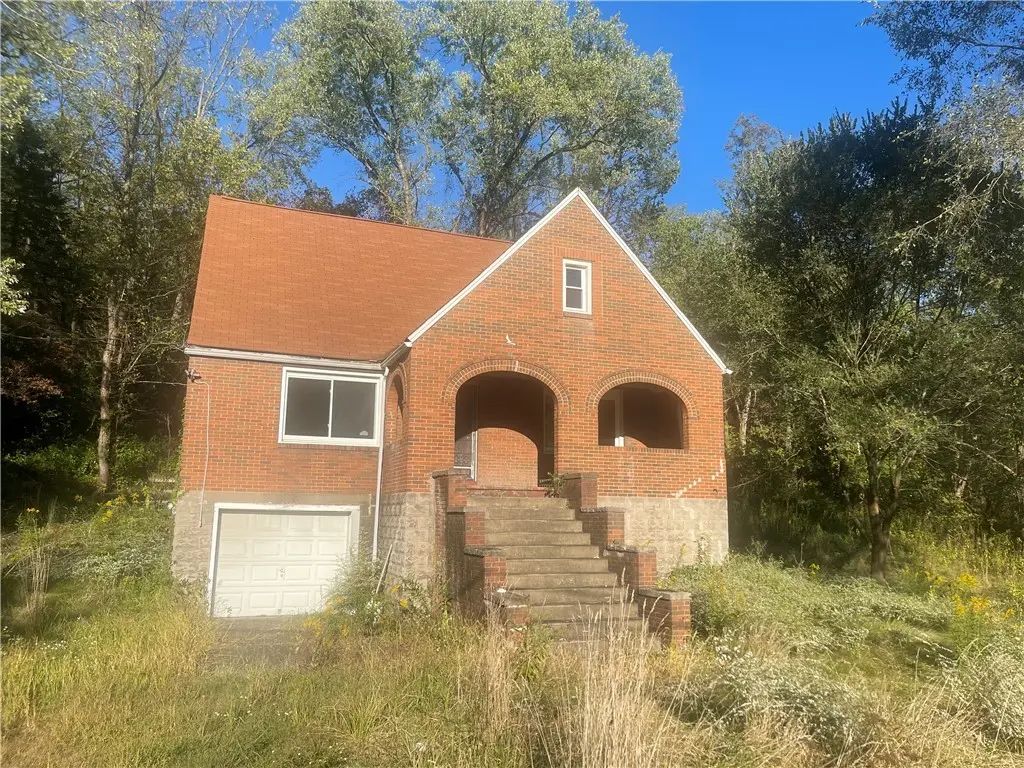
Listing remarks MLS
Investor Alert! Great 3 bedroom brick single with covered front porch, attached garage, rear covered porch, lots of original hardwood floors and wood trim, was partially renovated just need to come in and finish. New wall to wall carpet in upstairs bedrooms. Being sold in as-is condition.
Key facts
- Covered front porch
- Wood trim
- Rear covered porch
Tags
Neighborhood map
What this means for you Summary
Snapshot
- This is a 3-bed/1.5-bath single-family listed at $60k.
Deal economics
- At list price, monthly cash flow is $319 ($4k/yr) — positive.
- The deal already cash-flows at list — no discount required.
- Meets the 1% rule at list price ($1k rent vs $60k).
- Recommended offer: $53k (12.0% below list) — sets the bar for market timing.
Location & tenants
- Location reads: area grade B — affects rentability + tenant quality, not the cash-flow math above.
- Frazier SD (rural): math 25% / reading 52% proficiency, ranked #371 of 539 in PA (top 69%) — families likely to look elsewhere, expect single-tenant / working-renter base with shorter leases.
- Market conditions: 1 active listings in the ZIP; 201 units permitted in Fayette County in 2024 (10 in 5+ unit buildings).
Forward outlook
- In year one you build about $2k of equity ($414 loan paydown + $2k appreciation (3.0% local appreciation)).
- Fayette County population projected at -19% by 2050 — secular population decline; favor cash flow + early exit over multi-decade hold.
- At projected returns (3.0% appreciation + 3.0% rent growth), your $17k cash investment doubles in ~3 years — after that, you're playing with house money.
Negotiation context
- It's been on market 133 days — a 12% lower offer ($53k) is reasonable based on typical stale-listing flexibility.
- Current owner paid $35k; list at $60k implies a 71% gain — meaningful room to come down on a strong offer.
Risks & watch-outs
- Watch-outs: property tax is 2.7% of price; flood insurance adds $56/mo; built in 1948 — expect roof / HVAC / electrical / plumbing capex.
- Climate carrying-cost: severe flood risk — expect insurance premiums to compound above CPI over the hold.
Questions for the listing agent
- It's been on market 133 days. Have you received any prior offers? Is the seller open to a 12% concession, seller financing, or rate buy-down credit?
- Built in 1948 — when were the roof, HVAC, electrical panel, plumbing, and water heater last replaced?
- Property tax is high relative to price — has the assessment been appealed recently, and will the sale trigger a re-assessment?
- What's the actual annual flood-insurance premium (NFIP or private), and is the property in a SFHA with mandatory coverage?
- Why hasn't it sold? Are there any deal-killer items the seller is aware of (foundation, flood, title, zoning, code violations)?
- Is there a deadline driving the sale (1031 exchange, divorce, estate, relocation)? That informs how much negotiation room exists.
- What's the average days-on-market for RENTAL listings here right now (not sales)? A rising rental-DOM trend means longer vacancies and softer asking-rent achievability than the comps imply.
- What's the recent tenant-quality profile in this submarket — average credit score on applications, eviction rate, late-payment / NSF rate, and stable-employment percentage? A property-management company in the area should have these aggregated.
- How much new for-sale + rental construction is in the pipeline within 1–3 miles? Heavy new supply typically softens prices + rents 12–24 months out; constrained supply supports both.
Investment metrics
- 1% rule
- 1.80% ✓
- Cap rate
- 13.80%
- Cash-on-cash
- 26.81%
- DSCR
- 2.19
- GRM
- 4.6
CMA / ARV
- ARV (median comp)
- $120,654
- List price
- $59,900
- Delta
- -50.35%
- Verdict
- UNDERPRICED
- Comps
- 8 within 1.0 mi
Show comp detail 2 sales within ~0.75 mi
| Address | Dist | Beds/Ba | Sqft | Sold | Price | $/sf | Match |
|---|---|---|---|---|---|---|---|
| 3879 Pittsburgh Rd | 0.37mi | 4/2.0 (+1) | 1,080 (-0%) | 10mo | $150,000 | $139 | 66 |
| 337 Wickhaven Rd | 0.21mi | 2/1.0 (-1) | 1,167 (+8%) | 8mo | $70,000 | $60 | 63 |
Match score weights: distance 35% · size 25% · config 20% · recency 20%. Top-matched comps best support the ARV.
Projected returns pro-forma
3.0% appreciation · 3.0% rent growth · sell at horizon
- IRR
- 29.1%
- Equity multiple
- 2.65×
- Total profit
- $27,637
- Equity at exit
- $26,934
- IRR
- 29.6%
- Equity multiple
- 5.17×
- Total profit
- $70,021
- Equity at exit
- $41,508
Cash invested: $16,772 (down + closing). Projections, not guarantees.
Landlord ↔ Tenant lean methodology
- Overall (STATE)
- 62 Landlord-Friendly
- State Pennsylvania
- 62 Landlord-Friendly · EVEN
- County
- — inherits STATE
- City
- — inherits STATE
ZIP-level market 15492
- Active inventory
- 1
- Price-to-rent
- 4.6×
Monthly cashflow live
- Estimated rent
- $1,077 medium interval (Pro) →
- Mortgage (P&I)
- −$314
- Tax from tax record
- −$137 /mo · $1,647/yr
- Insurance
- −$25
- Flood insurance flood zone
- −$56 /mo · $666/yr
- HOA
- −$0
- Vacancy / Maint / Mgmt
- −$226
- Net cashflow
- $319
Break-even live
UW: 25.0% down · 7.5% · 30yr · 1.5% tax · 5.0% vac · 8.0% maint · 8.0% mgmt
Financing live
Cash to close
- Down payment
- $14,975
- Closing costs
- $1,797
- Reserves months
- —
- Total cash needed
- —
Loan-product check · same deal, 3 products live
Conventional
25% down · 7.5% · 30yr
- Down + closing
- —
- Monthly P&I
- —
- Monthly cashflow
- —
- DSCR
- —
- Eligible?
- —
Personal DTI + credit; lowest rate.
DSCR
20% down · 8.5% · 30yr
- Down + closing
- —
- Monthly P&I
- —
- Monthly cashflow
- —
- DSCR
- —
- Eligible?
- —
No personal income docs; deal must DSCR.
Hard money
10% down · 12.0% · 12mo
- Down + closing
- —
- Monthly P&I
- —
- Monthly cashflow
- —
- DSCR
- —
- Eligible?
- —
Short-term bridge; refi at stabilization.
Listing history 20 events
-
2026-06-18days on market $59,900 Active 133 DOM
-
2026-06-17days on market $59,900 Active 132 DOM
-
2026-06-16days on market $59,900 Active 131 DOM
-
2026-06-15days on market $59,900 Active 130 DOM
-
2026-06-13days on market $59,900 Active 128 DOM
-
2026-06-12days on market $59,900 Active 127 DOM
-
2026-06-09days on market $59,900 Active 124 DOM
-
2026-06-08days on market $59,900 Active 123 DOM
-
2026-06-08days on market $59,900 Active 122 DOM
-
2026-06-07days on market $59,900 Active 121 DOM
-
2026-06-04days on market $59,900 Active 118 DOM
-
2026-06-02days on market $59,900 Active 117 DOM
-
2026-06-01price $59,900 Active 116 DOM
-
2026-06-01days on market $64,900 Active 116 DOM
-
2026-05-31days on market $64,900 Active 115 DOM
-
2026-05-08price $69,900 290-char remark
Show marketing remark (290 chars)
Investor Alert! Great 3 bedroom brick single with covered front porch, attached garage, rear covered porch, lots of original hardwood floors and wood trim, was partially renovated just need to come in and finish. New wall to wall carpet in upstairs bedrooms. Being sold in as-is condition.
-
2026-04-06price $74,900 290-char remark
Show marketing remark (290 chars)
Investor Alert! Great 3 bedroom brick single with covered front porch, attached garage, rear covered porch, lots of original hardwood floors and wood trim, was partially renovated just need to come in and finish. New wall to wall carpet in upstairs bedrooms. Being sold in as-is condition.
-
2026-02-24price $79,900 290-char remark
Show marketing remark (290 chars)
Investor Alert! Great 3 bedroom brick single with covered front porch, attached garage, rear covered porch, lots of original hardwood floors and wood trim, was partially renovated just need to come in and finish. New wall to wall carpet in upstairs bedrooms. Being sold in as-is condition.
-
2026-02-05$89,900 Active 290-char remark
Show marketing remark (290 chars)
Investor Alert! Great 3 bedroom brick single with covered front porch, attached garage, rear covered porch, lots of original hardwood floors and wood trim, was partially renovated just need to come in and finish. New wall to wall carpet in upstairs bedrooms. Being sold in as-is condition.
-
2021-11-23soldstatus $35,000
ⓘ Source: listings_history table (triggers on properties + properties_extension) + one-shot
backfill from property_details.listing_events for pre-trigger history.
Tax reassessment forecast PA · Partial reset (capped growth)
- Current annual tax
- $1,647 · $137/mo
- Projected year-2 tax
- $1,647 · $137/mo
- Expected delta
- $0/yr ($0/mo · 0.0%)
ⓘ Screening estimate from a state-policy table — verify with the county assessor before closing.
Climate risk First Street
- Flood 9/10 Extreme FEMA zone X (unshaded) · 98% chance over 30 yrs
- Wildfire 1/10 Low
- Heat 3/10 Moderate 7 d/yr ≥97°F today · 18 d/yr by 30 yrs out
- Wind 2/10 Low
- Air quality 2/10 Low 1 unhealthy d/yr today · 2 by 30 yrs out
Nearby sold comps map
Loading sold comps map…
Walkable amenities ~0.75 mi
Loading nearby amenities…
Taxation est. · year 1
- Rental income
- $12,928
- − Mortgage interest
- −$3,355
- − Property taxes
- −$1,647
- − Insurance
- −$966
- − Repairs & maintenance
- −$1,034
- − Management
- −$1,034
- − Depreciation
- −$1,743
- Taxable income
- $3,149
- Est. tax owed @ 24.0%
- −$756
- After-tax cash flow
- $3,075/yr
For passive investors: Depreciation is non-cash, so a rental often shows a tax loss while cash-flowing — sheltering income. Rental losses are passive: they offset passive income freely, and up to $25,000/yr can offset ordinary (W-2) income if you actively participate and your MAGI is under $100k (phasing out to $0 by $150k); unused losses carry forward. On sale, claimed depreciation is recaptured at up to 25%, and gains may owe capital-gains tax (a 1031 exchange can defer both). Figures are a year-1 estimate at your 24.0% rate — not tax advice; consult a CPA.
Schools (NCES district)
- District
- Frazier SD
- NCES district ID
- 4210350
- Math proficiency
- 25% ▼ -16.00%
- Reading proficiency
- 52% ▼ -7.00%
- Median HH income
- $46,463
- Composite
- 32.8/100
- National rank
- #5628
- State rank
- #371 of 539 in PA
Livability — Perry
No livability data for this city. (Only ~50 U.S. cities are tracked.)
Census & demographics
- Population (ZIP)
- 172
Population outlook (Fayette County) Hauer SSP2
- Today (2025)
- 127,561 people
- By 2030
- 123,206 · -3.4%
- By 2040
- 113,232 · -11.2%
- By 2050
- 103,468 · -18.9%
- By 2075
- 83,185 · -34.8%
- By 2100
- 62,384 · -51.1%
Race, ethnicity, and origin ACS 2023
- Neighborhood character
- Highly diverse neighborhood (Simpson 0.79)
- Race & ethnicity
- Two or more races 54% White 46%
- Common ancestry
- Romanian 4%
Political lean MEDSL · Fayette
- 2024 margin
- Solid R (+37.9) · D 30.8% · R 68.7%
- 2008→2024 swing
- -37.5pp toward R · 2008: -0.4pp · 2024: -37.9pp
- All cycles
- 2024: R+37.9 2020: R+33.5 2016: R+31.0 2012: R+8.3 2008: R+0.4
Not yet ingested
- Civics
- —
Market trends
- HPI YoY
- —
- Current HPI
- —
- Rent YoY
- —
- Metro
- —
- State GDP YoY
- ▲ 1.68%
- F500 in state
- 34
Industry mix (Fortune 500 HQ in PA)
| Industry | F500 HQs | Revenue |
|---|---|---|
| Healthcare | 2 | $309B |
|
||
| Insurance | 2 | $27B |
|
||
| Telecommunications / Media | 1 | $124B |
|
||
| Industrial Distribution | 1 | $22B |
|
||
| Financial Services | 1 | $20B |
|
||
| Chemicals / Materials | 1 | $18B |
|
||
Price history
+99.7% since first listed5 events — show timeline
- 2026-05-08 Price Changed $69,900 West Penn MLS
- 2026-04-06 Price Changed $74,900 West Penn MLS
- 2026-02-24 Price Changed $79,900 West Penn MLS
- 2026-02-05 Listed $89,900 West Penn MLS
- 2021-11-23 Sold (Public Records) $35,000 Public Records
Property tax history
+5.1%/yrLatest (2026): $1,647 · +3.8% YoY. Source: county tax records.
Cash-flow waterfall
monthlySold comps — $/sqft
last 12 mo · ≤1 miLoading sold comps…