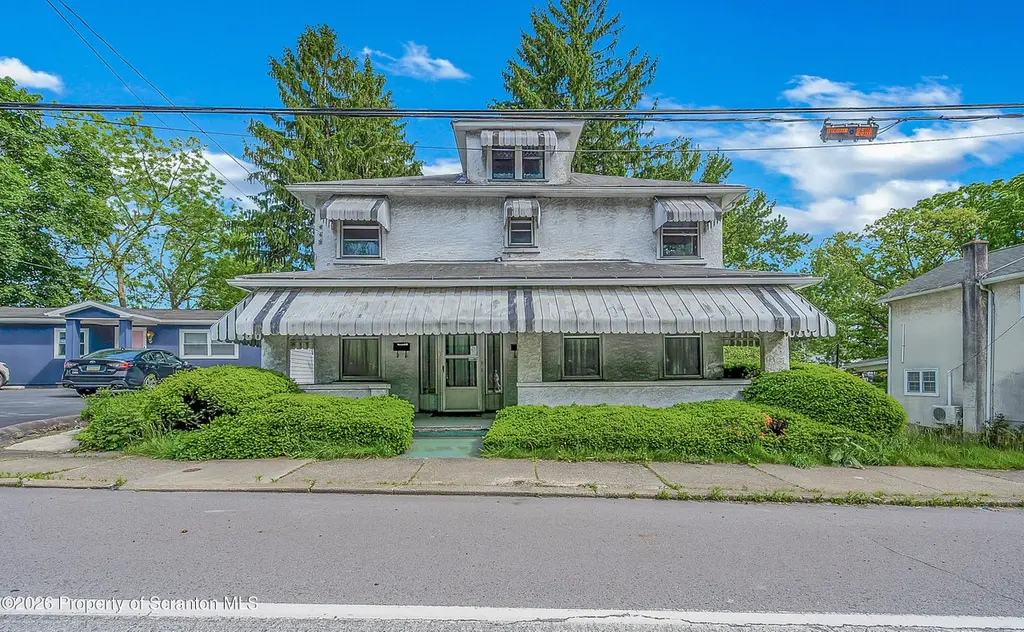
310 N Main St · Old Forge, PA
Flood risk 1/10 · Minimal
- FEMA flood zone
- X (unshaded)
- Chance of flooding over 30 yrs
- 0.0%
- Est. flood insurance / yr
- $473 – $860
Fire risk 2/10 · Minimal
- Est. fire insurance / yr
- $511 – $949
Heat risk 3/10 · Minor
- Hot days now (above 96°F)
- 7 days/yr
- Hot days in 30 yrs
- 15 days/yr
Wind risk 3/10 · Minor
- Chance of severe wind over 30 yrs
- 4.0%
Air-quality risk 2/10 · Minimal
- Unhealthy air days now
- 0 days/yr
- Unhealthy air days in 30 yrs
- 1 days/yr
Risk factors via First Street. Map © Google.
Why this score? — see what drove the B grade
The composite is a weighted blend of 9 inputs, each scored 0–100. Each bar is that input's sub-score; the figure is the points it added to the 100-point composite (weight × sub-score).
- Cash flow +23.4/30.0
- ARV discount +15.0/15.0
- Appreciation +7.6/10.0
- DSCR +7.5/10.0
- 1% rule +6.1/10.0
- Livability +3.9/5.0
- Schools +3.1/10.0
- Rent growth +2.5/5.0
- Condition / age +2.5/5.0
$159,900
🖨 Deal sheet 📄 Offer letter ✓ Due diligence
Listing remarks
Exceptional opportunity to own a spacious two-family property in the heart of Old Forge. This well-sized duplex offers a first-floor unit and second-floor unit, making it ideal for owner-occupants, investors, or multi-generational living. The second-floor apartment features a private balcony -- the perfect spot to relax and enjoy the neighborhood setting. The property also includes a garage, off-street parking, and a generous layout with plenty of potential for updates and value-add improvements. Whether you're looking to renovate and maximize rental income or customize a home to your style, this property offers the space and flexibility to make it happen. Conveniently located near local sh
Key facts
- Private balcony
- Generous layout
- Two-family property
Tags
Property features AI
Finance
- Financial info: Two total rental units
Exterior
- Parking: Garage (1 car)
- Home design: Multi-family residential property (2 units); First-floor unit and second-floor unit; Built in 1945 (estimated)
- Construction: Year built estimated 1945
- Exterior features: Lot approximately 0.17 acres; Lot dimensions 50 x 166 x 53 x 148
Interior
- Kitchen: Kitchen in both units
- Bedrooms: Four bedrooms total; Two bedrooms in the first-floor unit; Two bedrooms in the second-floor unit
- Bathrooms: Two full bathrooms total; One full bathroom in the first-floor unit; One full bathroom in the second-floor unit
- Interior features: Full walk-out basement; Basement
Neighborhood map
What this means for you Summary
Snapshot
- This is a 4-bed/2.0-bath single-family listed at $160k.
Deal economics
- At list price, monthly cash flow is $295 ($4k/yr) — positive.
- The deal already cash-flows at list — no discount required.
- Meets the 1% rule at list price ($2k rent vs $160k).
- Recommended offer: $158k (1.5% below list) — sets the bar for market timing.
- Cap rate 8.5% vs local median 6.1% in Old Forge — top-decile yield for the area; either an underpriced asset or a hidden risk that comps aren't pricing in. Stress-test before assuming the spread holds.
Location & tenants
- Location reads 78/100 on livability (#287 in PA, #2,531 nationally) — a middle-class / working-renter tenant base. Strengths: crime A+, cost of living A+, housing A+; Watch: employment C-, amenities F, commute F.
- Old Forge SD (suburban): math 22% / reading 49% proficiency, ranked #409 of 539 in PA (top 76%) — families likely to look elsewhere, expect single-tenant / working-renter base with shorter leases.
- Market conditions: 39 active listings in the ZIP; 2 comparable units currently listed for rent nearby; 251 units permitted in Lackawanna County in 2024 (0 in 5+ unit buildings).
Forward outlook
- In year one you build about $9k of equity ($1k loan paydown + $8k appreciation (5.2% local appreciation)).
- Lackawanna County population projected to shrink 4% by 2050 — rents likely to lag national; underwrite the cash flow, not the appreciation.
- At projected returns (5.2% appreciation + 3.0% rent growth), your $45k cash investment doubles in ~4 years — after that, you're playing with house money.
- By year 4, paydown + projected appreciation supports a ~$32k cash-out refi (75% LTV) — recoverable capital for the next deal without selling this one.
Negotiation context
- It's been on market 15 days — a 2% lower offer ($158k) is reasonable based on typical stale-listing flexibility.
- Current owner paid $115k; 39% above their basis — modest negotiation headroom, anchor on the comps not their cost.
Risks & watch-outs
- Watch-outs: built in 1945 — expect roof / HVAC / electrical / plumbing capex.
Questions for the listing agent
- Built in 1945 — when were the roof, HVAC, electrical panel, plumbing, and water heater last replaced?
- Is there a deadline driving the sale (1031 exchange, divorce, estate, relocation)? That informs how much negotiation room exists.
- Schools are B-rated — typically a magnet for longer-tenancy family renters. What's the average tenant stay here, and is there a school-zone premium baked into asking?
- What's the average days-on-market for RENTAL listings here right now (not sales)? A rising rental-DOM trend means longer vacancies and softer asking-rent achievability than the comps imply.
- What's the recent tenant-quality profile in this submarket — average credit score on applications, eviction rate, late-payment / NSF rate, and stable-employment percentage? A property-management company in the area should have these aggregated.
- How much new for-sale + rental construction is in the pipeline within 1–3 miles? Heavy new supply typically softens prices + rents 12–24 months out; constrained supply supports both.
Investment metrics
- 1% rule
- 1.11% ✓
- Cap rate
- 8.51%
- Cash-on-cash
- 7.91%
- DSCR
- 1.35
- GRM
- 7.5
CMA / ARV
- ARV (on-the-fly)
- $270,336
- Comps found
- 12
Show comp detail 12 sales within ~0.75 mi
| Address | Dist | Beds/Ba | Sqft | Sold | Price | $/sf | Match |
|---|---|---|---|---|---|---|---|
| 509 Maple St | 0.45mi | 3/2.0 (-1) | 2,157 (+2%) | 9mo | $245,000 | $114 | 63 |
| 411 Moosic Rd | 0.40mi | 4/2.0 | 1,800 (-15%) | 0mo | $329,900 | $183 | 56 |
| 159 2nd St | 0.17mi | 4/1.0 | 2,397 (+14%) | 11mo | $280,000 | $117 | 56 |
| 503 George St | 0.69mi | 4/1.5 | 2,230 (+6%) | 2mo | $275,000 | $123 | 55 |
| 616 Hospital St | 0.59mi | 4/2.5 | 2,200 (+4%) | 11mo | $285,000 | $130 | 54 |
| 906 Sampson St | 0.42mi | 3/1.0 (-1) | 1,900 (-10%) | 3mo | $242,500 | $128 | 53 |
| 420 Grace St | 0.73mi | 3/2.0 (-1) | 2,215 (+5%) | 1mo | $237,000 | $107 | 52 |
| 164 Taroli St | 0.71mi | 3/1.5 (-1) | 2,055 (-3%) | 6mo | $220,000 | $107 | 51 |
| 403 Grace St | 0.70mi | 4/2.0 | 1,950 (-8%) | 12mo | $215,000 | $110 | 44 |
| 209 Bubernak Blvd | 0.65mi | 3/2.5 (-1) | 2,229 (+6%) | 12mo | $323,000 | $145 | 43 |
| 600 Von Bergen St | 0.42mi | 3/2.0 (-1) | 1,850 (-12%) | 19mo | $291,250 | $157 | 39 |
| 162 Taroli St | 0.72mi | 3/1.5 (-1) | 1,854 (-12%) | 13mo | $250,000 | $135 | 29 |
Match score weights: distance 35% · size 25% · config 20% · recency 20%. Top-matched comps best support the ARV.
Projected returns pro-forma
5.15% appreciation · 3.0% rent growth · sell at horizon
- IRR
- 20.0%
- Equity multiple
- 2.27×
- Total profit
- $57,018
- Equity at exit
- $92,037
- IRR
- 19.7%
- Equity multiple
- 4.47×
- Total profit
- $155,581
- Equity at exit
- $160,033
Cash invested: $44,772 (down + closing). Projections, not guarantees.
Landlord ↔ Tenant lean methodology
- Overall (STATE)
- 62 Landlord-Friendly
- State Pennsylvania
- 62 Landlord-Friendly · EVEN
- County
- — inherits STATE
- City
- — inherits STATE
ZIP-level market 18518
- Home prices YoY
- 2.2%
- Active inventory
- 39
- Price-to-rent
- 7.5×
Monthly cashflow live
- Estimated rent
- $1,772 medium interval (Pro) →
- Mortgage (P&I)
- −$839
- Tax est. 1.5%
- −$200 /mo · $2,398/yr
- Insurance
- −$67
- HOA
- −$0
- Vacancy / Maint / Mgmt
- −$372
- Net cashflow
- $295
Break-even live
UW: 25.0% down · 7.5% · 30yr · 1.5% tax · 5.0% vac · 8.0% maint · 8.0% mgmt
Financing live
Cash to close
- Down payment
- $39,975
- Closing costs
- $4,797
- Reserves months
- —
- Total cash needed
- —
Loan-product check · same deal, 3 products live
Conventional
25% down · 7.5% · 30yr
- Down + closing
- —
- Monthly P&I
- —
- Monthly cashflow
- —
- DSCR
- —
- Eligible?
- —
Personal DTI + credit; lowest rate.
DSCR
20% down · 8.5% · 30yr
- Down + closing
- —
- Monthly P&I
- —
- Monthly cashflow
- —
- DSCR
- —
- Eligible?
- —
No personal income docs; deal must DSCR.
Hard money
10% down · 12.0% · 12mo
- Down + closing
- —
- Monthly P&I
- —
- Monthly cashflow
- —
- DSCR
- —
- Eligible?
- —
Short-term bridge; refi at stabilization.
Rent comps 2 comps
| Address | Beds | Baths | Sqft | Rent | $/sqft | DOM | Units | Dist |
|---|---|---|---|---|---|---|---|---|
| 200 Oak St Unit 2 Old Forge, PA | 3.0 | 1.5 | 1500 | $1,800 | $1.20 | 44d | 1 | 0.39mi |
| 112 E Grove St Taylor, PA | 4.0 | 1.5 | 1500 | $1,700 | $1.13 | 13d | 1 | 1.03mi |
Listing history 12 events
-
2026-06-18days on market $159,900 Active 15 DOM
-
2026-06-17days on market $159,900 Active 14 DOM
-
2026-06-16days on market $159,900 Active 13 DOM
-
2026-06-15days on market $159,900 Active 12 DOM
-
2026-06-14days on market $159,900 Active 10 DOM
-
2026-06-13days on market $159,900 Active 9 DOM
-
2026-06-10days on market $159,900 Active 7 DOM
-
2026-06-09days on market $159,900 Active 6 DOM
-
2026-06-08days on market $159,900 Active 5 DOM
-
2026-06-07days on market $159,900 Active 4 DOM
-
2026-06-03remarks 699-char remark
-
2026-06-03$159,900 Active 1 DOM
ⓘ Source: listings_history table (triggers on properties + properties_extension) + one-shot
backfill from property_details.listing_events for pre-trigger history.
Climate risk First Street
- Flood 1/10 Low FEMA zone X (unshaded) · 0% chance over 30 yrs
- Wildfire 2/10 Low
- Heat 3/10 Moderate 7 d/yr ≥96°F today · 15 d/yr by 30 yrs out
- Wind 3/10 Moderate 4% chance of damaging wind over 30 yrs
- Air quality 2/10 Low 0 unhealthy d/yr today · 1 by 30 yrs out
Nearby sold comps map
Loading sold comps map…
Walkable amenities ~0.75 mi
Loading nearby amenities…
Taxation est. · year 1
- Rental income
- $21,269
- − Mortgage interest
- −$8,957
- − Property taxes
- −$2,398
- − Insurance
- −$800
- − Repairs & maintenance
- −$1,701
- − Management
- −$1,701
- − Depreciation
- −$4,652
- Taxable income
- $1,059
- Est. tax owed @ 24.0%
- −$254
- After-tax cash flow
- $3,288/yr
For passive investors: Depreciation is non-cash, so a rental often shows a tax loss while cash-flowing — sheltering income. Rental losses are passive: they offset passive income freely, and up to $25,000/yr can offset ordinary (W-2) income if you actively participate and your MAGI is under $100k (phasing out to $0 by $150k); unused losses carry forward. On sale, claimed depreciation is recaptured at up to 25%, and gains may owe capital-gains tax (a 1031 exchange can defer both). Figures are a year-1 estimate at your 24.0% rate — not tax advice; consult a CPA.
Schools (NCES district)
- District
- Old Forge SD
- NCES district ID
- 4218120
- Math proficiency
- 22% ▼ -19.00%
- Reading proficiency
- 49% ▼ -17.00%
- Median HH income
- $49,409
- Composite
- 30.6/100
- National rank
- #6196
- State rank
- #409 of 539 in PA
Livability — Old Forge
- Score
- 78/100
- State rank
- #287
- US rank
- #2531
Category grades
Schools grade is shown separately in the Schools card above.
Census & demographics
- Census place
- Old Forge, PA
- City population
- 8,533
- Population (ZIP)
- 8,533
Population outlook (Lackawanna County) Hauer SSP2
- Today (2025)
- 210,652 people
- By 2030
- 208,623 · -1.0%
- By 2040
- 203,980 · -3.2%
- By 2050
- 201,069 · -4.5%
- By 2075
- 205,026 · -2.7%
- By 2100
- 210,851 · +0.1%
Race, ethnicity, and origin ACS 2023
- Neighborhood character
- Predominantly White (84%)
- Race & ethnicity
- White 84% Two or more races 13% Hispanic / Latino 9% Asian 1%
- Hispanic origin (detail)
- Puerto Rican 9%
- Common ancestry
- Romanian 17% Scotch-Irish 4% Subsaharan African 2%
- Foreign-born
- 2% · Canada
- Languages at home
- 95% English-only · Spanish 3% Other Indo-European 1% Other Asian/Pacific 1%
Political lean MEDSL · Lackawanna
- 2024 margin
- Toss-up / Even · D 51.0% · R 48.3%
- 2008→2024 swing
- -23.2pp toward R · 2008: 26.0pp · 2024: 2.8pp
- All cycles
- 2024: D+2.8 2020: D+8.4 2016: D+3.4 2012: D+27.4 2008: D+26.0
Not yet ingested
- Civics
- —
Market trends
- HPI YoY
- ▲ 5.15%
- Current HPI
- 242.2839
- Rent YoY
- —
- Metro
- —
- State GDP YoY
- ▲ 1.68%
- F500 in state
- 34
Industry mix (Fortune 500 HQ in PA)
| Industry | F500 HQs | Revenue |
|---|---|---|
| Healthcare | 2 | $309B |
|
||
| Insurance | 2 | $27B |
|
||
| Telecommunications / Media | 1 | $124B |
|
||
| Industrial Distribution | 1 | $22B |
|
||
| Financial Services | 1 | $20B |
|
||
| Chemicals / Materials | 1 | $18B |
|
||
Price history
+39.0% since first listed2 events — show timeline
- 2026-06-03 Listed $159,900 GSBR as distributed by MLS GRID
- 2026-04-21 Sold (Public Records) $115,000 Public Records
Property tax history
+24.4%/yrLatest (2026): $26,700 · +838.7% YoY. Source: county tax records.
Cash-flow waterfall
monthlySold comps — $/sqft
last 12 mo · ≤1 miLoading sold comps…