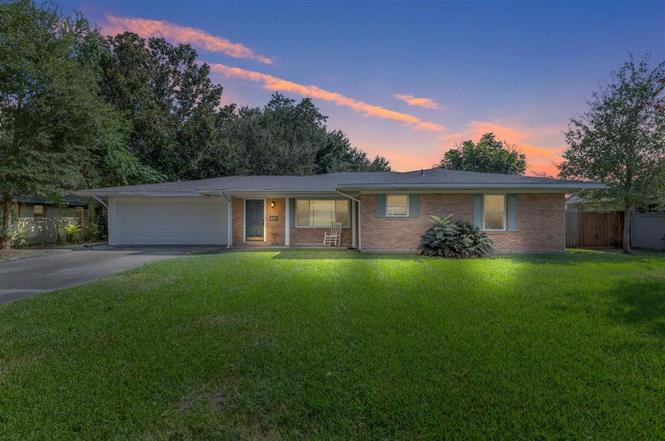
625 Contour Dr Dr · Lake Charles, LA
Flood risk 4/10 · Minor
- FEMA flood zone
- X (shaded)
- Chance of flooding over 30 yrs
- 0.24%
- Est. flood insurance / yr
- $507 – $1,088
Fire risk 1/10 · Minimal
- Est. fire insurance / yr
- $1,269 – $2,357
Heat risk 9/10 · Severe
- Hot days now (above 109°F)
- 7 days/yr
- Hot days in 30 yrs
- 22 days/yr
Wind risk 9/10 · Severe
- Chance of severe wind over 30 yrs
- 99.0%
Air-quality risk 2/10 · Minimal
- Unhealthy air days now
- 1 days/yr
- Unhealthy air days in 30 yrs
- 1 days/yr
Risk factors via First Street. Map © Google.
Why this score? — see what drove the C+ grade
The composite is a weighted blend of 9 inputs, each scored 0–100. Each bar is that input's sub-score; the figure is the points it added to the 100-point composite (weight × sub-score).
- Cash flow +23.0/30.0
- ARV discount +15.0/15.0
- DSCR +7.4/10.0
- 1% rule +5.4/10.0
- Rent growth +5.0/5.0
- Livability +3.4/5.0
- Schools +3.1/10.0
- Condition / age +2.5/5.0
- Appreciation +0.0/10.0
$159,900
🖨 Deal sheet (PDF) 📄 Offer letter ✓ Due diligence
Listing remarks
Charming 3 bedroom/ 2 bath Home Near McNeese – Central Lake Charles Location. Well-maintained home located in a desirable central Lake Charles neighborhood, just minutes from McNeese State University, shopping, dining, and major thoroughfares. This home features a spacious living area with abundant natural light, a functional kitchen with plenty of cabinet space, and a comfortable dining area. Primary bedroom has private bathroom. Two additional bedrooms share a full guest bath. Exterior features include a large fenced backyard, garage, and mature landscaping. Perfect for first-time buyers, downsizers, or investors seeking a move-in-ready property in a convenient location.
Key facts
- Functional kitchen
- Spacious living area
- Mature landscaping
Tags
Neighborhood map
What this means for you Summary
Snapshot
- This is a 3-bed/2.0-bath single-family listed at $160k.
Deal economics
- At list price, monthly cash flow is $283 ($3k/yr) — positive.
- The deal already cash-flows at list — no discount required.
- Meets the 1% rule at list price ($2k rent vs $160k).
- Recommended offer: $141k (12.0% below list) — sets the bar for market timing.
- Cap rate 8.4% vs local median 4.3% in Lake Charles — top-decile yield for the area; either an underpriced asset or a hidden risk that comps aren't pricing in. Stress-test before assuming the spread holds.
Location & tenants
- Location reads 68/100 on livability (#95 in LA) — a middle-class / working-renter tenant base. Strengths: commute A+, cost of living A+, housing A+; Watch: crime F, amenities F, employment D-.
- Calcasieu Parish (other): math 30% / reading 44% proficiency, ranked #29 of 98 in LA (top 30%) — families likely to look elsewhere, expect single-tenant / working-renter base with shorter leases.
- Zoned schools: Dolby Elementary School (math 42% / reading 62%, grade C-, #108 of 646 statewide, top 18%, 381 students, 64% FRL); F. K. White Middle School (math 26% / reading 39%, grade F, #104 of 218 statewide, top 48%, 661 students, 67% FRL); Alfred M. Barbe High School (math 41% / reading 56%, grade D, #41 of 265 statewide, top 16%, 1,991 students, 41% FRL) — zoned schools at 57% FRL track the district average.
- Market conditions: Rents rising fast (+15.1%/yr); 464 active listings in the ZIP; 7 comparable units currently listed for rent nearby; rentals lingering (median 46d on market — plan ~5-8 weeks vacancy on turnover, expect pricing pressure); 71% of comp listings sitting > 30 days — soft ceiling on asking rent; solid renter incomes; 1,298 units permitted in Calcasieu Parish in 2024 (526 in 5+ unit buildings).
Forward outlook
- Local home prices are declining (-3.0%/yr); year-one equity from $1k of loan paydown is wiped out by about $5k of value loss. Plan a longer hold.
- Calcasieu County population projected at +11% by 2050 — modest demand growth; plan on rents tracking national, not racing it.
- At projected returns (-3.0% appreciation + 8.0% rent growth), your $45k cash investment doubles in ~9 years — after that, you're playing with house money.
Negotiation context
- It's been on market 164 days — a 12% lower offer ($141k) is reasonable based on typical stale-listing flexibility.
- 3 sale attempts; this cycle's ask has dropped $40k (20%) from the opening price — seller is motivated, your offer sets the floor, not the list.
- Current owner paid $77k; list at $160k implies a 109% gain — meaningful room to come down on a strong offer.
Risks & watch-outs
- Climate carrying-cost: severe wind risk, 99% chance of damaging wind over 30y; extreme-heat days projected 7→22/yr by 2055 (HVAC capex compounding) — expect insurance premiums to compound above CPI over the hold.
Questions for the listing agent
- It's been on market 164 days. Have you received any prior offers? Is the seller open to a 12% concession, seller financing, or rate buy-down credit?
- Built in 1965 — when were the roof, HVAC, electrical panel, plumbing, and water heater last replaced?
- Why hasn't it sold? Are there any deal-killer items the seller is aware of (foundation, flood, title, zoning, code violations)?
- Is there a deadline driving the sale (1031 exchange, divorce, estate, relocation)? That informs how much negotiation room exists.
- Schools are B-rated — typically a magnet for longer-tenancy family renters. What's the average tenant stay here, and is there a school-zone premium baked into asking?
- Crime grade is F in this area — have there been break-ins, vandalism, or insurance claims at this property in the last 3 years? What carrier currently insures it and at what premium?
- What's the average days-on-market for RENTAL listings here right now (not sales)? A rising rental-DOM trend means longer vacancies and softer asking-rent achievability than the comps imply.
- What's the recent tenant-quality profile in this submarket — average credit score on applications, eviction rate, late-payment / NSF rate, and stable-employment percentage? A property-management company in the area should have these aggregated.
- How much new for-sale + rental construction is in the pipeline within 1–3 miles? Heavy new supply typically softens prices + rents 12–24 months out; constrained supply supports both.
Investment metrics
- 1% rule
- 1.04% ✓
- Cap rate
- 8.42%
- Cash-on-cash
- 7.59%
- DSCR
- 1.34
- GRM
- 8.0
CMA / ARV
- ARV (on-the-fly)
- $231,162
- Comps found
- 12
Show comp detail 12 sales within ~0.75 mi
| Address | Dist | Beds/Ba | Sqft | Sold | Price | $/sf | Match |
|---|---|---|---|---|---|---|---|
| 4410 Dean St St | 0.25mi | 3/2.0 | 1,931 (-1%) | 1mo | $172,500 | $89 | 85 |
| 1407 Jefferson Dr | 0.38mi | 3/2.0 | 1,946 (-1%) | 4mo | $260,000 | $134 | 78 |
| 1411 Jefferson Dr | 0.39mi | 3/2.0 | 1,908 (-3%) | 1mo | $235,000 | $123 | 77 |
| 4307 Oaklawn St | 0.50mi | 3/2.0 | 1,926 (-2%) | 2mo | $157,900 | $82 | 73 |
| 4315 Oaklawn | 0.47mi | 4/3.0 (+1) | 1,972 (+1%) | 2mo | $239,000 | $121 | 66 |
| 4402 Pleasant Dr | 0.33mi | 3/2.0 | 1,672 (-15%) | 2mo | $244,000 | $146 | 58 |
| 4304 Sarver St | 0.38mi | 4/3.0 (+1) | 2,142 (+9%) | 4mo | $223,400 | $104 | 55 |
| 4119 Pleasant Dr | 0.58mi | 3/2.0 | 2,240 (+14%) | 3mo | $195,000 | $87 | 47 |
| 450 Greenway St | 0.68mi | 4/3.0 (+1) | 1,827 (-7%) | 4mo | $215,000 | $118 | 45 |
| 445 Washington | 0.64mi | 4/2.0 (+1) | 2,177 (+11%) | 3mo | $189,000 | $87 | 44 |
| 401 Montclair St | 0.71mi | 4/2.0 (+1) | 1,760 (-10%) | 4mo | $263,000 | $149 | 42 |
| 4022 Wooded Dr | 0.72mi | 3/2.0 | 2,244 (+14%) | 1mo | $85,000 | $38 | 41 |
Match score weights: distance 35% · size 25% · config 20% · recency 20%. Top-matched comps best support the ARV.
Projected returns pro-forma
-3.0% appreciation · 8.0% rent growth · sell at horizon
- IRR
- 0.5%
- Equity multiple
- 1.02×
- Total profit
- $863
- Equity at exit
- $23,842
- IRR
- 14.5%
- Equity multiple
- 2.42×
- Total profit
- $63,749
- Equity at exit
- $13,825
Cash invested: $44,772 (down + closing). Projections, not guarantees.
Landlord ↔ Tenant lean methodology
- Overall (STATE)
- 90 Strongly Landlord-Friendly
- State Louisiana
- 90 Strongly Landlord-Friendly · R+12
- County
- — inherits STATE
- City
- — inherits STATE
ZIP-level market 70605
- Rents YoY
- 15.1%
- Active inventory
- 464
- Price-to-rent
- 8.0×
Monthly cashflow live
- Estimated rent
- $1,657 high interval (Pro) →
- Mortgage (P&I)
- −$839
- Tax from tax record
- −$121 /mo · $1,452/yr
- Insurance
- −$67
- HOA
- −$0
- Vacancy / Maint / Mgmt
- −$348
- Net cashflow
- $283
Break-even live
Sensitivity live
| Price | -10% $374 | -5% $328 | +0% $283 | +5% $238 | +10% $193 |
|---|---|---|---|---|---|
| Rent | -10% $152 | -5% $218 | +0% $283 | +5% $349 | +10% $414 |
| Rate | -1.0pp $364 | -0.5pp $324 | base $283 | +0.5pp $242 | +1.0pp $200 |
UW: 25.0% down · 7.5% · 30yr · 1.5% tax · 5.0% vac · 8.0% maint · 8.0% mgmt
Financing live
Cash to close
- Down payment
- $39,975
- Closing costs
- $4,797
- Reserves months
- —
- Total cash needed
- —
Loan-product check · same deal, 3 products live
Conventional
25% down · 7.5% · 30yr
- Down + closing
- —
- Monthly P&I
- —
- Monthly cashflow
- —
- DSCR
- —
- Eligible?
- —
Personal DTI + credit; lowest rate.
DSCR
20% down · 8.5% · 30yr
- Down + closing
- —
- Monthly P&I
- —
- Monthly cashflow
- —
- DSCR
- —
- Eligible?
- —
No personal income docs; deal must DSCR.
Hard money
10% down · 12.0% · 12mo
- Down + closing
- —
- Monthly P&I
- —
- Monthly cashflow
- —
- DSCR
- —
- Eligible?
- —
Short-term bridge; refi at stabilization.
Rent comps 7 comps
| Address | Beds | Baths | Sqft | Rent | $/sqft | DOM | Units | Dist |
|---|---|---|---|---|---|---|---|---|
| 155 Heather St Lake Charles, LA | 3.0 | 2.0 | 1316 | $1,650 | $1.25 | 15d | 1 | 0.64mi |
| 716 Dianne Ln Lake Charles, LA | 3.0 | 2.0 | 2200 | $5,000 | $2.27 | 45d | 1 | 0.91mi |
| 4326 Christina St Lake Charles, LA | 3.0 | 2.0 | 1600 | $1,770 | $1.11 | 22d | 1 | 0.97mi |
| 4128 Center St Lake Charles, LA | 4.0 | 2.0 | 2227 | $1,500 | $0.67 | 45d | 1 | 1.02mi |
| 417 E Claude St Lake Charles, LA | 4.0 | 1.0 | 1610 | $1,400 | $0.87 | 45d | 1 | 1.16mi |
| 1711 Mignonette Ln Unit 13-C Lake Charles, LA | 2.0 | 1.5 | 1275 | $1,095 | $0.86 | 45d | 1 | 1.40mi |
| 617 E School St Unit A Lake Charles, LA | 3.0 | 2.0 | 1800 | $2,500 | $1.39 | 45d | 1 | 1.42mi |
Listing history 11 events
-
2026-04-28status Pending
-
2026-04-22status Active
-
2026-03-31status Pending
-
2026-03-17price $159,900
-
2026-02-25price $169,900
-
2026-01-16status Active
-
2025-12-30status Pending
-
2025-12-08price $179,900
-
2025-10-20price $190,000
-
2025-10-07$200,000 Active
-
2000-06-21soldstatus $76,600
ⓘ Source: listings_history table (triggers on properties + properties_extension) + one-shot
backfill from property_details.listing_events for pre-trigger history.
Tax reassessment forecast LA · Resets to sale price
- Current annual tax
- $1,452 · $121/mo
- Projected year-2 tax
- $1,452 · $121/mo
- Expected delta
- $0/yr ($0/mo · 0.0%)
ⓘ Screening estimate from a state-policy table — verify with the county assessor before closing.
Climate risk First Street
- Flood 4/10 Moderate FEMA zone X (shaded) · 24% chance over 30 yrs
- Wildfire 1/10 Low
- Heat 9/10 Extreme 7 d/yr ≥109°F today · 22 d/yr by 30 yrs out
- Wind 9/10 Extreme 99% chance of damaging wind over 30 yrs
- Air quality 2/10 Low 1 unhealthy d/yr today · 1 by 30 yrs out
Nearby sold comps map
Loading sold comps map…
Walkable amenities ~0.75 mi
Loading nearby amenities…
Taxation est. · year 1
- Rental income
- $19,889
- − Mortgage interest
- −$8,957
- − Property taxes
- −$1,452
- − Insurance
- −$800
- − Repairs & maintenance
- −$1,591
- − Management
- −$1,591
- − Depreciation
- −$4,652
- Taxable income
- $847
- Est. tax owed @ 24.0%
- −$203
- After-tax cash flow
- $3,195/yr
For passive investors: Depreciation is non-cash, so a rental often shows a tax loss while cash-flowing — sheltering income. Rental losses are passive: they offset passive income freely, and up to $25,000/yr can offset ordinary (W-2) income if you actively participate and your MAGI is under $100k (phasing out to $0 by $150k); unused losses carry forward. On sale, claimed depreciation is recaptured at up to 25%, and gains may owe capital-gains tax (a 1031 exchange can defer both). Figures are a year-1 estimate at your 24.0% rate — not tax advice; consult a CPA.
Schools (NCES district)
- District
- Calcasieu Parish
- NCES district ID
- 2200330
- Math proficiency
- 30% ▼ -39.00%
- Reading proficiency
- 44% ▼ -33.00%
- Median HH income
- $44,700
- Composite
- 31.45/100
- National rank
- #5979
- State rank
- #29 of 98 in LA
Livability — Lake Charles
- Score
- 68/100
- State rank
- #95
- US rank
- #9820
Category grades
Schools grade is shown separately in the Schools card above.
Census & demographics
- Census place
- Lake Charles, LA
- County
- Calcasieu Parish · 170,889 people
- City population
- 133,538
- Metro
- Lake Charles, LA
- Population (ZIP)
- 40,482
- Household income
- $86,015
- Rent vs Own
- Severe rent burden
- 1328.0
Population outlook (Calcasieu County) Hauer SSP2
- Today (2025)
- 212,179 people
- By 2030
- 218,199 · +2.8%
- By 2040
- 228,486 · +7.7%
- By 2050
- 236,208 · +11.3%
- By 2075
- 251,696 · +18.6%
- By 2100
- 247,848 · +16.8%
Race, ethnicity, and origin ACS 2023
- Neighborhood character
- Predominantly White (79%)
- Race & ethnicity
- White 79% Black 10% Hispanic / Latino 6% Two or more races 6% Asian 3%
- Hispanic origin (detail)
- Mexican 2%
- Common ancestry
- Lithuanian 12% Italian 3% Slovak 2%
- Foreign-born
- 6% · Canada, Jamaica
- Languages at home
- 92% English-only · Spanish 4% Other Indo-European 2% Other Asian/Pacific 1%
Political lean MEDSL · Calcasieu
- 2024 margin
- Solid R (+39.6) · D 29.5% · R 69.0% · Other 1.5%
- 2008→2024 swing
- -15.0pp toward R · 2008: -24.6pp · 2024: -39.6pp
- All cycles
- 2024: R+39.6 2020: R+35.2 2016: R+33.3 2012: R+28.7 2008: R+24.6
Not yet ingested
- Civics
- —
Market trends
- HPI YoY
- ▼ -102.68%
- Current HPI
- 105.1903
- Rent YoY
- ▲ 15.10%
- Metro
- Lake Charles, LA
- State GDP YoY
- ▲ 3.29%
- F500 in state
- 10
Industry mix (Fortune 500 HQ in LA)
| Industry | F500 HQs | Revenue |
|---|---|---|
| Telecommunications | 2 | $23B |
|
||
| Utilities | 1 | $12B |
|
||
| Wholesale / Distribution | 1 | $5B |
|
||
| Advertising | 1 | $2B |
|
||
Price history
+108.7% since first listed11 events — show timeline
- 2026-04-28 Pending — SWLAR
- 2026-04-22 Relisted — SWLAR
- 2026-03-31 Pending — SWLAR
- 2026-03-17 Price Changed $159,900 SWLAR
- 2026-02-25 Price Changed $169,900 SWLAR
- 2026-01-16 Relisted — SWLAR
- 2025-12-30 Pending — SWLAR
- 2025-12-08 Price Changed $179,900 SWLAR
- 2025-10-20 Price Changed $190,000 SWLAR
- 2025-10-07 Listed $200,000 SWLAR
- 2000-06-21 Sold (Public Records) $76,600 Public Records
Property tax history
+0.1%/yrLatest (2025): $1,452 · +2.4% YoY. Source: county tax records.
Cash-flow waterfall
monthlySold comps — $/sqft
last 12 mo · ≤1 miLoading sold comps…