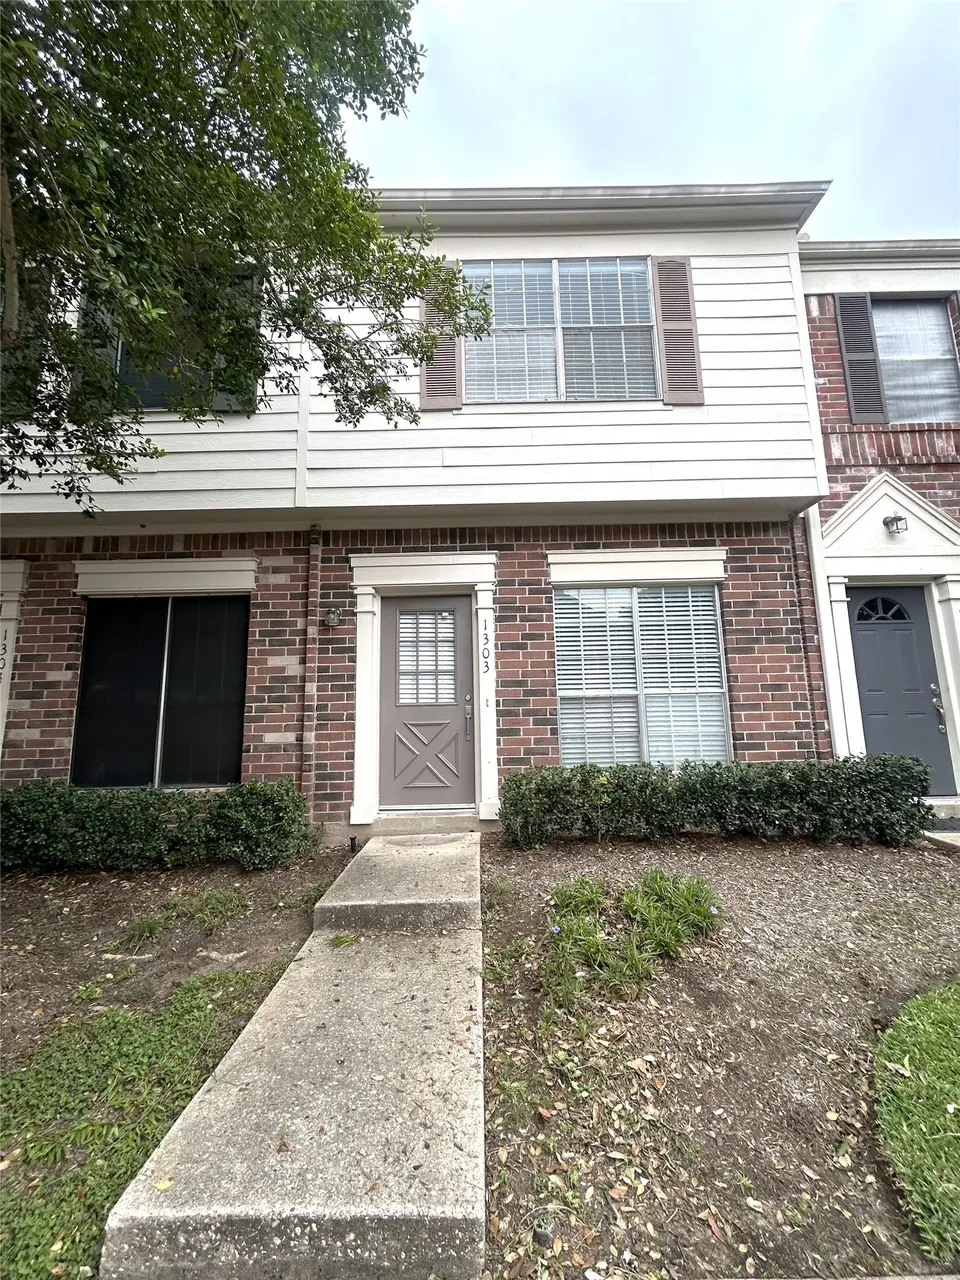
2910 Grants Lake Blvd #1303 · Sugar Land, TX
Flood risk 2/10 · Minimal
- FEMA flood zone
- X
- Chance of flooding over 30 yrs
- 0.05%
- Est. flood insurance / yr
- $507 – $1,088
Fire risk 1/10 · Minimal
- Est. fire insurance / yr
- $1,222 – $2,270
Heat risk 9/10 · Severe
- Hot days now (above 110°F)
- 7 days/yr
- Hot days in 30 yrs
- 23 days/yr
Wind risk 9/10 · Severe
- Chance of severe wind over 30 yrs
- 99.0%
Air-quality risk 2/10 · Minimal
- Unhealthy air days now
- 2 days/yr
- Unhealthy air days in 30 yrs
- 2 days/yr
Risk factors via First Street. Map © Google.
Why this score? — see what drove the D+ grade
The composite is a weighted blend of 9 inputs, each scored 0–100. Each bar is that input's sub-score; the figure is the points it added to the 100-point composite (weight × sub-score).
- Cash flow +15.2/30.0
- ARV discount +9.8/15.0
- 1% rule +5.3/10.0
- DSCR +4.7/10.0
- Schools +4.5/10.0
- Livability +4.0/5.0
- Rent growth +2.7/5.0
- Condition / age +2.5/5.0
- Appreciation +0.0/10.0
$195,000
🖨 Deal sheet (PDF) 📄 Offer letter ✓ Due diligence
Listing remarks
Spacious and well-maintained home featuring brand new carpet throughout, plus a new microwave and dishwasher. Washer and dryer are included for added convenience. Enjoy a private fenced patio and a cozy gas fireplace that opens to both the living and dining areas, creating a warm and inviting layout perfect for entertaining. Maintenance fee covers exterior building and grounds upkeep, roof, water, sewer, trash pickup, and building insurance. Each unit includes one covered parking space and one permitted parking space. Conveniently located just minutes from First Colony Mall, the SW Freeway, and Hwy 59 with easy access to shopping, dining, and commuting.
Key facts
- Cozy gas fireplace
- Private fenced patio
- New dishwasher
Tags
Property features AI
Finance
- Other: Seller disclosure available
- Financial info: Lease not considered
- HOA & community: HOA: Grants Lake/First Colony; Annual association fee of $719 (includes water and sewer); Community pool
Exterior
- Parking: No assigned parking
- Utilities: Public water; Public sewer
- Home design: Residential property; 2 stories; Built in 1990; Pillar/Post/Pier foundation
- Construction: Construction materials: Unknown
- Exterior features: Composition roof; Lot approximately 727 square feet
Interior
- Kitchen: Dishwasher; Microwave
- Bedrooms: Primary bedroom on the second floor (approx. 12x13); Second bedroom on the second floor (approx. 11x10); 2 bedrooms possible
- Bathrooms: 2 full bathrooms; 1 half bathroom
- Heating & cooling: Central heating (electric); Central air conditioning; Gas cooling
- Interior features: Gas fireplace (2 total fireplaces)
- Laundry & utility: Washer; Dryer
Neighborhood map
What this means for you Summary
Snapshot
- This is a 3-bed/3.0-bath single-family listed at $195k.
Deal economics
- At list price, monthly cash flow is $69 ($825/yr) — positive.
- The deal already cash-flows at list — no discount required.
- Meets the 1% rule at list price ($2k rent vs $195k).
- Recommended offer: $189k (3.0% below list) — sets the bar for market timing.
- Cap rate 6.7% vs local median 2.6% in Sugar Land — top-decile yield for the area; either an underpriced asset or a hidden risk that comps aren't pricing in. Stress-test before assuming the spread holds.
Location & tenants
- Location reads 80/100 on livability (#38 in TX, #1,758 nationally) — a professional / high-income tenant draw. Strengths: crime A+, employment A+, housing A+; Watch: cost of living D, commute F.
- Fort Bend ISD (suburban): math 44% / reading 53% proficiency, ranked #140 of 826 in TX (top 17%) — families likely to look elsewhere, expect single-tenant / working-renter base with shorter leases.
- Zoned schools: Colony Bend El (math 47% / reading 57%, grade C-, #742 of 4,322 statewide, top 19%, 580 students, 40% FRL); First Colony Middle (math 52% / reading 57%, grade B-, #256 of 1,662 statewide, top 16%, 1,234 students, 30% FRL); Fort Bend Co Alter (26 students, 0% FRL).
- Market conditions: Rents flat; 570 active listings in the ZIP; 14 comparable units currently listed for rent nearby; rentals at typical pace (median 15d on market — plan ~3-4 weeks tenant-placement turnaround); high-income renter base; 12,093 units permitted in Fort Bend County in 2024 (815 in 5+ unit buildings).
- This rent is only 15% of the median local income ($157k/yr) — well below the 30% rent-burden line; pricing power to push rent on renewal without tenant pushback.
Forward outlook
- Local home prices are declining (-3.0%/yr); year-one equity from $1k of loan paydown is wiped out by about $6k of value loss. Plan a longer hold.
- Fort Bend County population projected at +75% by 2050 — long-run rental-demand tailwind backs the buy-and-hold thesis.
Negotiation context
- It's been on market 44 days — a 3% lower offer ($189k) is reasonable based on typical stale-listing flexibility.
- 2 sale attempts since 24y ago with the ask held roughly flat each time — persistent listings suggest the price (not the market) is what's stuck; bring a comps-based counter.
Risks & watch-outs
- Climate carrying-cost: severe wind risk, 99% chance of damaging wind over 30y; extreme-heat days projected 7→23/yr by 2055 (HVAC capex compounding) — expect insurance premiums to compound above CPI over the hold.
Questions for the listing agent
- It's been on market 44 days. Have you received any prior offers? Is the seller open to a 3% concession, seller financing, or rate buy-down credit?
- What does the HOA fee cover, when was the last increase, and are there any pending special assessments or reserve-fund shortfalls?
- Is there a deadline driving the sale (1031 exchange, divorce, estate, relocation)? That informs how much negotiation room exists.
- Schools are A-rated — typically a magnet for longer-tenancy family renters. What's the average tenant stay here, and is there a school-zone premium baked into asking?
- The area grade is low — what's the realistic commute time and amenity access for the typical tenant pool here? Any planned neighborhood developments (good or bad) we should know about?
- What's the average days-on-market for RENTAL listings here right now (not sales)? A rising rental-DOM trend means longer vacancies and softer asking-rent achievability than the comps imply.
- What's the recent tenant-quality profile in this submarket — average credit score on applications, eviction rate, late-payment / NSF rate, and stable-employment percentage? A property-management company in the area should have these aggregated.
- How much new for-sale + rental construction is in the pipeline within 1–3 miles? Heavy new supply typically softens prices + rents 12–24 months out; constrained supply supports both.
Investment metrics
- 1% rule
- 1.03% ✓
- Cap rate
- 6.72%
- Cash-on-cash
- 1.51%
- DSCR
- 1.07
- GRM
- 8.1
CMA / ARV
- ARV (median comp)
- $205,640
- List price
- $195,000
- Delta
- -5.17%
- Verdict
- FAIR
- Comps
- 20 within 1.0 mi
Projected returns pro-forma
-3.0% appreciation · 0.82% rent growth · sell at horizon
- IRR
- -16.6%
- Equity multiple
- 0.43×
- Total profit
- $-31,385
- Equity at exit
- $29,075
- IRR
- -13.4%
- Equity multiple
- 0.30×
- Total profit
- $-38,026
- Equity at exit
- $16,860
Cash invested: $54,600 (down + closing). Projections, not guarantees.
Landlord ↔ Tenant lean methodology
- Overall (STATE)
- 87 Strongly Landlord-Friendly
- State Texas
- 87 Strongly Landlord-Friendly · R+5
- County
- — inherits STATE
- City
- — inherits STATE
ZIP-level market 77479
- Home prices YoY
- -34.9%
- Rents YoY
- 0.8%
- Active inventory
- 570
- Price-to-rent
- 8.1×
Monthly cashflow live
- Estimated rent
- $2,000 high interval (Pro) →
- Mortgage (P&I)
- −$1,023
- Tax from tax record
- −$347 /mo · $4,167/yr
- Insurance
- −$81
- HOA
- −$60
- Vacancy / Maint / Mgmt
- −$420
- Net cashflow
- $69
Break-even live
Sensitivity live
| Price | -10% $179 | -5% $124 | +0% $69 | +5% $14 | +10% $-42 |
|---|---|---|---|---|---|
| Rent | -10% $-89 | -5% $-10 | +0% $69 | +5% $148 | +10% $227 |
| Rate | -1.0pp $167 | -0.5pp $118 | base $69 | +0.5pp $18 | +1.0pp $-33 |
UW: 25.0% down · 7.5% · 30yr · 1.5% tax · 5.0% vac · 8.0% maint · 8.0% mgmt
Financing live
Cash to close
- Down payment
- $48,750
- Closing costs
- $5,850
- Reserves months
- —
- Total cash needed
- —
Loan-product check · same deal, 3 products live
Conventional
25% down · 7.5% · 30yr
- Down + closing
- —
- Monthly P&I
- —
- Monthly cashflow
- —
- DSCR
- —
- Eligible?
- —
Personal DTI + credit; lowest rate.
DSCR
20% down · 8.5% · 30yr
- Down + closing
- —
- Monthly P&I
- —
- Monthly cashflow
- —
- DSCR
- —
- Eligible?
- —
No personal income docs; deal must DSCR.
Hard money
10% down · 12.0% · 12mo
- Down + closing
- —
- Monthly P&I
- —
- Monthly cashflow
- —
- DSCR
- —
- Eligible?
- —
Short-term bridge; refi at stabilization.
Rent comps 14 comps
| Address | Beds | Baths | Sqft | Rent | $/sqft | DOM | Units | Dist |
|---|---|---|---|---|---|---|---|---|
| 2930 Grants Lake Blvd Sugar Land, TX | 2.0 | 1.5 | 1110 | $1,625 | $1.46 | 6d | 1 | 0.07mi |
| 2810 Grants Lake Blvd Sugar Land, TX | 2.0 | 3.0 | 1080 | $1,750 | $1.62 | 46d | 1 | 0.13mi |
| 1806 Austin Pkwy Sugar Land, TX | 3.0 | 2.0 | 1153 | $1,635 | $1.42 | 46d | 1 | 0.30mi |
| 1800 Austin Pkwy Sugar Land, TX | 2.0–3.0 | 1.0–2.0 | 1033 | $1,795 | $1.74 | 1d | 21 | 0.46mi |
| 2299 Lone Star Dr Sugar Land, TX | 1.0–3.0 | 1.0–2.0 | 948 | $2,800 | $2.95 | 46d | 9 | 0.54mi |
| 2299 Lone Star Dr Sugar Land, TX | 1.0–2.0 | 1.0–2.0 | 835 | $2,500 | $2.99 | 0d | 9 | 0.54mi |
| 2701 Planters St Sugar Land, TX | 2.0 | 2.0 | 1009 | $1,450 | $1.44 | 13d | 1 | 0.61mi |
| 1700 Rivercrest Dr Sugar Land, TX | 1.0–2.0 | 1.0–2.0 | 837 | $1,735 | $2.07 | 1d | 49 | 0.76mi |
| 2323 Long Reach Dr Sugar Land, TX | 1.0–3.0 | 1.0–2.0 | 985 | $2,070 | $2.10 | 15d | 1 | 0.89mi |
| 15299 Lexington Blvd Sugar Land, TX | 2.0 | 2.0 | 1054 | $1,810 | $1.72 | 26d | 1 | 0.97mi |
| 225 Fluor Daniel Dr Sugar Land, TX | 1.0–3.0 | 1.0–2.0 | 999 | $2,400 | $2.40 | 0d | 27 | 1.21mi |
| 2222 Settlers Way Blvd Sugar Land, TX | 1.0–3.0 | 1.0–2.0 | 921 | $1,885 | $2.05 | 0d | 18 | 1.21mi |
| 231 Fluor Daniel Dr Sugar Land, TX | 2.0 | 1.0 | 935 | $1,596 | $1.71 | 46d | 1 | 1.23mi |
| 2228 Settlers Way Blvd Sugar Land, TX | 2.0 | 2.0 | 970 | $1,383 | $1.43 | 46d | 1 | 1.25mi |
HOA detail
- Monthly dues
- $60 · $720/yr
- Likely covers
- watersewertrashgaslandscapinginsurance
Listing history 18 events
-
2026-06-21days on market $195,000 Active 44 DOM
-
2026-06-18days on market $195,000 Active 41 DOM
-
2026-06-17days on market $195,000 Active 40 DOM
-
2026-06-16days on market $195,000 Active 39 DOM
-
2026-06-15days on market $195,000 Active 38 DOM
-
2026-06-13days on market $195,000 Active 36 DOM
-
2026-06-09days on market $195,000 Active 32 DOM
-
2026-06-08days on market $195,000 Active 31 DOM
-
2026-06-07days on market $195,000 Active 30 DOM
-
2026-06-04days on market $195,000 Active 27 DOM
-
2026-06-03days on market $195,000 Active 26 DOM
-
2026-06-02days on market $195,000 Active 25 DOM
-
2026-06-01days on market $195,000 Active 24 DOM
-
2026-05-31days on market $195,000 Active 23 DOM
-
2026-05-08$195,000 Active 661-char remark
-
2003-01-03soldstatus
-
2002-12-02historical
-
2002-08-14$89,000
ⓘ Source: listings_history table (triggers on properties + properties_extension) + one-shot
backfill from property_details.listing_events for pre-trigger history.
Tax reassessment forecast TX · Resets to sale price
- Current annual tax
- $4,167 · $347/mo
- Projected year-2 tax
- $4,167 · $347/mo
- Expected delta
- $0/yr ($0/mo · 0.0%)
ⓘ Screening estimate from a state-policy table — verify with the county assessor before closing.
Climate risk First Street
- Flood 2/10 Low FEMA zone X · 5% chance over 30 yrs
- Wildfire 1/10 Low
- Heat 9/10 Extreme 7 d/yr ≥110°F today · 23 d/yr by 30 yrs out
- Wind 9/10 Extreme 99% chance of damaging wind over 30 yrs
- Air quality 2/10 Low 2 unhealthy d/yr today · 2 by 30 yrs out
Nearby sold comps map
Loading sold comps map…
Walkable amenities ~0.75 mi
Loading nearby amenities…
Taxation est. · year 1
- Rental income
- $23,997
- − Mortgage interest
- −$10,923
- − Property taxes
- −$4,167
- − Insurance
- −$975
- − Repairs & maintenance
- −$1,920
- − Management
- −$1,920
- − HOA
- −$720
- − Depreciation
- −$5,673
- Taxable loss
- −$2,300
- Est. tax savings @ 24.0%
- +$552
- After-tax cash flow
- $1,377/yr
For passive investors: Depreciation is non-cash, so a rental often shows a tax loss while cash-flowing — sheltering income. Rental losses are passive: they offset passive income freely, and up to $25,000/yr can offset ordinary (W-2) income if you actively participate and your MAGI is under $100k (phasing out to $0 by $150k); unused losses carry forward. On sale, claimed depreciation is recaptured at up to 25%, and gains may owe capital-gains tax (a 1031 exchange can defer both). Figures are a year-1 estimate at your 24.0% rate — not tax advice; consult a CPA.
Schools (NCES district)
- District
- Fort Bend ISD
- NCES district ID
- 4819650
- Math proficiency
- 44% ▼ -15.00%
- Reading proficiency
- 53% ▼ -4.00%
- Median HH income
- $82,360
- Composite
- 44.61/100
- National rank
- #2779
- State rank
- #140 of 826 in TX
Livability — Sugar Land
- Score
- 80/100
- State rank
- #38
- US rank
- #1758
Category grades
Schools grade is shown separately in the Schools card above.
Census & demographics
- Census place
- Sugar Land, TX
- County
- Fort Bend County · 836,777 people
- City population
- 168,209
- Metro
- Houston-The Woodlands-Sugar Land, TX
- Population (ZIP)
- 92,221
- Household income
- $156,735
- Rent vs Own
- Severe rent burden
- 1207.0
Population outlook (Fort Bend County) Hauer SSP2
- Today (2025)
- 1,004,526 people
- By 2030
- 1,153,104 · +14.8%
- By 2040
- 1,453,718 · +44.7%
- By 2050
- 1,753,781 · +74.6%
- By 2075
- 2,455,772 · +144.5%
- By 2100
- 2,930,528 · +191.7%
Race, ethnicity, and origin ACS 2023
- Neighborhood character
- Diverse neighborhood (Simpson 0.67)
- Race & ethnicity
- Asian 47% White 30% Hispanic / Latino 10% Black 8% Two or more races 8%
- Hispanic origin (detail)
- Mexican 5%
- Common ancestry
- Lithuanian 2% Romanian 1% Slovak 1%
- Foreign-born
- 42% · China, Canada, Vietnam
- Languages at home
- 52% English-only · Other Indo-European 16% Chinese 13% Spanish 6%
Political lean MEDSL · Fort Bend
- 2024 margin
- Toss-up / Even · D 49.5% · R 47.9% · Other 2.6%
- 2008→2024 swing
- +4.0pp toward D · 2008: -2.4pp · 2024: 1.6pp
- All cycles
- 2024: D+1.6 2020: D+10.6 2016: D+6.6 2012: R+6.8 2008: R+2.4
Not yet ingested
- Civics
- —
Market trends
- HPI YoY
- ▼ -121.96%
- Current HPI
- 227.7544
- Rent YoY
- ▲ 0.82%
- Metro
- Houston-The Woodlands-Sugar Land, TX
- State GDP YoY
- ▲ 3.95%
- F500 in state
- 110
Industry mix (Fortune 500 HQ in TX)
| Industry | F500 HQs | Revenue |
|---|---|---|
| Energy | 16 | $1,198B |
|
||
| Technology | 5 | $198B |
|
||
| Engineering / Construction | 4 | $72B |
|
||
| Energy Services | 3 | $60B |
|
||
| Utilities | 3 | $41B |
|
||
| Healthcare | 2 | $330B |
|
||
Price history
+119.1% since first listed4 events — show timeline
- 2026-05-08 Listed $195,000 HARMLS
- 2003-01-03 Sold (Public Records) — Public Records
- 2002-12-02 Listing Removed — HARMLS
- 2002-08-14 Listed $89,000 HARMLS
Property tax history
+3.9%/yrLatest (2025): $4,167 · +7.8% YoY. Source: county tax records.
Cash-flow waterfall
monthlySold comps — $/sqft
last 12 mo · ≤1 miLoading sold comps…