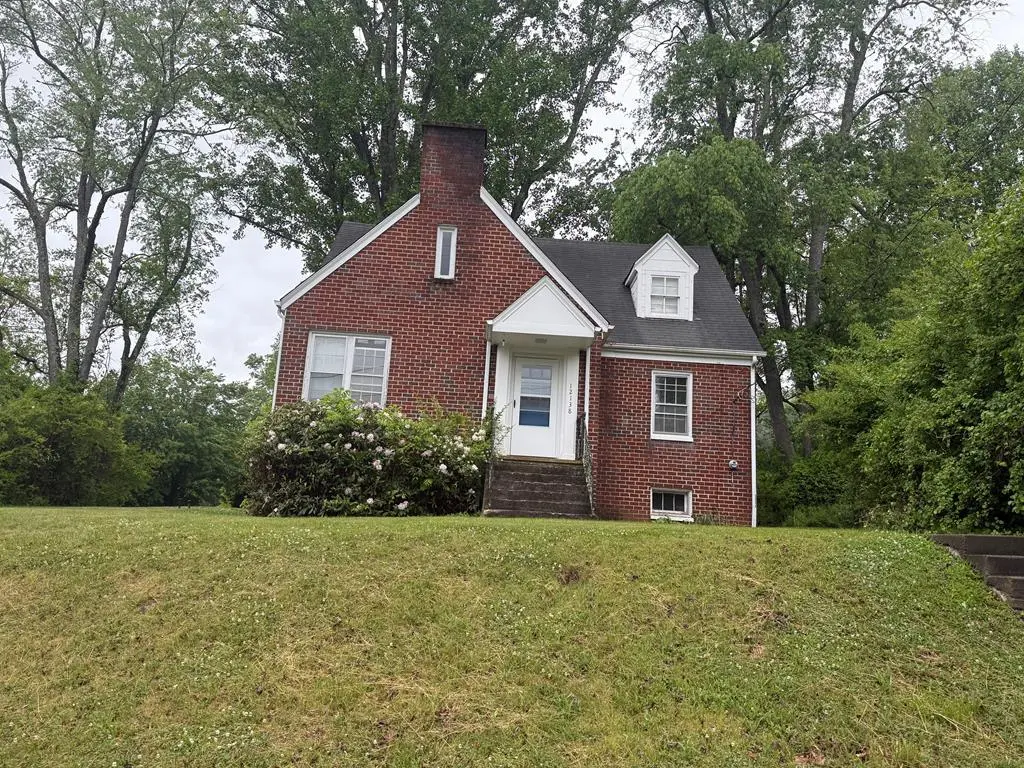
12138 Linden St · Emory, VA
Flood risk 1/10 · Minimal
- FEMA flood zone
- X (unshaded)
- Chance of flooding over 30 yrs
- 0.0%
- Est. flood insurance / yr
- $473 – $860
Fire risk 6/10 · Moderate
- Est. fire insurance / yr
- $666 – $1,236
Heat risk 3/10 · Minor
- Hot days now (above 94°F)
- 7 days/yr
- Hot days in 30 yrs
- 22 days/yr
Wind risk 2/10 · Minimal
- Chance of severe wind over 30 yrs
- —
Air-quality risk 1/10 · Minimal
- Unhealthy air days now
- 0 days/yr
- Unhealthy air days in 30 yrs
- 0 days/yr
Risk factors via First Street. Map © Google.
Why this score? — see what drove the B grade
The composite is a weighted blend of 9 inputs, each scored 0–100. Each bar is that input's sub-score; the figure is the points it added to the 100-point composite (weight × sub-score).
- Cash flow +23.9/30.0
- ARV discount +15.0/15.0
- DSCR +7.7/10.0
- Appreciation +6.5/10.0
- 1% rule +6.2/10.0
- Schools +6.2/10.0
- Livability +3.7/5.0
- Rent growth +2.5/5.0
- Condition / age +2.5/5.0
$250,000
🖨 Deal sheet 📄 Offer letter ✓ Due diligence
Listing remarks
Colonial home with antique charm, footsteps away from picturesque Emory & Henry University. Four large bedrooms and a living room complete with the original wood burning fireplace, make this home a truly unique listing. Settle in and make in your home or take this opportunity to have a never-ending supply of tenants. Either option makes for a great investment! All information provided as a courtesy. Buyer's and buyer's agents to verify.
Key facts
- 0.39 acre lot
- Built 1949
- Listed 3 days
Property features AI
Exterior
- Utilities: Public water; Public sewer
- Home design: Two-story single-family home; Residential property in a village zoning area
- Construction: Brick construction
- Exterior features: Shingle roof
Interior
- Kitchen: Dishwasher; Electric range; Refrigerator
- Flooring: Wood flooring
- Bathrooms: 2 full bathrooms
- Heating & cooling: Forced air heating; Ceiling fans; Wall/window air conditioning units
- Interior features: Wood-burning fireplace; Basement
Neighborhood map
What this means for you Summary
Snapshot
- This is a 3-bed/1.5-bath single-family listed at $250k.
Deal economics
- At list price, monthly cash flow is $484 ($6k/yr) — positive.
- The deal already cash-flows at list — no discount required.
- Meets the 1% rule at list price ($3k rent vs $250k).
Location & tenants
- Location reads 74/100 on livability (#159 in VA, #4,933 nationally) — a middle-class / working-renter tenant base. Strengths: crime A+, cost of living A+, housing A+; Watch: commute C-, health & safety C-, amenities F.
- Washington County Public School District (rural): math 68% / reading 79% proficiency, ranked #15 of 131 in VA (top 12%) — strong family-tenant draw, lease renewals of 3-5y typical.
- Zoned schools: Glade Spring Middle (math 70% / reading 74%, grade A, #65 of 342 statewide, top 21%, 254 students, 80% FRL); Patrick Henry High (math 62% / reading 82%, grade B+, #134 of 319 statewide, top 45%, 366 students, 66% FRL) — zoned schools average 73% FRL vs 42% district-wide (31 pts higher); higher-poverty schools than district average — tighter screening recommended.
- Market conditions: 36 active listings in the ZIP; 1 comparable units currently listed for rent nearby; 99 units permitted in Washington County in 2024 (0 in 5+ unit buildings).
Forward outlook
- In year one you build about $9k of equity ($2k loan paydown + $8k appreciation (3.1% local appreciation)).
- Washington County population projected at -14% by 2050 — secular population decline; favor cash flow + early exit over multi-decade hold.
- At projected returns (3.1% appreciation + 3.0% rent growth), your $70k cash investment doubles in ~5 years — after that, you're playing with house money.
- By year 4, paydown + projected appreciation supports a ~$32k cash-out refi (75% LTV) — recoverable capital for the next deal without selling this one.
Negotiation context
- Only 3 days on market — expect competitive offers; lowballing is unlikely to land.
Risks & watch-outs
- Watch-outs: built in 1949 — expect roof / HVAC / electrical / plumbing capex.
- Climate carrying-cost: major wildfire risk — expect insurance premiums to compound above CPI over the hold.
Questions for the listing agent
- Built in 1949 — when were the roof, HVAC, electrical panel, plumbing, and water heater last replaced?
- Is there a deadline driving the sale (1031 exchange, divorce, estate, relocation)? That informs how much negotiation room exists.
- Schools are D-rated, which usually means shorter tenancies and higher turnover. Who's the typical renter profile here, and what's been the actual vacancy rate?
- What's the average days-on-market for RENTAL listings here right now (not sales)? A rising rental-DOM trend means longer vacancies and softer asking-rent achievability than the comps imply.
- What's the recent tenant-quality profile in this submarket — average credit score on applications, eviction rate, late-payment / NSF rate, and stable-employment percentage? A property-management company in the area should have these aggregated.
- How much new for-sale + rental construction is in the pipeline within 1–3 miles? Heavy new supply typically softens prices + rents 12–24 months out; constrained supply supports both.
Investment metrics
- 1% rule
- 1.12% ✓
- Cap rate
- 8.62%
- Cash-on-cash
- 8.30%
- DSCR
- 1.37
- GRM
- 7.4
CMA / ARV
- ARV (on-the-fly)
- $371,908
- Comps found
- 4
Show comp detail 4 sales within ~0.75 mi
| Address | Dist | Beds/Ba | Sqft | Sold | Price | $/sf | Match |
|---|---|---|---|---|---|---|---|
| 12138 Linden St | 0.00mi | 4/2.0 (+1) | 1,706 (0%) | 0mo | $202,500 | $119 | 93 |
| 12128 Linden St | 0.02mi | 3/1.5 | 1,468 (-14%) | 8mo | $160,000 | $109 | 69 |
| 31042 Oberlin Dr | 0.50mi | 3/2.5 | 1,900 (+11%) | 3mo | $435,000 | $229 | 51 |
| 12226 Aspen St | 0.57mi | 3/2.0 | 1,837 (+8%) | 10mo | $401,000 | $218 | 50 |
Match score weights: distance 35% · size 25% · config 20% · recency 20%. Top-matched comps best support the ARV.
Projected returns pro-forma
3.06% appreciation · 3.0% rent growth · sell at horizon
- IRR
- 15.4%
- Equity multiple
- 1.88×
- Total profit
- $61,788
- Equity at exit
- $113,245
- IRR
- 17.1%
- Equity multiple
- 3.51×
- Total profit
- $175,857
- Equity at exit
- $175,175
Cash invested: $70,000 (down + closing). Projections, not guarantees.
Landlord ↔ Tenant lean methodology
- Overall (STATE)
- 55 Moderately Landlord-Leaning
- State Virginia
- 55 Moderately Landlord-Leaning · D+2
- County
- — inherits STATE
- City
- — inherits STATE
ZIP-level market 24361
- Home prices YoY
- 1.6%
- Active inventory
- 36
- Price-to-rent
- 7.4×
Monthly cashflow live
- Estimated rent
- $2,800 medium interval (Pro) →
- Mortgage (P&I)
- −$1,311
- Tax est. 1.5%
- −$312 /mo · $3,750/yr
- Insurance
- −$104
- HOA
- −$0
- Vacancy / Maint / Mgmt
- −$588
- Net cashflow
- $484
Break-even live
UW: 25.0% down · 7.5% · 30yr · 1.5% tax · 5.0% vac · 8.0% maint · 8.0% mgmt
Financing live
Cash to close
- Down payment
- $62,500
- Closing costs
- $7,500
- Reserves months
- —
- Total cash needed
- —
Loan-product check · same deal, 3 products live
Conventional
25% down · 7.5% · 30yr
- Down + closing
- —
- Monthly P&I
- —
- Monthly cashflow
- —
- DSCR
- —
- Eligible?
- —
Personal DTI + credit; lowest rate.
DSCR
20% down · 8.5% · 30yr
- Down + closing
- —
- Monthly P&I
- —
- Monthly cashflow
- —
- DSCR
- —
- Eligible?
- —
No personal income docs; deal must DSCR.
Hard money
10% down · 12.0% · 12mo
- Down + closing
- —
- Monthly P&I
- —
- Monthly cashflow
- —
- DSCR
- —
- Eligible?
- —
Short-term bridge; refi at stabilization.
Rent comps 1 comps
| Address | Beds | Baths | Sqft | Rent | $/sqft | DOM | Units | Dist |
|---|---|---|---|---|---|---|---|---|
| 12150 Arbor St Unit 12150-A Meadowview, VA | 4.0 | 3.5 | 1905 | $2,800 | $1.47 | 13d | 1 | 0.35mi |
Listing history 2 events
-
2026-05-11status Pending
-
2026-05-08$250,000 Active
ⓘ Source: listings_history table (triggers on properties + properties_extension) + one-shot
backfill from property_details.listing_events for pre-trigger history.
Climate risk First Street
- Flood 1/10 Low FEMA zone X (unshaded) · 0% chance over 30 yrs
- Wildfire 6/10 Major
- Heat 3/10 Moderate 7 d/yr ≥94°F today · 22 d/yr by 30 yrs out
- Wind 2/10 Low
- Air quality 1/10 Low 0 unhealthy d/yr today · 0 by 30 yrs out
Nearby sold comps map
Loading sold comps map…
Walkable amenities ~0.75 mi
Loading nearby amenities…
Taxation est. · year 1
- Rental income
- $33,600
- − Mortgage interest
- −$14,004
- − Property taxes
- −$3,750
- − Insurance
- −$1,250
- − Repairs & maintenance
- −$2,688
- − Management
- −$2,688
- − Depreciation
- −$7,273
- Taxable income
- $1,947
- Est. tax owed @ 24.0%
- −$467
- After-tax cash flow
- $5,344/yr
For passive investors: Depreciation is non-cash, so a rental often shows a tax loss while cash-flowing — sheltering income. Rental losses are passive: they offset passive income freely, and up to $25,000/yr can offset ordinary (W-2) income if you actively participate and your MAGI is under $100k (phasing out to $0 by $150k); unused losses carry forward. On sale, claimed depreciation is recaptured at up to 25%, and gains may owe capital-gains tax (a 1031 exchange can defer both). Figures are a year-1 estimate at your 24.0% rate — not tax advice; consult a CPA.
Schools (NCES district)
- District
- Washington County Public School District
- NCES district ID
- 5103900
- Math proficiency
- 68% ▼ -23.00%
- Reading proficiency
- 79% ▼ -7.00%
- Median HH income
- $42,412
- Composite
- 61.5/100
- National rank
- #754
- State rank
- #15 of 131 in VA
Livability — Emory
- Score
- 74/100
- State rank
- #159
- US rank
- #4933
Category grades
Schools grade is shown separately in the Schools card above.
Census & demographics
- Census place
- Emory, VA
- City population
- 5,234
- Population (ZIP)
- 4,644
Population outlook (Washington County) Hauer SSP2
- Today (2025)
- 53,266 people
- By 2030
- 52,284 · -1.8%
- By 2040
- 49,415 · -7.2%
- By 2050
- 45,683 · -14.2%
- By 2075
- 37,258 · -30.1%
- By 2100
- 27,983 · -47.5%
Race, ethnicity, and origin ACS 2023
- Neighborhood character
- Predominantly White (98%)
- Race & ethnicity
- White 98% Two or more races 1%
- Common ancestry
- Serbian 2% Italian 2% Lithuanian 1%
- Foreign-born
- 1%
- Languages at home
- 99% English-only · Spanish 1%
Political lean MEDSL · Washington
- 2024 margin
- Solid R (+53.3) · D 23.0% · R 76.3%
- 2008→2024 swing
- -20.6pp toward R · 2008: -32.7pp · 2024: -53.3pp
- All cycles
- 2024: R+53.3 2020: R+52.5 2016: R+53.5 2012: R+43.2 2008: R+32.7
Not yet ingested
- Civics
- —
Market trends
- HPI YoY
- ▲ 3.06%
- Current HPI
- 190.3097
- Rent YoY
- —
- Metro
- —
- State GDP YoY
- ▲ 2.40%
- F500 in state
- 50
Industry mix (Fortune 500 HQ in VA)
| Industry | F500 HQs | Revenue |
|---|---|---|
| Aerospace / Defense | 4 | $236B |
|
||
| Technology / Defense | 3 | $32B |
|
||
| Financial Services | 2 | $176B |
|
||
| Utilities | 2 | $27B |
|
||
| Insurance | 2 | $25B |
|
||
| Technology | 2 | $15B |
|
||
Price history
2 events — show timeline
- 2026-05-11 Pending — SWVAR
- 2026-05-08 Listed $250,000 SWVAR
Cash-flow waterfall
monthlySold comps — $/sqft
last 12 mo · ≤1 miLoading sold comps…