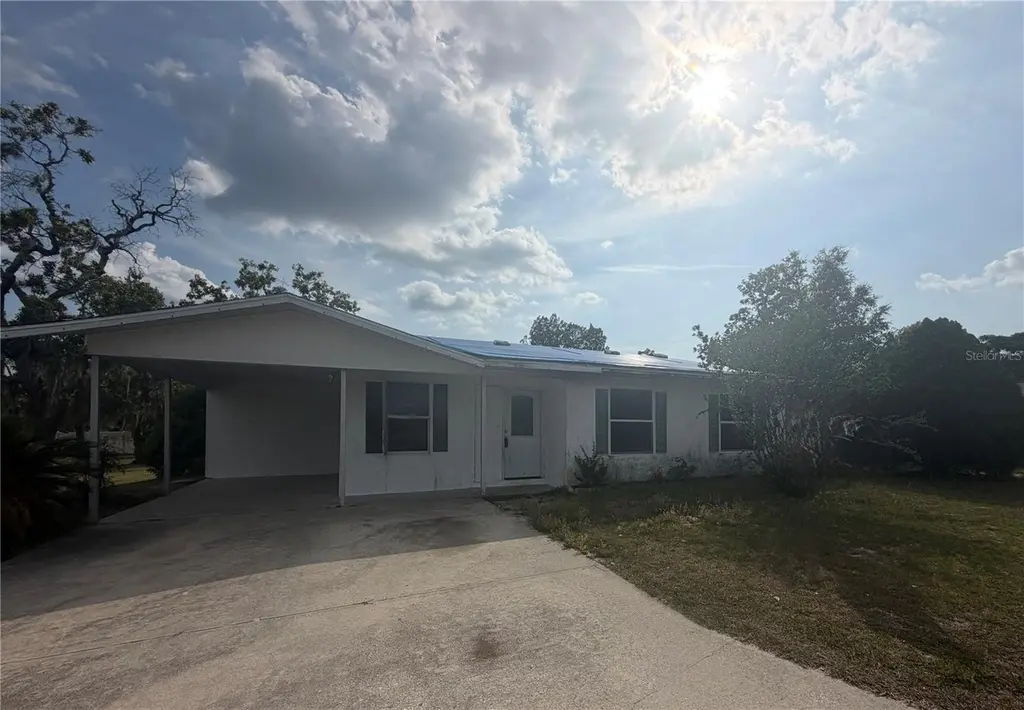
9328 SE Maricamp Rd · Silver Springs Shores, FL
Flood risk 1/10 · Minimal
- FEMA flood zone
- X (unshaded)
- Chance of flooding over 30 yrs
- 0.0%
- Est. flood insurance / yr
- $507 – $1,088
Fire risk 4/10 · Minor
- Est. fire insurance / yr
- $947 – $1,759
Heat risk 9/10 · Severe
- Hot days now (above 108°F)
- 7 days/yr
- Hot days in 30 yrs
- 22 days/yr
Wind risk 9/10 · Severe
- Chance of severe wind over 30 yrs
- 99.0%
Air-quality risk 3/10 · Minor
- Unhealthy air days now
- 3 days/yr
- Unhealthy air days in 30 yrs
- 4 days/yr
Risk factors via First Street. Map © Google.
Why this score? — see what drove the B grade
The composite is a weighted blend of 9 inputs, each scored 0–100. Each bar is that input's sub-score; the figure is the points it added to the 100-point composite (weight × sub-score).
- Cash flow +23.0/30.0
- ARV discount +15.0/15.0
- Appreciation +8.0/10.0
- DSCR +7.4/10.0
- 1% rule +6.5/10.0
- Schools +3.6/10.0
- Livability +3.4/5.0
- Rent growth +2.5/5.0
- Condition / age +2.5/5.0
$145,000
🖨 Deal sheet (PDF) 📄 Offer letter ✓ Due diligence
Listing remarks MLS
COULD BE GREAT INVESTMENT HOME.
Key facts
- Cleaned out interior
- Fenced yard
- Huge backyard
Tags
Property features AI
Finance
- Other: Lot approximately 0.27 acres (85 x 140); Living area approximately 1,410 (public records); Total acreage listed between 1/4 and less than 1/2 acre; Directions: Maricamp East past blinking light, turn/right on Water Pl, immediately turn/right on service road; house on left
- HOA & community: No HOA association reported; Pets allowed: cats and dogs
Exterior
- Parking: Covered parking; Driveway; Carport (1 space)
- Utilities: Public water; Public sewer; Electricity connected; Water connected; Sewer connected
- Home design: Single family residence; One story; Faces west; Residential zoning (R1)
- Construction: Block construction; Shingle roof; Slab foundation; Built on one level
- Exterior features: Paved road access; Sliding doors
Interior
- Kitchen: Dishwasher; Range; Refrigerator
- Bedrooms: Three bedrooms
- Flooring: Concrete; Linoleum
- Bathrooms: Two full bathrooms
- Heating & cooling: Electric heating; Central air conditioning
- Interior features: Sliding doors; Concrete and linoleum floors; Nine total rooms
- Laundry & utility: Washer hookup; Electric dryer hookup; Laundry located inside
Neighborhood map
What this means for you Summary
Snapshot
- This is a 3-bed/2.0-bath single-family listed at $145k.
Deal economics
- At list price, monthly cash flow is $257 ($3k/yr) — positive.
- The deal already cash-flows at list — no discount required.
- Meets the 1% rule at list price ($2k rent vs $145k).
- Recommended offer: $143k (1.5% below list) — sets the bar for market timing.
- Cap rate 8.4% vs local median 4.7% in Silver Springs Shores — top-decile yield for the area; either an underpriced asset or a hidden risk that comps aren't pricing in. Stress-test before assuming the spread holds.
Location & tenants
- Location reads 68/100 on livability (#527 in FL) — a middle-class / working-renter tenant base. Strengths: cost of living A+, housing A+, health & safety A-; Watch: crime C-, employment D, amenities F.
- Marion (rural): math 42% / reading 43% proficiency, ranked #61 of 73 in FL (top 84%) — families likely to look elsewhere, expect single-tenant / working-renter base with shorter leases; 61% free/reduced lunch — lower-income household profile, screen leases tightly.
- Zoned schools: Emerald Shores Elementary School (math 30% / reading 34%, grade F, #1,797 of 2,144 statewide, top 86%, 666 students, 74% FRL); Lake Weir Middle School (math 37% / reading 33%, grade F, #416 of 571 statewide, top 74%, 1,207 students, 76% FRL); Lake Weir High School (math 23% / reading 34%, grade F, #458 of 667 statewide, top 69%, 1,483 students, 68% FRL).
- Market conditions: Rents flat; 682 active listings in the ZIP; 35 comparable units currently listed for rent nearby; rentals at typical pace (median 23d on market — plan ~3-4 weeks tenant-placement turnaround); 7,071 units permitted in Marion County in 2024 (534 in 5+ unit buildings).
Forward outlook
- In year one you build about $10k of equity ($1k loan paydown + $9k appreciation (5.9% local appreciation)).
- Marion County population projected at +13% by 2050 — modest demand growth; plan on rents tracking national, not racing it.
- At projected returns (5.9% appreciation + 0.2% rent growth), your $41k cash investment doubles in ~4 years — after that, you're playing with house money.
- By year 4, paydown + projected appreciation supports a ~$33k cash-out refi (75% LTV) — recoverable capital for the next deal without selling this one.
Negotiation context
- It's been on market 15 days — a 2% lower offer ($143k) is reasonable based on typical stale-listing flexibility.
- 3 sale attempts since 21y ago; this cycle's ask has dropped $10k (6%) from the opening price — seller is motivated, your offer sets the floor, not the list.
- Current owner paid $94k; list at $145k implies a 55% gain — meaningful room to come down on a strong offer.
Risks & watch-outs
- Climate carrying-cost: severe wind risk, 99% chance of damaging wind over 30y; extreme-heat days projected 7→22/yr by 2055 (HVAC capex compounding) — expect insurance premiums to compound above CPI over the hold.
Questions for the listing agent
- Built in 1978 — when were the roof, HVAC, electrical panel, plumbing, and water heater last replaced?
- Is there a deadline driving the sale (1031 exchange, divorce, estate, relocation)? That informs how much negotiation room exists.
- Schools are F-rated, which usually means shorter tenancies and higher turnover. Who's the typical renter profile here, and what's been the actual vacancy rate?
- What's the average days-on-market for RENTAL listings here right now (not sales)? A rising rental-DOM trend means longer vacancies and softer asking-rent achievability than the comps imply.
- What's the recent tenant-quality profile in this submarket — average credit score on applications, eviction rate, late-payment / NSF rate, and stable-employment percentage? A property-management company in the area should have these aggregated.
- How much new for-sale + rental construction is in the pipeline within 1–3 miles? Heavy new supply typically softens prices + rents 12–24 months out; constrained supply supports both.
Investment metrics
- 1% rule
- 1.15% ✓
- Cap rate
- 8.42%
- Cash-on-cash
- 7.59%
- DSCR
- 1.34
- GRM
- 7.2
CMA / ARV
- ARV (median comp)
- $195,977
- List price
- $145,000
- Delta
- -26.01%
- Verdict
- UNDERPRICED
- Comps
- 20 within 1.0 mi
Show comp detail 10 sales within ~0.75 mi
| Address | Dist | Beds/Ba | Sqft | Sold | Price | $/sf | Match |
|---|---|---|---|---|---|---|---|
| 457 Water Rd | 0.20mi | 3/2.0 | 1,436 (+2%) | 1mo | $135,000 | $94 | 87 |
| 517 Bahia Track Ct | 0.30mi | 2/2.0 (-1) | 1,392 (-1%) | 21mo | $150,000 | $108 | 61 |
| 5 Water Pass | 0.54mi | 3/2.0 | 1,345 (-5%) | 10mo | $239,900 | $178 | 59 |
| 10 Bahia Way | 0.45mi | 3/2.0 | 1,388 (-2%) | 23mo | $220,000 | $159 | 58 |
| 3 Bahia Court Trce | 0.54mi | 3/2.0 | 1,506 (+7%) | 14mo | $285,000 | $189 | 52 |
| 13 Emerald Ct | 0.64mi | 3/2.0 | 1,427 (+1%) | 22mo | $250,000 | $175 | 50 |
| 806 Bahia Cir | 0.38mi | 3/2.0 | 1,270 (-10%) | 23mo | $261,000 | $206 | 47 |
| 9321 Pine Ln | 0.21mi | 3/1.0 | 1,217 (-14%) | 22mo | $188,750 | $155 | 45 |
| 13 Brook Pl | 0.70mi | 3/2.0 | 1,473 (+4%) | 21mo | $285,000 | $193 | 43 |
| 34 Bahia Court Trak | 0.62mi | 3/2.0 | 1,211 (-14%) | 17mo | $154,979 | $128 | 33 |
Match score weights: distance 35% · size 25% · config 20% · recency 20%. Top-matched comps best support the ARV.
Projected returns pro-forma
5.93% appreciation · 0.17% rent growth · sell at horizon
- IRR
- 20.0%
- Equity multiple
- 2.31×
- Total profit
- $53,085
- Equity at exit
- $90,536
- IRR
- 18.2%
- Equity multiple
- 4.33×
- Total profit
- $135,270
- Equity at exit
- $163,652
Cash invested: $40,600 (down + closing). Projections, not guarantees.
Landlord ↔ Tenant lean methodology
- Overall (STATE)
- 87 Strongly Landlord-Friendly
- State Florida
- 87 Strongly Landlord-Friendly · R+3
- County
- — inherits STATE
- City
- — inherits STATE
ZIP-level market 34472
- Home prices YoY
- 2.4%
- Rents YoY
- 0.2%
- Active inventory
- 682
- Price-to-rent
- 7.2×
Monthly cashflow live
- Estimated rent
- $1,667 high interval (Pro) →
- Mortgage (P&I)
- −$760
- Tax from tax record
- −$240 /mo · $2,874/yr
- Insurance
- −$60
- HOA
- −$0
- Vacancy / Maint / Mgmt
- −$350
- Net cashflow
- $257
Break-even live
Sensitivity live
| Price | -10% $339 | -5% $298 | +0% $257 | +5% $216 | +10% $175 |
|---|---|---|---|---|---|
| Rent | -10% $125 | -5% $191 | +0% $257 | +5% $323 | +10% $389 |
| Rate | -1.0pp $330 | -0.5pp $294 | base $257 | +0.5pp $219 | +1.0pp $181 |
UW: 25.0% down · 7.5% · 30yr · 1.5% tax · 5.0% vac · 8.0% maint · 8.0% mgmt
Financing live
Cash to close
- Down payment
- $36,250
- Closing costs
- $4,350
- Reserves months
- —
- Total cash needed
- —
Loan-product check · same deal, 3 products live
Conventional
25% down · 7.5% · 30yr
- Down + closing
- —
- Monthly P&I
- —
- Monthly cashflow
- —
- DSCR
- —
- Eligible?
- —
Personal DTI + credit; lowest rate.
DSCR
20% down · 8.5% · 30yr
- Down + closing
- —
- Monthly P&I
- —
- Monthly cashflow
- —
- DSCR
- —
- Eligible?
- —
No personal income docs; deal must DSCR.
Hard money
10% down · 12.0% · 12mo
- Down + closing
- —
- Monthly P&I
- —
- Monthly cashflow
- —
- DSCR
- —
- Eligible?
- —
Short-term bridge; refi at stabilization.
Rent comps 35 comps
| Address | Beds | Baths | Sqft | Rent | $/sqft | DOM | Units | Dist |
|---|---|---|---|---|---|---|---|---|
| 9337 Bahia Rd Ocala, FL | 3.0 | 2.0 | 1402 | $1,765 | $1.26 | 15d | 1 | 0.03mi |
| 478 Water Pl Ocala, FL | 3.0 | 2.0 | 1228 | $1,650 | $1.34 | 22d | 1 | 0.09mi |
| 455 Water Rd Ocala, FL | 3.0 | 2.0 | 1275 | $1,450 | $1.14 | 15d | 1 | 0.21mi |
| 446 Water Rd Ocala, FL | 3.0 | 2.0 | 1248 | $1,425 | $1.14 | 22d | 1 | 0.26mi |
| 708 Bahia Cir Ocala, FL | 3.0 | 2.0 | 1352 | $1,500 | $1.11 | 22d | 1 | 0.41mi |
| 12 Spring Loop Ocala, FL | 2.0 | 1.0 | 900 | $1,350 | $1.50 | 15d | 1 | 0.48mi |
| 544 Silver Crse Ocala, FL | 2.0 | 1.0 | 904 | $1,395 | $1.54 | 15d | 1 | 0.56mi |
| 619 Silver Pass Ocala, FL | 3.0 | 2.0 | 1510 | $1,495 | $0.99 | 22d | 1 | 0.58mi |
| 60 Bahia Court Trak Ocala, FL | 3.0 | 2.0 | 1413 | $1,695 | $1.20 | 22d | 1 | 0.61mi |
| 633 Silver Pass Unit B Ocala, FL | 2.0 | 2.0 | 1072 | $1,500 | $1.40 | 22d | 1 | 0.63mi |
| 593 Fairways Cir Unit A Ocala, FL | 2.0 | 1.5 | 1031 | $1,200 | $1.16 | 22d | 1 | 0.64mi |
| 549 Fairways Dr Unit A Ocala, FL | 2.0 | 2.0 | 1072 | $1,200 | $1.12 | 22d | 1 | 0.70mi |
| 561 Fairways Cir Unit A Ocala, FL | 2.0 | 1.5 | 1031 | $1,250 | $1.21 | 22d | 1 | 0.71mi |
| 9610 Bahia Rd Ocala, FL | 4.0 | 2.0 | 1617 | $1,895 | $1.17 | 22d | 1 | 0.73mi |
| 553 Fairways Cir Unit B Ocala, FL | 2.0 | 2.0 | 1304 | $1,700 | $1.30 | 15d | 1 | 0.74mi |
| 532 Bahia Cir Unit A Ocala, FL | 2.0 | 1.5 | 1027 | $1,300 | $1.27 | 22d | 1 | 0.74mi |
| 13 Pine Radial Dr Ocala, FL | 3.0 | 2.0 | 1453 | $1,795 | $1.24 | 22d | 1 | 0.78mi |
| 582 Fairways Cir Unit A Ocala, FL | 2.0 | 2.0 | 1304 | $1,500 | $1.15 | 22d | 1 | 0.79mi |
| 520 Fairways Cir Unit A Ocala, FL | 2.0 | 1.5 | 1027 | $1,100 | $1.07 | 22d | 1 | 0.80mi |
| 510 Fairways Cir Unit A Ocala, FL | 2.0 | 2.0 | 1000 | $1,299 | $1.30 | 22d | 1 | 0.82mi |
| 681 Midway Dr Unit A Ocala, FL | 2.0 | 2.0 | 1000 | $1,250 | $1.25 | 22d | 1 | 0.90mi |
| 681 Midway Dr Unit A Ocala, FL | 2.0 | 2.0 | 1000 | $1,250 | $1.25 | 15d | 1 | 0.90mi |
| 5 Cedar Ln Ocala, FL | 3.0 | 2.0 | 1064 | $1,750 | $1.64 | 22d | 1 | 0.91mi |
| 567 Midway Trak Unit H201 Ocala, FL | 3.0 | 2.0 | 1029 | $1,350 | $1.31 | 15d | 1 | 0.91mi |
| 9649 Bahia Rd Ocala, FL | 3.0 | 2.0 | 1282 | $1,595 | $1.24 | 22d | 1 | 0.97mi |
| 608 Midway Dr Unit A Ocala, FL | 2.0 | 1.5 | 1054 | $1,500 | $1.42 | 15d | 1 | 1.02mi |
| 162 Bahia Terrace Dr Ocala, FL | 2.0 | 2.0 | 984 | $1,375 | $1.40 | 22d | 1 | 1.14mi |
| 8 Ash Pass Run Ocala, FL | 3.0 | 2.0 | 1128 | $1,650 | $1.46 | 22d | 1 | 1.25mi |
| 43 Bahia Pass Ocala, FL | 3.0 | 2.0 | 1188 | $1,475 | $1.24 | 22d | 1 | 1.26mi |
| 7 Pine Run Ter Ocala, FL | 3.0 | 2.0 | 1432 | $1,500 | $1.05 | 15d | 1 | 1.32mi |
| 2 Ash Dr Ocala, FL | 3.0 | 2.0 | 1083 | $1,750 | $1.62 | 15d | 1 | 1.36mi |
| 27 Sapphire Run Ocala, FL | 3.0 | 2.0 | 1255 | $1,500 | $1.20 | 22d | 1 | 1.37mi |
| 7455 Midway Ter Unit K Ocala, FL | 2.0 | 1.0 | 904 | $1,249 | $1.38 | 22d | 1 | 1.39mi |
| 7184 Hemlock Loop Ocala, FL | 3.0 | 2.0 | 1392 | $1,675 | $1.20 | 22d | 1 | 1.40mi |
| 43 Water Track Loop Ocala, FL | 3.0 | 2.0 | 1287 | $1,799 | $1.40 | 15d | 1 | 1.46mi |
Listing history 7 events
-
2026-05-15price $145,000 577-char remark
-
2026-05-09$155,000 Active 577-char remark
-
2007-11-19historical
-
2007-01-04$125,900
-
2005-12-21soldstatus $93,500
-
2005-12-16soldstatus $93,500
Show marketing remark (31 chars)
COULD BE GREAT INVESTMENT HOME.
-
2005-11-10$93,500
Show marketing remark (31 chars)
COULD BE GREAT INVESTMENT HOME.
ⓘ Source: listings_history table (triggers on properties + properties_extension) + one-shot
backfill from property_details.listing_events for pre-trigger history.
Tax reassessment forecast FL · Resets to sale price
- Current annual tax
- $2,874 · $240/mo
- Projected year-2 tax
- $2,874 · $240/mo
- Expected delta
- $0/yr ($0/mo · 0.0%)
ⓘ Screening estimate from a state-policy table — verify with the county assessor before closing.
Climate risk First Street
- Flood 1/10 Low FEMA zone X (unshaded) · 0% chance over 30 yrs
- Wildfire 4/10 Moderate
- Heat 9/10 Extreme 7 d/yr ≥108°F today · 22 d/yr by 30 yrs out
- Wind 9/10 Extreme 99% chance of damaging wind over 30 yrs
- Air quality 3/10 Moderate 3 unhealthy d/yr today · 4 by 30 yrs out
Nearby sold comps map
Loading sold comps map…
Walkable amenities ~0.75 mi
Loading nearby amenities…
Taxation est. · year 1
- Rental income
- $20,007
- − Mortgage interest
- −$8,122
- − Property taxes
- −$2,874
- − Insurance
- −$725
- − Repairs & maintenance
- −$1,601
- − Management
- −$1,601
- − Depreciation
- −$4,218
- Taxable income
- $866
- Est. tax owed @ 24.0%
- −$208
- After-tax cash flow
- $2,874/yr
For passive investors: Depreciation is non-cash, so a rental often shows a tax loss while cash-flowing — sheltering income. Rental losses are passive: they offset passive income freely, and up to $25,000/yr can offset ordinary (W-2) income if you actively participate and your MAGI is under $100k (phasing out to $0 by $150k); unused losses carry forward. On sale, claimed depreciation is recaptured at up to 25%, and gains may owe capital-gains tax (a 1031 exchange can defer both). Figures are a year-1 estimate at your 24.0% rate — not tax advice; consult a CPA.
Schools (NCES district)
- District
- Marion
- NCES district ID
- 1201260
- Math proficiency
- 42% ▼ -7.00%
- Reading proficiency
- 43% ▼ -4.00%
- Median HH income
- $40,015
- Composite
- 35.61/100
- National rank
- #4890
- State rank
- #61 of 73 in FL
Livability — Silver Springs Shores
- Score
- 68/100
- State rank
- #527
- US rank
- #9854
Category grades
Schools grade is shown separately in the Schools card above.
Census & demographics
- Census place
- Silver Springs Shores, FL
- County
- Marion County · 315,796 people
- City population
- 34,665
- Metro
- Ocala, FL
- Population (ZIP)
- 35,851
- Household income
- $64,208
- Rent vs Own
- Severe rent burden
- 655.0
Population outlook (Marion County) Hauer SSP2
- Today (2025)
- 365,905 people
- By 2030
- 376,768 · +3.0%
- By 2040
- 396,555 · +8.4%
- By 2050
- 412,723 · +12.8%
- By 2075
- 446,090 · +21.9%
- By 2100
- 436,193 · +19.2%
Race, ethnicity, and origin ACS 2023
- Neighborhood character
- Diverse neighborhood (Simpson 0.65)
- Race & ethnicity
- White 50% Hispanic / Latino 25% Black 21% Two or more races 18% Asian 2%
- Hispanic origin (detail)
- Mexican 2% Puerto Rican 14% Cuban 3%
- Common ancestry
- Romanian 2% Iranian 1% Lithuanian 1%
- Foreign-born
- 11% · Canada, Jamaica, China
- Languages at home
- 78% English-only · Spanish 19% Other Indo-European 1%
Political lean MEDSL · Marion
- 2024 margin
- Solid R (+31.6) · D 33.8% · R 65.5%
- 2008→2024 swing
- -20.0pp toward R · 2008: -11.6pp · 2024: -31.6pp
- All cycles
- 2024: R+31.6 2020: R+25.9 2016: R+26.2 2012: R+16.2 2008: R+11.6
Not yet ingested
- Civics
- —
Market trends
- HPI YoY
- ▲ 5.93%
- Current HPI
- 255.0714
- Rent YoY
- ▲ 0.17%
- Metro
- Ocala, FL
- State GDP YoY
- ▲ 3.28%
- F500 in state
- 36
Industry mix (Fortune 500 HQ in FL)
| Industry | F500 HQs | Revenue |
|---|---|---|
| Industrial Technology | 2 | $29B |
|
||
| Insurance | 2 | $17B |
|
||
| Retail | 1 | $60B |
|
||
| Technology Distribution | 1 | $58B |
|
||
| Homebuilding | 1 | $35B |
|
||
| Technology Manufacturing | 1 | $35B |
|
||
Price history
+55.1% since first listed8 events — show timeline
- 2026-05-23 Pending — Stellar MLS as Distributed by MLS Grid
- 2026-05-15 Price Changed $145,000 Stellar MLS as Distributed by MLS Grid
- 2026-05-09 Listed $155,000 Stellar MLS as Distributed by MLS Grid
- 2007-11-19 Listing Removed — Stellar MLS as Distributed by MLS Grid
- 2007-01-04 Listed $125,900 Stellar MLS as Distributed by MLS Grid
- 2005-12-21 Sold (Public Records) $93,500 Public Records
- 2005-12-16 Sold (MLS) $93,500 Stellar MLS as Distributed by MLS Grid
- 2005-11-10 Listed $93,500 Stellar MLS as Distributed by MLS Grid
Property tax history
+9.3%/yrLatest (2025): $2,874 · +9.4% YoY. Source: county tax records.
Cash-flow waterfall
monthlySold comps — $/sqft
last 12 mo · ≤1 miLoading sold comps…