 Multi-family
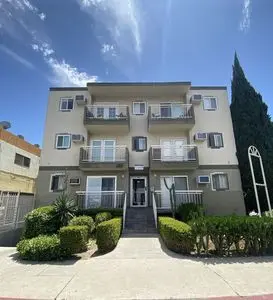
6556 La Mirada Ave · Los Angeles, CA
Flood risk 1/10 · Minimal
- FEMA flood zone
- X (unshaded)
- Chance of flooding over 30 yrs
- 0.0%
- Est. flood insurance / yr
- $507 – $1,088
Fire risk 1/10 · Minimal
- Est. fire insurance / yr
- $659 – $1,223
Heat risk 6/10 · Moderate
- Hot days now (above 90°F)
- 7 days/yr
- Hot days in 30 yrs
- 22 days/yr
Wind risk 1/10 · Minimal
- Chance of severe wind over 30 yrs
- —
Air-quality risk 5/10 · Moderate
- Unhealthy air days now
- 8 days/yr
- Unhealthy air days in 30 yrs
- 8 days/yr
Risk factors via First Street. Map © Google.
Why this score? — see what drove the D grade
The composite is a weighted blend of 9 inputs, each scored 0–100. Each bar is that input's sub-score; the figure is the points it added to the 100-point composite (weight × sub-score).
- Cash flow +15.0/30.0
- ARV discount +7.5/15.0
- 1% rule +5.0/10.0
- DSCR +5.0/10.0
- Schools +3.6/10.0
- Livability +3.4/5.0
- Rent growth +2.7/5.0
- Condition / age +2.5/5.0
- Appreciation +0.0/10.0
$10,000
🖨 Deal sheet 📄 Offer letter ✓ Due diligence
Multi-family units
County records classify this as Multi-Family (5+ Unit). Listing-text estimate: 1 unit. estimate disagrees with records
5+ unit building — per-unit beds/baths from public records are typically unavailable; the breakdown below (if shown) is an estimate from the listing text.
Listing remarks MLS
Attractive property in prime Hollywood location. Corner lot with views from most of the units. Gated entry with intercom system. Gated subterrean parking. Balconies in most of the units. Upgraded elevator. Walking distance to Hollywood and Highland and metro. Huge upside in rents. Listing agents are owners of above property and acting as a principals.
Key facts
- Built 1965
Neighborhood map
What this means for you Summary
Snapshot
- This is a 20-bed/21.0-bath multifamily listed at $10k.
Deal economics
- At list price, monthly cash flow is $8k ($98k/yr) — positive.
- The deal already cash-flows at list — no discount required.
- Meets the 1% rule at list price ($10k rent vs $10k).
- Cap rate 990.1% vs local median 2.1% in Los Angeles — top-decile yield for the area; either an underpriced asset or a hidden risk that comps aren't pricing in. Stress-test before assuming the spread holds.
Location & tenants
- Location reads 68/100 on livability (#273 in CA) — a middle-class / working-renter tenant base. Strengths: amenities A+, commute A+, employment B; Watch: health & safety C-, schools D+, crime F.
- Los Angeles Unified (urban): math 29% / reading 54% proficiency, ranked #223 of 517 in CA (top 43%) — families likely to look elsewhere, expect single-tenant / working-renter base with shorter leases; 67% free/reduced lunch — lower-income household profile, screen leases tightly.
- Market conditions: Rents flat; 87 active listings in the ZIP; 2 comparable units currently listed for rent nearby; 19,697 units permitted in Los Angeles County in 2024 (9,426 in 5+ unit buildings).
- At $10,465/mo this rent would consume 204% of the median local household income ($61k/yr) (locally 4038% of renters already pay >50% of income on rent) — very limited rent-growth headroom before tenants either downsize or default.
Forward outlook
- Local home prices are declining (-3.0%/yr); year-one equity from $69 of loan paydown is wiped out by about $300 of value loss. Plan a longer hold.
- Los Angeles County population projected at +9% by 2050 — modest demand growth; plan on rents tracking national, not racing it.
- At projected returns (-3.0% appreciation + 0.7% rent growth), your $3k cash investment doubles in ~1 year — after that, you're playing with house money.
Negotiation context
- Only 1 days on market — expect competitive offers; lowballing is unlikely to land.
- 6 sale attempts since 11y ago with the ask held roughly flat each time — persistent listings suggest the price (not the market) is what's stuck; bring a comps-based counter.
Risks & watch-outs
- Climate carrying-cost: extreme-heat days projected 7→22/yr by 2055 (HVAC capex compounding) — expect insurance premiums to compound above CPI over the hold.
Questions for the listing agent
- Built in 1965 — when were the roof, HVAC, electrical panel, plumbing, and water heater last replaced?
- Is there a deadline driving the sale (1031 exchange, divorce, estate, relocation)? That informs how much negotiation room exists.
- Schools are D-rated, which usually means shorter tenancies and higher turnover. Who's the typical renter profile here, and what's been the actual vacancy rate?
- Crime grade is F in this area — have there been break-ins, vandalism, or insurance claims at this property in the last 3 years? What carrier currently insures it and at what premium?
- The area grade is low — what's the realistic commute time and amenity access for the typical tenant pool here? Any planned neighborhood developments (good or bad) we should know about?
- What's the average days-on-market for RENTAL listings here right now (not sales)? A rising rental-DOM trend means longer vacancies and softer asking-rent achievability than the comps imply.
- What's the recent tenant-quality profile in this submarket — average credit score on applications, eviction rate, late-payment / NSF rate, and stable-employment percentage? A property-management company in the area should have these aggregated.
- How much new apartment / multifamily construction is in the pipeline within 1–3 miles? Heavy new supply (>2% of stock underway) typically softens rents 12–24 months out; light construction supports rent growth.
Investment metrics
- 1% rule
- 104.65% ✓
- Cap rate
- 990.08%
- Cash-on-cash
- 3513.53%
- DSCR
- 157.33
- GRM
- 0.1
CMA / ARV
No comps found within radius.
Projected returns pro-forma
-3.0% appreciation · 0.67% rent growth · sell at horizon
- IRR
- —
- Equity multiple
- 178.40×
- Total profit
- $496,711
- Equity at exit
- $1,491
- IRR
- —
- Equity multiple
- 362.29×
- Total profit
- $1,011,623
- Equity at exit
- $865
Cash invested: $2,800 (down + closing). Projections, not guarantees.
Landlord ↔ Tenant lean methodology
- Overall (CITY)
- 0 Strongly Tenant-Friendly
- State California
- 18 Strongly Tenant-Friendly · D+13
- County
- — inherits STATE
- City Los Angeles
- 0 Strongly Tenant-Friendly · D+22
ZIP-level market 90038
- Rents YoY
- 0.7%
- Active inventory
- 87
- Price-to-rent
- 0.2×
Monthly cashflow live
- Estimated rent
- $10,465 medium interval (Pro) →
- Mortgage (P&I)
- −$52
- Tax est. 1.5%
- −$12 /mo · $150/yr
- Insurance
- −$4
- HOA
- −$0
- Vacancy / Maint / Mgmt
- −$2,198
- Net cashflow
- $8,198
Break-even live
3-unit breakdown (identical units grouped — click to expand)
| Units | Beds | Baths | Est. rent |
|---|---|---|---|
| 3× units | 2 | 2 | $10,464 |
| #1 | 2 | 2 | $3,488 |
| #2 | 2 | 2 | $3,488 |
| #3 | 2 | 2 | $3,488 |
| Total (3 units) | $10,465 | ||
UW: 25.0% down · 7.5% · 30yr · 1.5% tax · 5.0% vac · 8.0% maint · 8.0% mgmt
Financing live
Cash to close
- Down payment
- $2,500
- Closing costs
- $300
- Reserves months
- —
- Total cash needed
- —
Loan-product check · same deal, 3 products live
Conventional
25% down · 7.5% · 30yr
- Down + closing
- —
- Monthly P&I
- —
- Monthly cashflow
- —
- DSCR
- —
- Eligible?
- —
Personal DTI + credit; lowest rate.
DSCR
20% down · 8.5% · 30yr
- Down + closing
- —
- Monthly P&I
- —
- Monthly cashflow
- —
- DSCR
- —
- Eligible?
- —
No personal income docs; deal must DSCR.
Hard money
10% down · 12.0% · 12mo
- Down + closing
- —
- Monthly P&I
- —
- Monthly cashflow
- —
- DSCR
- —
- Eligible?
- —
Short-term bridge; refi at stabilization.
Rent comps 2 comps
| Address | Beds | Baths | Sqft | Rent | $/sqft | DOM | Units | Dist |
|---|---|---|---|---|---|---|---|---|
| 5438 Romaine St Los Angeles, CA | 21.0 | 21.0 | 9437 | $26,000 | $2.76 | 43d | 1 | 1.32mi |
| 5438 Romaine St Los Angeles, CA | 21.0 | 21.0 | 9437 | $26,000 | $2.76 | 20d | 1 | 1.32mi |
Listing history 14 events
-
2026-05-26$10,000 Active
-
2021-09-13Active
-
2017-06-30soldstatus $4,782,000 353-char remark
Show marketing remark (353 chars)
Attractive property in prime Hollywood location. Corner lot with views from most of the units. Gated entry with intercom system. Gated subterrean parking. Balconies in most of the units. Upgraded elevator. Walking distance to Hollywood and Highland and metro. Huge upside in rents. Listing agents are owners of above property and acting as a principals.
-
2017-06-30soldstatus $4,782,000 Closed Sale
Show marketing remark (353 chars)
Attractive property in prime Hollywood location. Corner lot with views from most of the units. Gated entry with intercom system. Gated subterrean parking. Balconies in most of the units. Upgraded elevator. Walking distance to Hollywood and Highland and metro. Huge upside in rents. Listing agents are owners of above property and acting as a principals.
-
2017-05-17historical Active Under Contract
-
2017-03-14status Pending Sale
-
2016-12-15$4,800,000 Active
-
2016-12-14$4,800,000 353-char remark
Show marketing remark (353 chars)
Attractive property in prime Hollywood location. Corner lot with views from most of the units. Gated entry with intercom system. Gated subterrean parking. Balconies in most of the units. Upgraded elevator. Walking distance to Hollywood and Highland and metro. Huge upside in rents. Listing agents are owners of above property and acting as a principals.
-
2015-10-28historical Expired
-
2015-10-28historical
-
2015-03-19price
-
2015-03-17Active
-
2015-03-16$4,800,000
-
2001-12-07soldstatus $880,000
ⓘ Source: listings_history table (triggers on properties + properties_extension) + one-shot
backfill from property_details.listing_events for pre-trigger history.
Climate risk First Street
- Flood 1/10 Low FEMA zone X (unshaded) · 0% chance over 30 yrs
- Wildfire 1/10 Low
- Heat 6/10 Major 7 d/yr ≥90°F today · 22 d/yr by 30 yrs out
- Wind 1/10 Low
- Air quality 5/10 Major 8 unhealthy d/yr today · 8 by 30 yrs out
Nearby sold comps map
Loading sold comps map…
Walkable amenities ~0.75 mi
Loading nearby amenities…
Taxation est. · year 1
- Rental income
- $125,580
- − Mortgage interest
- −$560
- − Property taxes
- −$150
- − Insurance
- −$50
- − Repairs & maintenance
- −$10,046
- − Management
- −$10,046
- − Depreciation
- −$291
- Taxable income
- $104,436
- Est. tax owed @ 24.0%
- −$25,065
- After-tax cash flow
- $73,314/yr
For passive investors: Depreciation is non-cash, so a rental often shows a tax loss while cash-flowing — sheltering income. Rental losses are passive: they offset passive income freely, and up to $25,000/yr can offset ordinary (W-2) income if you actively participate and your MAGI is under $100k (phasing out to $0 by $150k); unused losses carry forward. On sale, claimed depreciation is recaptured at up to 25%, and gains may owe capital-gains tax (a 1031 exchange can defer both). Figures are a year-1 estimate at your 24.0% rate — not tax advice; consult a CPA.
Schools (NCES district)
- District
- Los Angeles Unified
- NCES district ID
- 0622710
- Math proficiency
- 29% ▼ -4.00%
- Reading proficiency
- 54% ▲ 10.00%
- Median HH income
- $50,403
- Composite
- 35.67/100
- National rank
- #4875
- State rank
- #223 of 517 in CA
Livability — Los Angeles
- Score
- 68/100
- State rank
- #273
- US rank
- #9237
Category grades
Schools grade is shown separately in the Schools card above.
Census & demographics
- Census place
- Los Angeles, CA
- County
- Los Angeles County · 9,444,647 people
- City population
- 3,838,149
- Metro
- Los Angeles-Long Beach-Anaheim, CA
- Population (ZIP)
- 27,127
- Household income
- $61,454
- Rent vs Own
- Severe rent burden
- 4038.0
Population outlook (Los Angeles County) Hauer SSP2
- Today (2025)
- 10,940,515 people
- By 2030
- 11,256,481 · +2.9%
- By 2040
- 11,729,929 · +7.2%
- By 2050
- 11,948,407 · +9.2%
- By 2075
- 11,818,114 · +8.0%
- By 2100
- 10,842,928 · -0.9%
Race, ethnicity, and origin ACS 2023
- Neighborhood character
- Diverse neighborhood (Simpson 0.66)
- Race & ethnicity
- Hispanic / Latino 49% White 31% Two or more races 15% Asian 7% Black 7% Native American 2%
- Hispanic origin (detail)
- Mexican 21%
- Common ancestry
- Romanian 2% Scotch-Irish 1% Lithuanian 1%
- Foreign-born
- 39% · Canada, South Korea, Jamaica
- Languages at home
- 44% English-only · Spanish 43% Other Indo-European 4% Tagalog/Filipino 2%
Political lean MEDSL · Los Angeles
- 2024 margin
- Solid D (+32.9) · D 64.8% · R 31.9% · Other 3.3%
- 2008→2024 swing
- -7.4pp toward R · 2008: 40.4pp · 2024: 32.9pp
- All cycles
- 2024: D+32.9 2020: D+44.2 2016: D+48.0 2012: D+40.0 2008: D+40.4
Not yet ingested
- Civics
- —
Market trends
- HPI YoY
- ▼ -461.01%
- Current HPI
- 349.1001
- Rent YoY
- ▲ 0.67%
- Metro
- Los Angeles-Long Beach-Anaheim, CA
- State GDP YoY
- ▲ 3.21%
- F500 in state
- 116
Industry mix (Fortune 500 HQ in CA)
| Industry | F500 HQs | Revenue |
|---|---|---|
| Technology | 27 | $1,492B |
|
||
| Financial Services | 3 | $174B |
|
||
| Retail | 3 | $44B |
|
||
| Insurance | 3 | $26B |
|
||
| Media / Entertainment | 2 | $115B |
|
||
| Pharmaceuticals / Biotech | 2 | $62B |
|
||
Price history
-98.9% since first listed14 events — show timeline
- 2026-05-26 Listed $10,000 FSBO.com
- 2021-09-13 Listed — TheMLS
- 2017-06-30 Sold (MLS) $4,782,000 CRMLS
- 2017-06-30 Sold (MLS) $4,782,000 SDMLS
- 2017-05-17 Contingent — CRMLS
- 2017-03-14 Pending — CRMLS
- 2016-12-15 Listed $4,800,000 CRMLS
- 2016-12-14 Listed $4,800,000 SDMLS
- 2015-10-28 Listing Removed — SDMLS
- 2015-10-28 Delisted — TheMLS
- 2015-03-19 Price Changed — TheMLS
- 2015-03-17 Listed — TheMLS
- 2015-03-16 Listed $4,800,000 SDMLS
- 2001-12-07 Sold (Public Records) $880,000 Public Records
Property tax history
+10.1%/yrLatest (2025): $68,131 · +1.2% YoY. Source: county tax records.
Cash-flow waterfall
monthlySold comps — $/sqft
last 12 mo · ≤1 miLoading sold comps…