10030 Brownway Ln · Old Jefferson, LA
Flood risk 1/10 · Minimal
- FEMA flood zone
- X
- Chance of flooding over 30 yrs
- 0.0%
- Est. flood insurance / yr
- $507 – $1,088
Fire risk 1/10 · Minimal
- Est. fire insurance / yr
- $1,269 – $2,357
Heat risk 8/10 · Major
- Hot days now (above 108°F)
- 7 days/yr
- Hot days in 30 yrs
- 21 days/yr
Wind risk 9/10 · Severe
- Chance of severe wind over 30 yrs
- 99.0%
Air-quality risk 3/10 · Minor
- Unhealthy air days now
- 2 days/yr
- Unhealthy air days in 30 yrs
- 3 days/yr
Risk factors via First Street. Map © Google.
Why this score? — see what drove the C grade
The composite is a weighted blend of 9 inputs, each scored 0–100. Each bar is that input's sub-score; the figure is the points it added to the 100-point composite (weight × sub-score).
- Cash flow +21.0/30.0
- ARV discount +15.0/15.0
- DSCR +6.7/10.0
- 1% rule +5.0/10.0
- Livability +3.7/5.0
- Rent growth +3.0/5.0
- Condition / age +2.5/5.0
- Schools +2.4/10.0
- Appreciation +0.0/10.0
$204,000
🖨 Deal sheet (PDF) 📄 Offer letter ✓ Due diligence
Listing remarks MLS
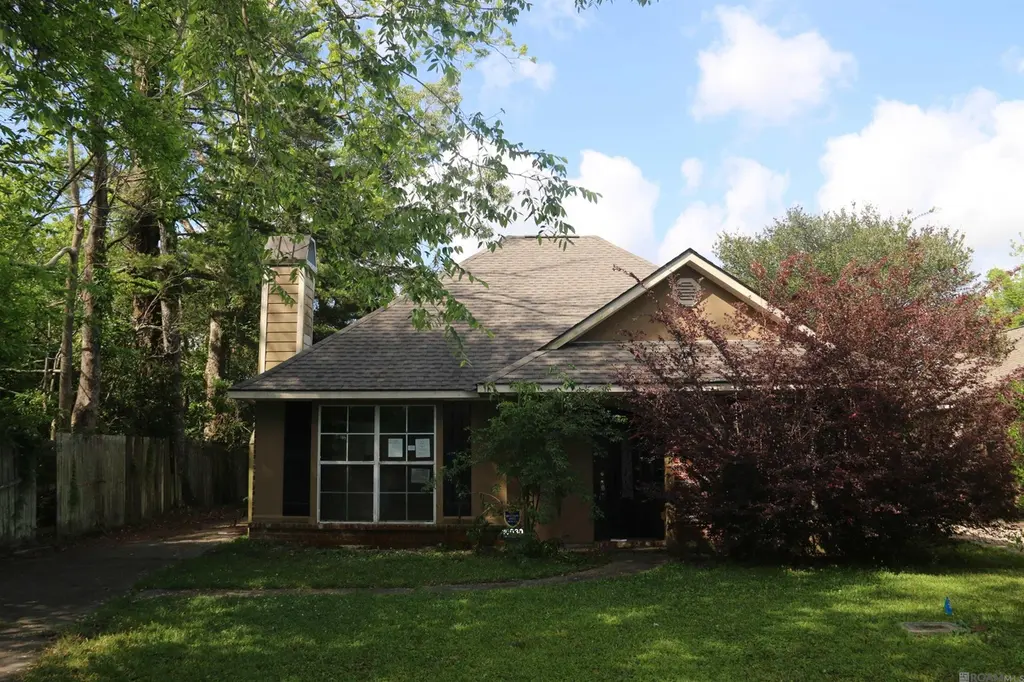
Welcome home to comfort and convenience in the heart of Baton Rouge! This charming 3-bedroom, 2-bath home is perfectly situated near a variety of shopping, dining, and everyday essentials, making it an ideal choice for easy living. Step inside to find a functional layout designed for both relaxation and entertaining. Recent updates include a brand-new roof, offering peace of mind for years to come. Outside, enjoy a fully fenced backyard—perfect for pets, gatherings, or simply unwinding in your own private space. An exterior storage building provides extra room for tools, hobbies, or seasonal items. Tucked away on a quiet dead-end street, this home offers minimal traffic and added privacy while still being close to everything Baton Rouge has to offer. Don’t miss your opportunity to own a well-located home with great features at an exceptional value!
Key facts
- 5,662 sq ft lot
- 2 parking spots
- Built 1993
Tags
Neighborhood map
What this means for you Summary
Snapshot
- This is a 3-bed/2.0-bath single-family listed at $204k.
Deal economics
- At list price, monthly cash flow is $286 ($3k/yr) — positive.
- The deal already cash-flows at list — no discount required.
- Meets the 1% rule at list price ($2k rent vs $204k).
- Recommended offer: $192k (6.0% below list) — sets the bar for market timing.
- Cap rate 8.0% vs local median 4.4% in Old Jefferson — top-decile yield for the area; either an underpriced asset or a hidden risk that comps aren't pricing in. Stress-test before assuming the spread holds.
Location & tenants
- Location reads 73/100 on livability (#36 in LA) — a middle-class / working-renter tenant base. Strengths: housing A+, employment A, cost of living A; Watch: amenities F, commute F.
- East Baton Rouge Parish (urban): math 22% / reading 34% proficiency, ranked #47 of 98 in LA (top 48%) — low school quality limits family demand, transient renter base, plan for 1-2y turnover; 77% free/reduced lunch — lower-income household profile, screen leases tightly.
- Zoned schools: Woodlawn Elementary (math 37% / reading 56%, grade D-, #159 of 646 statewide, top 25%, 718 students, 65% FRL); Woodlawn Middle School (math 20% / reading 39%, grade F, #116 of 218 statewide, top 53%, 887 students, 69% FRL); Woodlawn High School (math 25% / reading 30%, grade F, #133 of 265 statewide, top 51%, 1,527 students, 62% FRL).
- Market conditions: Rents rising (+2.0%/yr); 361 active listings in the ZIP; 9 comparable units currently listed for rent nearby; rentals at typical pace (median 21d on market — plan ~3-4 weeks tenant-placement turnaround); solid renter incomes; 2,252 units permitted in East Baton Rouge Parish in 2024 (440 in 5+ unit buildings).
Forward outlook
- Local home prices are declining (-3.0%/yr); year-one equity from $1k of loan paydown is wiped out by about $6k of value loss. Plan a longer hold.
- East Baton Rouge County population projected at +4% by 2050 — modest demand growth; plan on rents tracking national, not racing it.
Negotiation context
- It's been on market 67 days — a 6% lower offer ($192k) is reasonable based on typical stale-listing flexibility.
- 8 sale attempts since 9y ago with the ask held roughly flat each time — persistent listings suggest the price (not the market) is what's stuck; bring a comps-based counter.
Risks & watch-outs
- Climate carrying-cost: severe wind risk, 99% chance of damaging wind over 30y; extreme-heat days projected 7→21/yr by 2055 (HVAC capex compounding) — expect insurance premiums to compound above CPI over the hold.
Questions for the listing agent
- It's been on market 67 days. Have you received any prior offers? Is the seller open to a 6% concession, seller financing, or rate buy-down credit?
- Why hasn't it sold? Are there any deal-killer items the seller is aware of (foundation, flood, title, zoning, code violations)?
- Is there a deadline driving the sale (1031 exchange, divorce, estate, relocation)? That informs how much negotiation room exists.
- Schools are A-rated — typically a magnet for longer-tenancy family renters. What's the average tenant stay here, and is there a school-zone premium baked into asking?
- What's the average days-on-market for RENTAL listings here right now (not sales)? A rising rental-DOM trend means longer vacancies and softer asking-rent achievability than the comps imply.
- What's the recent tenant-quality profile in this submarket — average credit score on applications, eviction rate, late-payment / NSF rate, and stable-employment percentage? A property-management company in the area should have these aggregated.
- How much new for-sale + rental construction is in the pipeline within 1–3 miles? Heavy new supply typically softens prices + rents 12–24 months out; constrained supply supports both.
Investment metrics
- 1% rule
- 1.00% ✓
- Cap rate
- 7.98%
- Cash-on-cash
- 6.02%
- DSCR
- 1.27
- GRM
- 8.3
CMA / ARV
- ARV (median comp)
- $272,635
- List price
- $204,000
- Delta
- -25.17%
- Verdict
- UNDERPRICED
- Comps
- 20 within 1.0 mi
Show comp detail 12 sales within ~0.75 mi
| Address | Dist | Beds/Ba | Sqft | Sold | Price | $/sf | Match |
|---|---|---|---|---|---|---|---|
| 17828 Barrett Ln | 0.19mi | 3/2.0 | 1,271 (-2%) | 0mo | $219,900 | $173 | 87 |
| 17755 Barrett Ln | 0.15mi | 3/2.0 | 1,303 (+0%) | 8mo | $215,000 | $165 | 86 |
| 17726 Barrett Ln | 0.14mi | 3/2.0 | 1,283 (-1%) | 12mo | $209,000 | $163 | 81 |
| 18406 Jefferson Hwy | 0.46mi | 3/2.0 | 1,290 (-1%) | 5mo | $197,500 | $153 | 73 |
| 17525 Breman Dr | 0.61mi | 3/2.0 | 1,330 (+2%) | 0mo | $265,000 | $199 | 67 |
| 17346 Lake Wisteria Ave | 0.42mi | 3/2.0 | 1,383 (+6%) | 13mo | $250,000 | $181 | 59 |
| 10921 Grace Ln | 0.70mi | 3/2.0 | 1,351 (+4%) | 7mo | $260,000 | $192 | 55 |
| 17725 Nine Oaks Ave | 0.53mi | 3/2.0 | 1,450 (+12%) | 6mo | $235,000 | $162 | 51 |
| 18660 Cherry Oak Dr | 0.64mi | 3/2.0 | 1,418 (+9%) | 10mo | $240,000 | $169 | 47 |
| 17531 Brookfield Ave | 0.72mi | 4/2.0 (+1) | 1,356 (+4%) | 11mo | $228,000 | $168 | 45 |
| 17558 Diversion Dr | 0.66mi | 3/2.0 | 1,439 (+11%) | 10mo | $225,000 | $156 | 43 |
| 17553 Sugar Mill Ave | 0.66mi | 3/2.0 | 1,440 (+11%) | 11mo | $250,000 | $174 | 42 |
Match score weights: distance 35% · size 25% · config 20% · recency 20%. Top-matched comps best support the ARV.
Projected returns pro-forma
-3.0% appreciation · 2.05% rent growth · sell at horizon
- IRR
- -8.0%
- Equity multiple
- 0.71×
- Total profit
- $-16,767
- Equity at exit
- $30,417
- IRR
- 0.3%
- Equity multiple
- 1.02×
- Total profit
- $1,020
- Equity at exit
- $17,638
Cash invested: $57,120 (down + closing). Projections, not guarantees.
Landlord ↔ Tenant lean methodology
- Overall (STATE)
- 90 Strongly Landlord-Friendly
- State Louisiana
- 90 Strongly Landlord-Friendly · R+12
- County
- — inherits STATE
- City
- — inherits STATE
ZIP-level market 70817
- Rents YoY
- 2.0%
- Active inventory
- 361
- Price-to-rent
- 8.3×
Monthly cashflow live
- Estimated rent
- $2,047 high interval (Pro) →
- Mortgage (P&I)
- −$1,070
- Tax from tax record
- −$176 /mo · $2,108/yr
- Insurance
- −$85
- HOA
- −$0
- Vacancy / Maint / Mgmt
- −$430
- Net cashflow
- $286
Break-even live
Sensitivity live
| Price | -10% $402 | -5% $344 | +0% $286 | +5% $229 | +10% $171 |
|---|---|---|---|---|---|
| Rent | -10% $125 | -5% $206 | +0% $286 | +5% $367 | +10% $448 |
| Rate | -1.0pp $389 | -0.5pp $338 | base $286 | +0.5pp $234 | +1.0pp $180 |
UW: 25.0% down · 7.5% · 30yr · 1.5% tax · 5.0% vac · 8.0% maint · 8.0% mgmt
Financing live
Cash to close
- Down payment
- $51,000
- Closing costs
- $6,120
- Reserves months
- —
- Total cash needed
- —
Loan-product check · same deal, 3 products live
Conventional
25% down · 7.5% · 30yr
- Down + closing
- —
- Monthly P&I
- —
- Monthly cashflow
- —
- DSCR
- —
- Eligible?
- —
Personal DTI + credit; lowest rate.
DSCR
20% down · 8.5% · 30yr
- Down + closing
- —
- Monthly P&I
- —
- Monthly cashflow
- —
- DSCR
- —
- Eligible?
- —
No personal income docs; deal must DSCR.
Hard money
10% down · 12.0% · 12mo
- Down + closing
- —
- Monthly P&I
- —
- Monthly cashflow
- —
- DSCR
- —
- Eligible?
- —
Short-term bridge; refi at stabilization.
Rent comps 9 comps
| Address | Beds | Baths | Sqft | Rent | $/sqft | DOM | Units | Dist |
|---|---|---|---|---|---|---|---|---|
| 18585 Lakefield Ave Baton Rouge, LA | 3.0 | 2.0 | 1616 | $2,100 | $1.30 | 20d | 1 | 0.50mi |
| 18482 Lake Iris Ave Baton Rouge, LA | 3.0 | 2.0 | 1580 | $2,895 | $1.83 | 20d | 1 | 0.59mi |
| 18614 Jefferson Hwy Baton Rouge, LA | 2.0 | 1.5 | 1000 | $925 | $0.93 | 16d | 1 | 0.59mi |
| 9113 Alder Dr Baton Rouge, LA | 3.0 | 2.0 | 1327 | $1,700 | $1.28 | 25d | 1 | 1.19mi |
| 17950 Airline Hwy Prairieville, LA | 1.0–3.0 | 1.0–2.0 | 964 | $1,850 | $1.92 | 16d | 15 | 1.28mi |
| 17653 Carlisle Ave Baton Rouge, LA | 4.0 | 2.0 | 1601 | $2,125 | $1.33 | 16d | 1 | 1.29mi |
| 16333 Columns Way Baton Rouge, LA | 1.0–3.0 | 1.0–2.0 | 1036 | $2,050 | $1.98 | 16d | 41 | 1.33mi |
| 8049 S Hendrick Dr Baton Rouge, LA | 4.0 | 2.0 | 1601 | $2,095 | $1.31 | 45d | 1 | 1.34mi |
| 8040 S Hendrick Dr Baton Rouge, LA | 3.0 | 2.0 | 1618 | $2,025 | $1.25 | 45d | 1 | 1.36mi |
Listing history 33 events
-
2026-06-22days on market $204,000 Active 67 DOM
-
2026-06-18days on market $204,000 Active 64 DOM
-
2026-06-17days on market $204,000 Active 63 DOM
-
2026-06-16days on market $204,000 Active 62 DOM
-
2026-06-15days on market $204,000 Active 61 DOM
-
2026-06-14days on market $204,000 Active 59 DOM
-
2026-06-10days on market $204,000 Active 56 DOM
-
2026-06-09days on market $204,000 Active 55 DOM
-
2026-06-08days on market $204,000 Active 54 DOM
-
2026-06-07days on market $204,000 Active 53 DOM
-
2026-06-05days on market $204,000 Active 50 DOM
-
2026-06-03days on market $204,000 Active 49 DOM
-
2026-06-02days on market $204,000 Active 48 DOM
-
2026-06-01days on market $204,000 Active 47 DOM
-
2026-05-31days on market $204,000 Active 46 DOM
-
2026-05-31days on market $204,000 Active 45 DOM
-
2026-04-16$204,000 Active 872-char remark
Show marketing remark (872 chars)
Welcome home to comfort and convenience in the heart of Baton Rouge! This charming 3-bedroom, 2-bath home is perfectly situated near a variety of shopping, dining, and everyday essentials, making it an ideal choice for easy living. Step inside to find a functional layout designed for both relaxation and entertaining. Recent updates include a brand-new roof, offering peace of mind for years to come. Outside, enjoy a fully fenced backyard—perfect for pets, gatherings, or simply unwinding in your own private space. An exterior storage building provides extra room for tools, hobbies, or seasonal items. Tucked away on a quiet dead-end street, this home offers minimal traffic and added privacy while still being close to everything Baton Rouge has to offer. Don’t miss your opportunity to own a well-located home with great features at an exceptional value!
-
2026-04-15$204,000 Active 861-char remark
Show marketing remark (861 chars)
Welcome home to comfort and convenience in the heart of Baton Rouge! This charming 3-bedroom, 2-bath home is perfectly situated near a variety of shopping, dining, and everyday essentials, making it an ideal choice for easy living. Step inside to find a functional layout designed for both relaxation and entertaining. Recent updates include a brand-new roof, offering peace of mind for years to come. Outside, enjoy a fully fenced backyard--perfect for pets, gatherings, or simply unwinding in your own private space. An exterior storage building provides extra room for tools, hobbies, or seasonal items. Tucked away on a quiet dead-end street, this home offers minimal traffic and added privacy while still being close to everything Baton Rouge has to offer. Don't miss your opportunity to own a well-located home with great features at an exceptional value!
-
2021-02-23soldstatus $185,000
-
2021-02-19soldstatus Sold
-
2020-12-07status Pending
-
2020-12-03$185,000 Active
-
2020-12-03$185,000
-
2020-11-30historical
-
2020-11-10status Pending
-
2020-11-09$185,000 Active
-
2020-11-09$185,000
-
2017-10-27soldstatus $170,000
-
2017-10-26soldstatus Sold
-
2017-09-25status Pending
-
2017-09-22$170,000 Active
-
2017-09-22$170,000
-
2005-08-02soldstatus $125,000
ⓘ Source: listings_history table (triggers on properties + properties_extension) + one-shot
backfill from property_details.listing_events for pre-trigger history.
Tax reassessment forecast LA · Resets to sale price
- Current annual tax
- $2,108 · $176/mo
- Projected year-2 tax
- $2,108 · $176/mo
- Expected delta
- $0/yr ($0/mo · 0.0%)
ⓘ Screening estimate from a state-policy table — verify with the county assessor before closing.
Climate risk First Street
- Flood 1/10 Low FEMA zone X · 0% chance over 30 yrs
- Wildfire 1/10 Low
- Heat 8/10 Severe 7 d/yr ≥108°F today · 21 d/yr by 30 yrs out
- Wind 9/10 Extreme 99% chance of damaging wind over 30 yrs
- Air quality 3/10 Moderate 2 unhealthy d/yr today · 3 by 30 yrs out
Nearby sold comps map
Loading sold comps map…
Walkable amenities ~0.75 mi
Loading nearby amenities…
Taxation est. · year 1
- Rental income
- $24,561
- − Mortgage interest
- −$11,427
- − Property taxes
- −$2,108
- − Insurance
- −$1,020
- − Repairs & maintenance
- −$1,965
- − Management
- −$1,965
- − Depreciation
- −$5,935
- Taxable income
- $142
- Est. tax owed @ 24.0%
- −$34
- After-tax cash flow
- $3,404/yr
For passive investors: Depreciation is non-cash, so a rental often shows a tax loss while cash-flowing — sheltering income. Rental losses are passive: they offset passive income freely, and up to $25,000/yr can offset ordinary (W-2) income if you actively participate and your MAGI is under $100k (phasing out to $0 by $150k); unused losses carry forward. On sale, claimed depreciation is recaptured at up to 25%, and gains may owe capital-gains tax (a 1031 exchange can defer both). Figures are a year-1 estimate at your 24.0% rate — not tax advice; consult a CPA.
Schools (NCES district)
- District
- East Baton Rouge Parish
- NCES district ID
- 2200540
- Math proficiency
- 22% ▼ -36.00%
- Reading proficiency
- 34% ▼ -31.00%
- Median HH income
- $46,263
- Composite
- 24.14/100
- National rank
- #7745
- State rank
- #47 of 98 in LA
Livability — Old Jefferson
- Score
- 73/100
- State rank
- #36
- US rank
- #5501
Category grades
Schools grade is shown separately in the Schools card above.
Census & demographics
- Census place
- Old Jefferson, LA
- County
- East Baton Rouge Parish · 399,686 people
- Metro
- Baton Rouge, LA
- Population (ZIP)
- 33,482
- Household income
- $102,639
- Rent vs Own
- Severe rent burden
- 755.0
Population outlook (East Baton Rouge County) Hauer SSP2
- Today (2025)
- 464,810 people
- By 2030
- 472,137 · +1.6%
- By 2040
- 480,243 · +3.3%
- By 2050
- 484,422 · +4.2%
- By 2075
- 492,069 · +5.9%
- By 2100
- 476,347 · +2.5%
Race, ethnicity, and origin ACS 2023
- Neighborhood character
- Majority White (64%)
- Race & ethnicity
- White 64% Black 21% Two or more races 9% Hispanic / Latino 5% Asian 3%
- Common ancestry
- Lithuanian 13% Italian 2% Serbian 2%
- Foreign-born
- 6% · Canada, Vietnam, China
- Languages at home
- 91% English-only · Spanish 3% Arabic 1% Vietnamese 1%
Political lean MEDSL · East Baton Rouge
- 2024 margin
- D (+11.1) · D 54.5% · R 43.4% · Other 2.1%
- 2008→2024 swing
- +8.9pp toward D · 2008: 2.2pp · 2024: 11.1pp
- All cycles
- 2024: D+11.1 2020: D+13.1 2016: D+9.2 2012: D+5.2 2008: D+2.2
Not yet ingested
- Civics
- —
Market trends
- HPI YoY
- ▼ -149.27%
- Current HPI
- 170.6826
- Rent YoY
- ▲ 2.05%
- Metro
- Baton Rouge, LA
- State GDP YoY
- ▲ 3.29%
- F500 in state
- 10
Industry mix (Fortune 500 HQ in LA)
| Industry | F500 HQs | Revenue |
|---|---|---|
| Telecommunications | 2 | $23B |
|
||
| Utilities | 1 | $12B |
|
||
| Wholesale / Distribution | 1 | $5B |
|
||
| Advertising | 1 | $2B |
|
||
Price history
+63.2% since first listed17 events — show timeline
- 2026-04-16 Listed $204,000 GBRMLS
- 2026-04-15 Listed $204,000 AcadianaMLS
- 2021-02-23 Sold (Public Records) $185,000 Public Records
- 2021-02-19 Sold (MLS) — GBRMLS
- 2020-12-07 Pending — GBRMLS
- 2020-12-03 Listed $185,000 AcadianaMLS
- 2020-12-03 Listed $185,000 GBRMLS
- 2020-11-30 Delisted — GBRMLS
- 2020-11-10 Pending — GBRMLS
- 2020-11-09 Listed $185,000 AcadianaMLS
- 2020-11-09 Listed $185,000 GBRMLS
- 2017-10-27 Sold (Public Records) $170,000 Public Records
- 2017-10-26 Sold (MLS) — GBRMLS
- 2017-09-25 Pending — GBRMLS
- 2017-09-22 Listed $170,000 GBRMLS
- 2017-09-22 Listed $170,000 AcadianaMLS
- 2005-08-02 Sold (Public Records) $125,000 Public Records
Property tax history
+11.6%/yrLatest (2025): $2,108 · -0.5% YoY. Source: county tax records.
Cash-flow waterfall
monthlySold comps — $/sqft
last 12 mo · ≤1 miLoading sold comps…