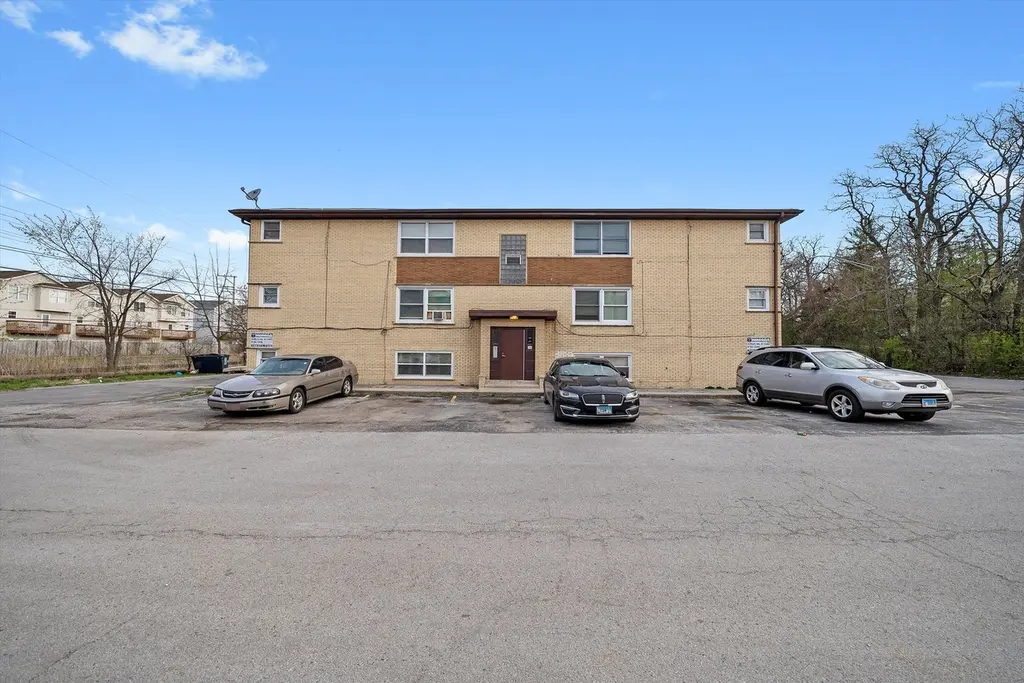
 Fourplex
12456 Fairview Ave · Blue Island, IL
Flood risk 1/10 · Minimal
- FEMA flood zone
- X (unshaded)
- Chance of flooding over 30 yrs
- 0.0%
- Est. flood insurance / yr
- $473 – $860
Fire risk 1/10 · Minimal
- Est. fire insurance / yr
- $804 – $1,492
Heat risk 3/10 · Minor
- Hot days now (above 101°F)
- 7 days/yr
- Hot days in 30 yrs
- 15 days/yr
Wind risk 2/10 · Minimal
- Chance of severe wind over 30 yrs
- —
Air-quality risk 4/10 · Minor
- Unhealthy air days now
- 4 days/yr
- Unhealthy air days in 30 yrs
- 6 days/yr
Risk factors via First Street. Map © Google.
Why this score? — see what drove the C+ grade
The composite is a weighted blend of 9 inputs, each scored 0–100. Each bar is that input's sub-score; the figure is the points it added to the 100-point composite (weight × sub-score).
- Cash flow +29.3/30.0
- 1% rule +10.0/10.0
- DSCR +10.0/10.0
- Livability +3.9/5.0
- ARV discount +3.5/15.0
- Rent growth +2.5/5.0
- Condition / age +2.5/5.0
- Schools +1.6/10.0
- Appreciation +0.0/10.0
$545,000
🖨 Deal sheet (PDF) 📄 Offer letter ✓ Due diligence
Multi-family units
County records classify this as Multi-Family (5+ Unit). Listing-text estimate: 4 units. estimate disagrees with records
5+ unit building — per-unit beds/baths from public records are typically unavailable; the breakdown below (if shown) is an estimate from the listing text.
Listing remarks MLS
Six-Unit Blue island multifamily located in a good rental area. The property consists of five 2-Br, one bath units and, One 1-Bedroom, 1-Bath unit. Fully rented. The building is located close to I-57 & I-294. parking lot with six parking spaces. Please reference 12452 Fairview owned by the same seller. Rent roll / expenses due on request.
Key facts
- Six parking spaces
- Six-unit multifamily
- Parking lot
Tags
Neighborhood map
What this means for you Summary
Snapshot
- This is a 4 × 2-bed/?-bath units multifamily listed at $545k.
Deal economics
- At list price, monthly cash flow is $2k ($23k/yr) — positive. Per door: $480/mo.
- The deal already cash-flows at list — no discount required.
- Meets the 1% rule at list price ($8k rent vs $545k).
- Recommended offer: $480k (12.0% below list) — sets the bar for market timing.
- Cap rate 10.5% vs local median 6.6% in Blue Island — top-decile yield for the area; either an underpriced asset or a hidden risk that comps aren't pricing in. Stress-test before assuming the spread holds.
Location & tenants
- Location reads 77/100 on livability (#159 in IL, #2,964 nationally) — a middle-class / working-renter tenant base. Strengths: commute A+, cost of living A+, housing A+; Watch: employment C-, crime F, amenities D-.
- Chsd 218 (suburban): math 14% / reading 20% proficiency, ranked #454 of 620 in IL (top 73%) — low school quality limits family demand, transient renter base, plan for 1-2y turnover.
- Zoned schools: George Washington Elementary Sch (238 students, 0% FRL); Veterans Memorial Middle Sch (math 24% / reading 24%, grade F, #332 of 665 statewide, top 55%, 370 students, 0% FRL); A B Shepard High Sch (Campus) (math 16% / reading 25%, grade F, #350 of 693 statewide, top 51%, 1,973 students, 0% FRL).
- Market conditions: 44 active listings in the ZIP; 6,272 units permitted in Cook County in 2024 (4,658 in 5+ unit buildings).
Forward outlook
- Local home prices are declining (-3.0%/yr); year-one equity from $4k of loan paydown is wiped out by about $16k of value loss. Plan a longer hold.
- At projected returns (-3.0% appreciation + 3.0% rent growth), your $153k cash investment doubles in ~8 years — after that, you're playing with house money.
Negotiation context
- It's been on market 425 days — a 12% lower offer ($480k) is reasonable based on typical stale-listing flexibility.
Risks & watch-outs
- Watch-outs: property tax is 3.3% of price.
Questions for the listing agent
- It's been on market 425 days. Have you received any prior offers? Is the seller open to a 12% concession, seller financing, or rate buy-down credit?
- Can we see the unit-by-unit rent roll, current vacancy, and any below-market leases? What's the average tenancy length?
- What capital expenditures (roof, boiler, parking lot, exteriors) have been made in the last 5 years, and what's planned in the next 2?
- Built in 1963 — when were the roof, HVAC, electrical panel, plumbing, and water heater last replaced?
- Property tax is high relative to price — has the assessment been appealed recently, and will the sale trigger a re-assessment?
- Why hasn't it sold? Are there any deal-killer items the seller is aware of (foundation, flood, title, zoning, code violations)?
- Is there a deadline driving the sale (1031 exchange, divorce, estate, relocation)? That informs how much negotiation room exists.
- Schools are F-rated, which usually means shorter tenancies and higher turnover. Who's the typical renter profile here, and what's been the actual vacancy rate?
- Crime grade is F in this area — have there been break-ins, vandalism, or insurance claims at this property in the last 3 years? What carrier currently insures it and at what premium?
- What's the average days-on-market for RENTAL listings here right now (not sales)? A rising rental-DOM trend means longer vacancies and softer asking-rent achievability than the comps imply.
- What's the recent tenant-quality profile in this submarket — average credit score on applications, eviction rate, late-payment / NSF rate, and stable-employment percentage? A property-management company in the area should have these aggregated.
- How much new apartment / multifamily construction is in the pipeline within 1–3 miles? Heavy new supply (>2% of stock underway) typically softens rents 12–24 months out; light construction supports rent growth.
Investment metrics
- 1% rule
- 1.51% ✓
- Cap rate
- 10.52%
- Cash-on-cash
- 15.11%
- DSCR
- 1.67
- GRM
- 5.5
CMA / ARV
- ARV (median comp)
- $500,037
- List price
- $545,000
- Delta
- 8.99%
- Verdict
- FAIR
- Comps
- 5 within 1.0 mi
Show comp detail 1 sale within ~0.75 mi
| Address | Dist | Beds/Ba | Sqft | Sold | Price | $/sf | Match |
|---|---|---|---|---|---|---|---|
| 12840 Mozart St | 0.48mi | 10/5.0 | 5,030 (-5%) | 18mo | $440,000 | $87 | 50 |
Match score weights: distance 35% · size 25% · config 20% · recency 20%. Top-matched comps best support the ARV.
Projected returns pro-forma
-3.0% appreciation · 3.0% rent growth · sell at horizon
- IRR
- 5.8%
- Equity multiple
- 1.23×
- Total profit
- $34,667
- Equity at exit
- $81,261
- IRR
- 15.3%
- Equity multiple
- 2.25×
- Total profit
- $190,250
- Equity at exit
- $47,122
Cash invested: $152,600 (down + closing). Projections, not guarantees.
Landlord ↔ Tenant lean methodology
- Overall (STATE)
- 43 Moderately Tenant-Leaning
- State Illinois
- 43 Moderately Tenant-Leaning · D+7
- County
- — inherits STATE
- City
- — inherits STATE
ZIP-level market 60406
- Home prices YoY
- -26.8%
- Active inventory
- 44
- Price-to-rent
- 22.1×
Monthly cashflow live
- Estimated rent
- $8,211 high interval (Pro) →
- Mortgage (P&I)
- −$2,858
- Tax from tax record
- −$1,480 /mo · $17,764/yr
- Insurance
- −$227
- HOA
- −$0
- Vacancy / Maint / Mgmt
- −$1,724
- Net cashflow
- $1,921
Break-even live
Sensitivity live
| Price | -10% $2,230 | -5% $2,076 | +0% $1,921 | +5% $1,767 | +10% $1,613 |
|---|---|---|---|---|---|
| Rent | -10% $1,273 | -5% $1,597 | +0% $1,921 | +5% $2,246 | +10% $2,570 |
| Rate | -1.0pp $2,196 | -0.5pp $2,060 | base $1,921 | +0.5pp $1,780 | +1.0pp $1,636 |
4-unit breakdown (identical units grouped — click to expand)
| Units | Beds | Baths | Est. rent |
|---|---|---|---|
| 4× units | 2 | — | $8,212 |
| #1 | 2 | — | $2,053 |
| #2 | 2 | — | $2,053 |
| #3 | 2 | — | $2,053 |
| #4 | 2 | — | $2,053 |
| Total (4 units) | $8,211 | ||
UW: 25.0% down · 7.5% · 30yr · 1.5% tax · 5.0% vac · 8.0% maint · 8.0% mgmt
Financing live
Cash to close
- Down payment
- $136,250
- Closing costs
- $16,350
- Reserves months
- —
- Total cash needed
- —
Loan-product check · same deal, 3 products live
Conventional
25% down · 7.5% · 30yr
- Down + closing
- —
- Monthly P&I
- —
- Monthly cashflow
- —
- DSCR
- —
- Eligible?
- —
Personal DTI + credit; lowest rate.
DSCR
20% down · 8.5% · 30yr
- Down + closing
- —
- Monthly P&I
- —
- Monthly cashflow
- —
- DSCR
- —
- Eligible?
- —
No personal income docs; deal must DSCR.
Hard money
10% down · 12.0% · 12mo
- Down + closing
- —
- Monthly P&I
- —
- Monthly cashflow
- —
- DSCR
- —
- Eligible?
- —
Short-term bridge; refi at stabilization.
Listing history 19 events
-
2026-06-21days on market $545,000 Active 425 DOM
-
2026-06-18days on market $545,000 Active 422 DOM
-
2026-06-17days on market $545,000 Active 421 DOM
-
2026-06-16days on market $545,000 Active 420 DOM
-
2026-06-15days on market $545,000 Active 419 DOM
-
2026-06-13days on market $545,000 Active 417 DOM
-
2026-06-09days on market $545,000 Active 413 DOM
-
2026-06-08days on market $545,000 Active 412 DOM
-
2026-06-07days on market $545,000 Active 411 DOM
-
2026-06-04days on market $545,000 Active 408 DOM
-
2026-06-03days on market $545,000 Active 407 DOM
-
2026-06-02days on market $545,000 Active 406 DOM
-
2026-06-01days on market $545,000 Active 405 DOM
-
2026-05-31days on market $545,000 Active 404 DOM
-
2025-04-25price $545,000 344-char remark
Show marketing remark (344 chars)
Six-Unit Blue island multifamily located in a good rental area. The property consists of five 2-Br, one bath units and, One 1-Bedroom, 1-Bath unit. Fully rented. The building is located close to I-57 & I-294. parking lot with six parking spaces. Please reference 12452 Fairview owned by the same seller. Rent roll / expenses due on request.
-
2025-04-22$595,000 Active 344-char remark
Show marketing remark (344 chars)
Six-Unit Blue island multifamily located in a good rental area. The property consists of five 2-Br, one bath units and, One 1-Bedroom, 1-Bath unit. Fully rented. The building is located close to I-57 & I-294. parking lot with six parking spaces. Please reference 12452 Fairview owned by the same seller. Rent roll / expenses due on request.
-
2021-04-27soldstatus $640,000
-
2008-07-10soldstatus $520,000
-
1987-10-28soldstatus $155,000
ⓘ Source: listings_history table (triggers on properties + properties_extension) + one-shot
backfill from property_details.listing_events for pre-trigger history.
Tax reassessment forecast IL · Partial reset (capped growth)
- Current annual tax
- $17,764 · $1,480/mo
- Projected year-2 tax
- $17,764 · $1,480/mo
- Expected delta
- $0/yr ($0/mo · 0.0%)
ⓘ Screening estimate from a state-policy table — verify with the county assessor before closing.
Climate risk First Street
- Flood 1/10 Low FEMA zone X (unshaded) · 0% chance over 30 yrs
- Wildfire 1/10 Low
- Heat 3/10 Moderate 7 d/yr ≥101°F today · 15 d/yr by 30 yrs out
- Wind 2/10 Low
- Air quality 4/10 Moderate 4 unhealthy d/yr today · 6 by 30 yrs out
Nearby sold comps map
Loading sold comps map…
Walkable amenities ~0.75 mi
Loading nearby amenities…
Taxation est. · year 1
- Rental income
- $98,532
- − Mortgage interest
- −$30,528
- − Property taxes
- −$17,764
- − Insurance
- −$2,725
- − Repairs & maintenance
- −$7,883
- − Management
- −$7,883
- − Depreciation
- −$15,855
- Taxable income
- $15,895
- Est. tax owed @ 24.0%
- −$3,815
- After-tax cash flow
- $19,240/yr
For passive investors: Depreciation is non-cash, so a rental often shows a tax loss while cash-flowing — sheltering income. Rental losses are passive: they offset passive income freely, and up to $25,000/yr can offset ordinary (W-2) income if you actively participate and your MAGI is under $100k (phasing out to $0 by $150k); unused losses carry forward. On sale, claimed depreciation is recaptured at up to 25%, and gains may owe capital-gains tax (a 1031 exchange can defer both). Figures are a year-1 estimate at your 24.0% rate — not tax advice; consult a CPA.
Schools (NCES district)
- District
- Chsd 218
- NCES district ID
- 1706540
- Math proficiency
- 14% ▼ -4.00%
- Reading proficiency
- 20% ▼ -1.00%
- Median HH income
- $57,166
- Composite
- 16.09/100
- National rank
- #9235
- State rank
- #454 of 620 in IL
Livability — Blue Island
- Score
- 77/100
- State rank
- #159
- US rank
- #2964
Category grades
Schools grade is shown separately in the Schools card above.
Census & demographics
- Census place
- Blue Island, IL
- City population
- 24,887
- Population (ZIP)
- 24,887
Population outlook (Cook County) Hauer SSP2
- Today (2025)
- 5,347,519 people
- By 2030
- 5,357,703 · +0.2%
- By 2040
- 5,324,924 · -0.4%
- By 2050
- 5,230,762 · -2.2%
- By 2075
- 4,785,735 · -10.5%
- By 2100
- 4,188,836 · -21.7%
Race, ethnicity, and origin ACS 2023
- Neighborhood character
- Diverse neighborhood (Simpson 0.65)
- Race & ethnicity
- Hispanic / Latino 44% Black 34% White 19% Two or more races 8%
- Hispanic origin (detail)
- Mexican 39%
- Common ancestry
- Romanian 2% English 1% Iranian 1%
- Foreign-born
- 19% · Canada
- Languages at home
- 65% English-only · Spanish 33% Other Indo-European 1%
Political lean MEDSL · Cook
- 2024 margin
- Solid D (+42.0) · D 70.4% · R 28.4% · Other 1.2%
- 2008→2024 swing
- -11.4pp toward R · 2008: 53.4pp · 2024: 42.0pp
- All cycles
- 2024: D+42.0 2020: D+50.3 2016: D+53.0 2012: D+49.4 2008: D+53.4
Not yet ingested
- Civics
- —
Market trends
- HPI YoY
- ▼ -94.77%
- Current HPI
- 259.492
- Rent YoY
- —
- Metro
- —
- State GDP YoY
- ▲ 1.59%
- F500 in state
- 60
Industry mix (Fortune 500 HQ in IL)
| Industry | F500 HQs | Revenue |
|---|---|---|
| Insurance | 4 | $201B |
|
||
| Consumer Goods | 4 | $87B |
|
||
| Industrial Machinery | 3 | $64B |
|
||
| Healthcare | 2 | $55B |
|
||
| Retail / Pharmacy | 1 | $148B |
|
||
| Agriculture / Food | 1 | $86B |
|
||
Price history
+251.6% since first listed5 events — show timeline
- 2025-04-25 Price Changed $545,000 MRED as Distributed by MLS Grid
- 2025-04-22 Listed $595,000 MRED as Distributed by MLS Grid
- 2021-04-27 Sold (Public Records) $640,000 Public Records
- 2008-07-10 Sold (Public Records) $520,000 Public Records
- 1987-10-28 Sold (Public Records) $155,000 Public Records
Property tax history
+5.1%/yrLatest (2023): $17,764 · +21.2% YoY. Source: county tax records.
Cash-flow waterfall
monthlySold comps — $/sqft
last 12 mo · ≤1 miLoading sold comps…