991 US Hwy 34 · Herod, IL
Flood risk 1/10 · Minimal
- FEMA flood zone
- —
- Chance of flooding over 30 yrs
- 0.0%
- Est. flood insurance / yr
- —
Fire risk 4/10 · Minor
- Est. fire insurance / yr
- $804 – $1,492
Heat risk 5/10 · Moderate
- Hot days now (above 106°F)
- 7 days/yr
- Hot days in 30 yrs
- 21 days/yr
Wind risk 2/10 · Minimal
- Chance of severe wind over 30 yrs
- 3.0%
Air-quality risk 2/10 · Minimal
- Unhealthy air days now
- 1 days/yr
- Unhealthy air days in 30 yrs
- 2 days/yr
Risk factors via First Street. Map © Google.
Why this score? — see what drove the B- grade
The composite is a weighted blend of 9 inputs, each scored 0–100. Each bar is that input's sub-score; the figure is the points it added to the 100-point composite (weight × sub-score).
- Cash flow +30.0/30.0
- 1% rule +10.0/10.0
- DSCR +10.0/10.0
- Appreciation +7.2/10.0
- Rent growth +2.5/5.0
- Livability +2.5/5.0
- Condition / age +2.5/5.0
- Schools +1.4/10.0
- ARV discount +0.0/15.0
$59,900
🖨 Deal sheet (PDF) 📄 Offer letter ✓ Due diligence
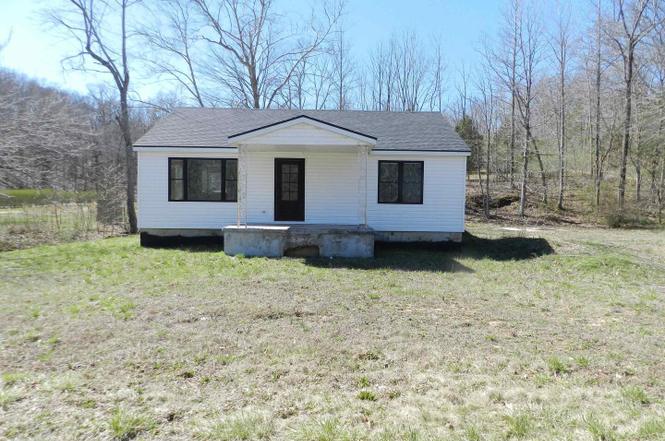
Listing remarks
Check out this great little starter home or investment, rental, air bnb or vrbo property. This home is in northern Pope County IL, the location is great for hunters, fishermen, horseback riders and outdoor enthusiasts, located near Garden of the Gods, Ohio River, Cave in Rock, Pounds Hollow and more in the heart of the Shawnee National Forest. The home was taken down to the studs and completely rebuilt new framing, drywall, electrical, plumbing, roof and HVAC. The basement has been sealed and spray foamed and is dry, this makes finishing the sewer and plumbing very easy. The basement could also be finished out for more living space. Outside is a spacious . 5 acre lot with room to put a few
Key facts
- New drywall
- New plumbing
- New hvac
Tags
Property features AI
Finance
- Other: School bus service available; Property located in unincorporated area
- HOA & community: No master association fee required
Exterior
- Parking: Gravel parking
- Utilities: Public water; Septic tank
- Home design: Detached single-family home; One story; Fee simple ownership; Rebuilt/rehab completed in 2023; Estimated living area
- Construction: Vinyl siding with frame construction; Block foundation
- Exterior features: Level lot; Creek on the property; Lot dimensions: 153 151 102 128 233 90; Approximately 0.5–0.99 acre
Interior
- Kitchen: Kitchen on main level (14 x 19)
- Bedrooms: Master bedroom on main level (10 x 15) with full bath access; Second bedroom on main level (9 x 16); Additional bedrooms noted
- Flooring: Other flooring in main living areas and bedrooms
- Bathrooms: Two full bathrooms
- Heating & cooling: Electric heating with heat pump and steam; Central air conditioning
- Interior features: Four total rooms; Unfinished full basement with egress window
- Laundry & utility: Main-level laundry room (8 x 17); Electric water heater
Neighborhood map
What this means for you Summary
Snapshot
- This is a 2-bed/2.0-bath single-family listed at $60k.
Deal economics
- At list price, monthly cash flow is $350 ($4k/yr) — positive.
- The deal already cash-flows at list — no discount required.
- Meets the 1% rule at list price ($940 rent vs $60k).
- Recommended offer: $55k (9.0% below list) — sets the bar for market timing.
Location & tenants
- Location reads: area grade B — affects rentability + tenant quality, not the cash-flow math above.
- Pope County CUD 1 (rural): math 9% / reading 25% proficiency, ranked #492 of 620 in IL (top 79%) — low school quality limits family demand, transient renter base, plan for 1-2y turnover.
- Zoned schools: Pope County Elementary School (math 12% / reading 27%, grade F, #1,054 of 2,056 statewide, top 54%, 319 students, 0% FRL); Pope Co High School (math 5% / reading 5%, grade F, #614 of 693 statewide, top 95%, 167 students, 0% FRL) — zoned schools average 0% FRL vs 48% district-wide (48 pts lower); this property's tenant base skews higher-income than the district average.
- Market conditions: 5 active listings in the ZIP.
Forward outlook
- In year one you build about $3k of equity ($414 loan paydown + $3k appreciation (4.3% local appreciation)).
- Pope County population projected at -21% by 2050 — secular population decline; favor cash flow + early exit over multi-decade hold.
- At projected returns (4.3% appreciation + 3.0% rent growth), your $17k cash investment doubles in ~3 years — after that, you're playing with house money.
Negotiation context
- It's been on market 114 days — a 9% lower offer ($55k) is reasonable based on typical stale-listing flexibility.
- 6 sale attempts since 5y ago; this cycle's ask is 58% above the opening price — seller raised mid-cycle; expect resistance to lowballs.
- Current owner paid $32k; list at $60k implies a 87% gain — meaningful room to come down on a strong offer.
Risks & watch-outs
- Climate carrying-cost: extreme-heat days projected 7→21/yr by 2055 (HVAC capex compounding) — expect insurance premiums to compound above CPI over the hold.
Questions for the listing agent
- It's been on market 114 days. Have you received any prior offers? Is the seller open to a 9% concession, seller financing, or rate buy-down credit?
- Why hasn't it sold? Are there any deal-killer items the seller is aware of (foundation, flood, title, zoning, code violations)?
- Is there a deadline driving the sale (1031 exchange, divorce, estate, relocation)? That informs how much negotiation room exists.
- What's the average days-on-market for RENTAL listings here right now (not sales)? A rising rental-DOM trend means longer vacancies and softer asking-rent achievability than the comps imply.
- What's the recent tenant-quality profile in this submarket — average credit score on applications, eviction rate, late-payment / NSF rate, and stable-employment percentage? A property-management company in the area should have these aggregated.
- How much new for-sale + rental construction is in the pipeline within 1–3 miles? Heavy new supply typically softens prices + rents 12–24 months out; constrained supply supports both.
Investment metrics
- 1% rule
- 1.57% ✓
- Cap rate
- 13.30%
- Cash-on-cash
- 25.01%
- DSCR
- 2.11
- GRM
- 5.3
CMA / ARV
- ARV (on-the-fly)
- $44,880
- Comps found
- 1
Show comp detail 1 sale within ~0.75 mi
| Address | Dist | Beds/Ba | Sqft | Sold | Price | $/sf | Match |
|---|---|---|---|---|---|---|---|
| 991 US Hwy 34 | 0.00mi | 2/2.0 | 1,020 (0%) | 1mo | $44,700 | $44 | 100 |
Match score weights: distance 35% · size 25% · config 20% · recency 20%. Top-matched comps best support the ARV.
Projected returns pro-forma
4.35% appreciation · 3.0% rent growth · sell at horizon
- IRR
- 33.6%
- Equity multiple
- 3.02×
- Total profit
- $33,873
- Equity at exit
- $31,605
- IRR
- 32.5%
- Equity multiple
- 6.03×
- Total profit
- $84,285
- Equity at exit
- $52,704
Cash invested: $16,772 (down + closing). Projections, not guarantees.
Landlord ↔ Tenant lean methodology
- Overall (STATE)
- 43 Moderately Tenant-Leaning
- State Illinois
- 43 Moderately Tenant-Leaning · D+7
- County
- — inherits STATE
- City
- — inherits STATE
ZIP-level market 62947
- Home prices YoY
- 3.2%
- Active inventory
- 5
- Price-to-rent
- 5.3×
Monthly cashflow live
- Estimated rent
- $940 medium interval (Pro) →
- Mortgage (P&I)
- −$314
- Tax from tax record
- −$54 /mo · $645/yr
- Insurance
- −$25
- HOA
- −$0
- Vacancy / Maint / Mgmt
- −$197
- Net cashflow
- $350
Break-even live
Sensitivity live
| Price | -10% $383 | -5% $367 | +0% $350 | +5% $333 | +10% $316 |
|---|---|---|---|---|---|
| Rent | -10% $275 | -5% $312 | +0% $350 | +5% $387 | +10% $424 |
| Rate | -1.0pp $380 | -0.5pp $365 | base $350 | +0.5pp $334 | +1.0pp $318 |
UW: 25.0% down · 7.5% · 30yr · 1.5% tax · 5.0% vac · 8.0% maint · 8.0% mgmt
Financing live
Cash to close
- Down payment
- $14,975
- Closing costs
- $1,797
- Reserves months
- —
- Total cash needed
- —
Loan-product check · same deal, 3 products live
Conventional
25% down · 7.5% · 30yr
- Down + closing
- —
- Monthly P&I
- —
- Monthly cashflow
- —
- DSCR
- —
- Eligible?
- —
Personal DTI + credit; lowest rate.
DSCR
20% down · 8.5% · 30yr
- Down + closing
- —
- Monthly P&I
- —
- Monthly cashflow
- —
- DSCR
- —
- Eligible?
- —
No personal income docs; deal must DSCR.
Hard money
10% down · 12.0% · 12mo
- Down + closing
- —
- Monthly P&I
- —
- Monthly cashflow
- —
- DSCR
- —
- Eligible?
- —
Short-term bridge; refi at stabilization.
Listing history 20 events
-
2026-05-24status Pending
-
2026-05-24status Pending
-
2026-04-30status Pending
-
2026-01-21price $59,900
-
2026-01-21status Active
-
2026-01-06historical
-
2026-01-06historical
-
2026-01-01historical
-
2025-08-09price
-
2025-05-14status Active
-
2025-05-14historical
-
2025-05-04historical Under Contract
-
2025-03-01Active
-
2023-09-06historical
-
2023-09-05historical
-
2023-03-05Active
-
2021-05-28soldstatus $32,000
-
2021-05-28soldstatus $32,000
-
2021-03-10$38,000
-
2021-03-10$38,000
ⓘ Source: listings_history table (triggers on properties + properties_extension) + one-shot
backfill from property_details.listing_events for pre-trigger history.
Tax reassessment forecast IL · Partial reset (capped growth)
- Current annual tax
- $645 · $54/mo
- Projected year-2 tax
- $1,002 · $84/mo
- Expected delta
- +$357/yr (+$30/mo · 55.4%)
ⓘ Screening estimate from a state-policy table — verify with the county assessor before closing.
Climate risk First Street
- Flood 1/10 Low 0% chance over 30 yrs
- Wildfire 4/10 Moderate
- Heat 5/10 Major 7 d/yr ≥106°F today · 21 d/yr by 30 yrs out
- Wind 2/10 Low 3% chance of damaging wind over 30 yrs
- Air quality 2/10 Low 1 unhealthy d/yr today · 2 by 30 yrs out
Nearby sold comps map
Loading sold comps map…
Walkable amenities ~0.75 mi
Loading nearby amenities…
Taxation est. · year 1
- Rental income
- $11,277
- − Mortgage interest
- −$3,355
- − Property taxes
- −$645
- − Insurance
- −$300
- − Repairs & maintenance
- −$902
- − Management
- −$902
- − Depreciation
- −$1,743
- Taxable income
- $3,430
- Est. tax owed @ 24.0%
- −$823
- After-tax cash flow
- $3,372/yr
For passive investors: Depreciation is non-cash, so a rental often shows a tax loss while cash-flowing — sheltering income. Rental losses are passive: they offset passive income freely, and up to $25,000/yr can offset ordinary (W-2) income if you actively participate and your MAGI is under $100k (phasing out to $0 by $150k); unused losses carry forward. On sale, claimed depreciation is recaptured at up to 25%, and gains may owe capital-gains tax (a 1031 exchange can defer both). Figures are a year-1 estimate at your 24.0% rate — not tax advice; consult a CPA.
Schools (NCES district)
- District
- Pope County CUD 1
- NCES district ID
- 1732280
- Math proficiency
- 9% ▼ -9.00%
- Reading proficiency
- 25% ▼ -12.00%
- Median HH income
- $39,354
- Composite
- 14.35/100
- National rank
- #9439
- State rank
- #492 of 620 in IL
Livability — Herod
No livability data for this city. (Only ~50 U.S. cities are tracked.)
Census & demographics
- Population (ZIP)
- 478
Population outlook (Pope County) Hauer SSP2
- Today (2025)
- 4,108 people
- By 2030
- 3,980 · -3.1%
- By 2040
- 3,640 · -11.4%
- By 2050
- 3,259 · -20.7%
- By 2075
- 2,518 · -38.7%
- By 2100
- 2,195 · -46.6%
Race, ethnicity, and origin ACS 2023
- Neighborhood character
- Predominantly White (100%)
- Race & ethnicity
- White 100%
- Common ancestry
- Serbian 8% English 5% Iranian 3%
Political lean MEDSL · Pope
- 2024 margin
- Solid R (+60.1) · D 19.5% · R 79.6%
- 2008→2024 swing
- -37.8pp toward R · 2008: -22.3pp · 2024: -60.1pp
- All cycles
- 2024: R+60.1 2020: R+59.3 2016: R+61.2 2012: R+38.8 2008: R+22.3
Not yet ingested
- Civics
- —
Market trends
- HPI YoY
- ▲ 4.35%
- Current HPI
- 140.8098
- Rent YoY
- —
- Metro
- —
- State GDP YoY
- ▲ 1.59%
- F500 in state
- 60
Industry mix (Fortune 500 HQ in IL)
| Industry | F500 HQs | Revenue |
|---|---|---|
| Insurance | 4 | $201B |
|
||
| Consumer Goods | 4 | $87B |
|
||
| Industrial Machinery | 3 | $64B |
|
||
| Healthcare | 2 | $55B |
|
||
| Retail / Pharmacy | 1 | $148B |
|
||
| Agriculture / Food | 1 | $86B |
|
||
Price history
+57.6% since first listed20 events — show timeline
- 2026-05-24 Pending — MRED as Distributed by MLS Grid
- 2026-05-24 Pending — MRED as Distributed by MLS Grid
- 2026-04-30 Pending — MRED as Distributed by MLS Grid
- 2026-01-21 Price Changed $59,900 MRED as Distributed by MLS Grid
- 2026-01-21 Relisted — MRED as Distributed by MLS Grid
- 2026-01-06 Listing Removed — MRED as Distributed by MLS Grid
- 2026-01-06 Listing Removed — MRED as Distributed by MLS Grid
- 2026-01-01 Listing Removed — MRED as Distributed by MLS Grid
- 2025-08-09 Price Changed — RMLSA as Distributed by MLS Grid
- 2025-05-14 Relisted — RMLSA as Distributed by MLS Grid
- 2025-05-14 Listing Removed — RMLSA as Distributed by MLS Grid
- 2025-05-04 Contingent — RMLSA as Distributed by MLS Grid
- 2025-03-01 Listed — RMLSA as Distributed by MLS Grid
- 2023-09-06 Listing Removed — RMLSA as Distributed by MLS Grid
- 2023-09-05 Listing Removed — MRED as Distributed by MLS Grid
- 2023-03-05 Listed — RMLSA as Distributed by MLS Grid
- 2021-05-28 Sold (MLS) $32,000 MRED as Distributed by MLS Grid
- 2021-05-28 Sold (MLS) $32,000 RMLSA as Distributed by MLS Grid
- 2021-03-10 Listed $38,000 MRED as Distributed by MLS Grid
- 2021-03-10 Listed $38,000 RMLSA as Distributed by MLS Grid
Property tax history
+137.0%/yrLatest (2024): $645 · -3.1% YoY. Source: county tax records.
Cash-flow waterfall
monthlySold comps — $/sqft
last 12 mo · ≤1 miLoading sold comps…