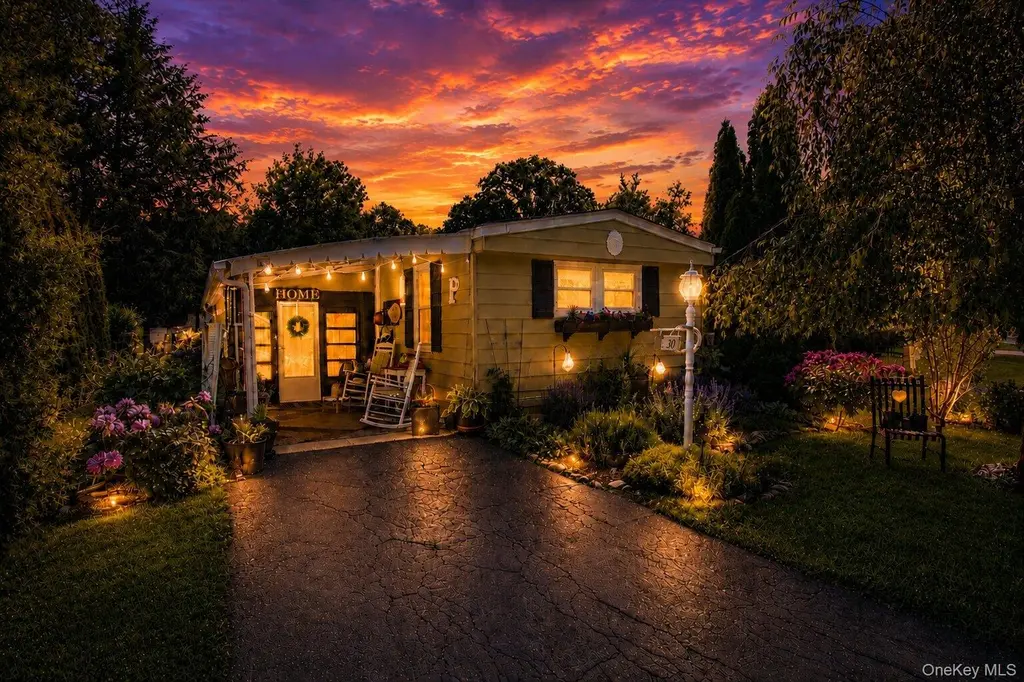
30 Tally-ho Dr · Dover Plains, NY
Flood risk 1/10 · Minimal
- FEMA flood zone
- X (unshaded)
- Chance of flooding over 30 yrs
- 0.0%
- Est. flood insurance / yr
- $507 – $1,088
Fire risk 3/10 · Minor
- Est. fire insurance / yr
- $691 – $1,283
Heat risk 4/10 · Minor
- Hot days now (above 96°F)
- 7 days/yr
- Hot days in 30 yrs
- 17 days/yr
Wind risk 4/10 · Minor
- Chance of severe wind over 30 yrs
- 15.0%
Air-quality risk 2/10 · Minimal
- Unhealthy air days now
- 2 days/yr
- Unhealthy air days in 30 yrs
- 2 days/yr
Risk factors via First Street. Map © Google.
Why this score? — see what drove the A- grade
The composite is a weighted blend of 9 inputs, each scored 0–100. Each bar is that input's sub-score; the figure is the points it added to the 100-point composite (weight × sub-score).
- Cash flow +30.0/30.0
- 1% rule +10.0/10.0
- DSCR +10.0/10.0
- Appreciation +10.0/10.0
- ARV discount +7.5/15.0
- Schools +4.0/10.0
- Condition / age +3.8/5.0
- Livability +3.2/5.0
- Rent growth +2.5/5.0
$130,000
🖨 Deal sheet (PDF) 📄 Offer letter ✓ Due diligence
Listing remarks
Welcome to this beautifully maintained 2-bedroom, 2-bath mobile home in a 55+ community in Dover Plains. Renovated approximately 10 years ago and thoughtfully cared for since, this home offers a warm blend of comfort, character, and practical living space. Inside, you'll find an open-concept layout connecting the living room, dining area, and kitchen, creating an easy flow for everyday living and entertaining. The kitchen features updated cabinetry, ample counter space, and charming farmhouse-inspired details that add personality throughout the home. Natural light fills the living spaces, while the spacious primary bedroom and second bedroom provide flexibility for guests, hobbies, or a hom
Key facts
- Parking
- Community pool
- Built 1989
Property features AI
Finance
- HOA & community: Part of Tally-Ho Estates association; Association amenities include clubhouse and pool; Monthly association fee of $828 covering pool service, sewer, snow removal, trash, and water; Senior community
Exterior
- Parking: Carport (1 space); Driveway
- Utilities: Septic tank; Private trash collection
- Home design: Mobile home
- Construction: Vinyl siding construction
- Exterior features: Vinyl siding; Not waterfront; Private in-ground pool (community pool noted)
Interior
- Kitchen: Dishwasher; Oven; Refrigerator
- Bedrooms: Total rooms: 5
- Flooring: Laminate
- Bathrooms: 2 full bathrooms
- Heating & cooling: Forced air heating (propane); Wall/window air conditioning units
- Interior features: First-floor bedroom; First-floor full bathroom; Ceiling fans; Recessed lighting; Crawl space basement; Basement present
- Laundry & utility: Washer; Dryer
Neighborhood map
What this means for you Summary
Snapshot
- This is a 2-bed/2.0-bath manufactured listed at $130k. Condition is rated good.
Deal economics
- At list price, monthly cash flow is $1k ($15k/yr) — positive.
- The deal already cash-flows at list — no discount required.
- Meets the 1% rule at list price ($4k rent vs $130k).
Location & tenants
- Location reads 63/100 on livability (#818 in NY) — a middle-class / working-renter tenant base. Strengths: crime A, cost of living B; Watch: commute C-, housing D+, amenities F.
- Dover Union Free School District (rural): math 44% / reading 48% proficiency, ranked #433 of 590 in NY (top 73%) — families likely to look elsewhere, expect single-tenant / working-renter base with shorter leases.
- Zoned schools: Dover Elementary School (math 33% / reading 44%, grade F, #1,509 of 2,108 statewide, top 72%, 296 students, 71% FRL); Dover Middle School (math 32% / reading 47%, grade F, #418 of 729 statewide, top 59%, 301 students, 68% FRL); Dover High School (math 92% / reading 74%, grade A, #435 of 1,100 statewide, top 40%, 467 students, 59% FRL) — zoned schools average 66% FRL vs 38% district-wide (29 pts higher); higher-poverty schools than district average — tighter screening recommended.
- Market conditions: 38 active listings in the ZIP; 620 units permitted in Dutchess County in 2024 (242 in 5+ unit buildings).
Forward outlook
- In year one you build about $14k of equity ($899 loan paydown + $13k appreciation (10.0% local appreciation)).
- Dutchess County population projected at -11% by 2050 — secular population decline; favor cash flow + early exit over multi-decade hold.
- At projected returns (10.0% appreciation + 3.0% rent growth), your $36k cash investment doubles in ~2 years — after that, you're playing with house money.
- By year 3, paydown + projected appreciation supports a ~$35k cash-out refi (75% LTV) — recoverable capital for the next deal without selling this one.
Negotiation context
- Only 10 days on market — expect competitive offers; lowballing is unlikely to land.
Risks & watch-outs
- Watch-outs: HOA is 22% of rent.
Questions for the listing agent
- What does the HOA fee cover, when was the last increase, and are there any pending special assessments or reserve-fund shortfalls?
- Is there a deadline driving the sale (1031 exchange, divorce, estate, relocation)? That informs how much negotiation room exists.
- What's the average days-on-market for RENTAL listings here right now (not sales)? A rising rental-DOM trend means longer vacancies and softer asking-rent achievability than the comps imply.
- What's the recent tenant-quality profile in this submarket — average credit score on applications, eviction rate, late-payment / NSF rate, and stable-employment percentage? A property-management company in the area should have these aggregated.
- How much new for-sale + rental construction is in the pipeline within 1–3 miles? Heavy new supply typically softens prices + rents 12–24 months out; constrained supply supports both.
Investment metrics
- 1% rule
- 2.89% ✓
- Cap rate
- 17.77%
- Cash-on-cash
- 40.99%
- DSCR
- 2.82
- GRM
- 2.9
CMA / ARV
- ARV (on-the-fly)
- $41,000
- Comps found
- 1
Show comp detail 1 sale within ~0.75 mi
| Address | Dist | Beds/Ba | Sqft | Sold | Price | $/sf | Match |
|---|---|---|---|---|---|---|---|
| 9 Whatley Ln | 0.71mi | 3/1.0 (+1) | 864 (-14%) | 5mo | $35,000 | $41 | 31 |
Match score weights: distance 35% · size 25% · config 20% · recency 20%. Top-matched comps best support the ARV.
Projected returns pro-forma
10.0% appreciation · 3.0% rent growth · sell at horizon
- IRR
- 56.2%
- Equity multiple
- 5.14×
- Total profit
- $150,566
- Equity at exit
- $117,114
- IRR
- 49.8%
- Equity multiple
- 11.50×
- Total profit
- $382,235
- Equity at exit
- $252,561
Cash invested: $36,400 (down + closing). Projections, not guarantees.
Landlord ↔ Tenant lean methodology
- Overall (STATE)
- 15 Strongly Tenant-Friendly
- State New York
- 15 Strongly Tenant-Friendly · D+10
- County
- — inherits STATE
- City
- — inherits STATE
ZIP-level market 12522
- Home prices YoY
- 17.7%
- Active inventory
- 38
- Price-to-rent
- 2.9×
Monthly cashflow live
- Estimated rent
- $3,759 medium interval (Pro) →
- Mortgage (P&I)
- −$682
- Tax est. 1.5%
- −$162 /mo · $1,950/yr
- Insurance
- −$54
- HOA
- −$828
- Vacancy / Maint / Mgmt
- −$789
- Net cashflow
- $1,243
Break-even live
Sensitivity live
| Price | -10% $1,333 | -5% $1,288 | +0% $1,243 | +5% $1,199 | +10% $1,154 |
|---|---|---|---|---|---|
| Rent | -10% $947 | -5% $1,095 | +0% $1,243 | +5% $1,392 | +10% $1,540 |
| Rate | -1.0pp $1,309 | -0.5pp $1,277 | base $1,243 | +0.5pp $1,210 | +1.0pp $1,176 |
UW: 25.0% down · 7.5% · 30yr · 1.5% tax · 5.0% vac · 8.0% maint · 8.0% mgmt
Financing live
Cash to close
- Down payment
- $32,500
- Closing costs
- $3,900
- Reserves months
- —
- Total cash needed
- —
Loan-product check · same deal, 3 products live
Conventional
25% down · 7.5% · 30yr
- Down + closing
- —
- Monthly P&I
- —
- Monthly cashflow
- —
- DSCR
- —
- Eligible?
- —
Personal DTI + credit; lowest rate.
DSCR
20% down · 8.5% · 30yr
- Down + closing
- —
- Monthly P&I
- —
- Monthly cashflow
- —
- DSCR
- —
- Eligible?
- —
No personal income docs; deal must DSCR.
Hard money
10% down · 12.0% · 12mo
- Down + closing
- —
- Monthly P&I
- —
- Monthly cashflow
- —
- DSCR
- —
- Eligible?
- —
Short-term bridge; refi at stabilization.
HOA detail
- Monthly dues
- $828 · $9,936/yr
Listing history 12 events
-
2026-06-21days on market $130,000 Active 10 DOM
-
2026-06-18days on market $130,000 Active 8 DOM
-
2026-06-17days on market $130,000 Active 7 DOM
-
2026-06-16days on market $130,000 Active 6 DOM
-
2026-06-15days on market $130,000 Active 5 DOM
-
2026-06-13days on market $130,000 Active 3 DOM
-
2026-06-12statusdays on market $130,000 Active 2 DOM
-
2026-06-09days on market $130,000 Coming Soon 5 DOM
-
2026-06-08days on market $130,000 Coming Soon 4 DOM
-
2026-06-07days on market $130,000 Coming Soon 3 DOM
-
2026-06-07remarks 699-char remark
-
2026-06-07$130,000 Coming Soon 2 DOM
ⓘ Source: listings_history table (triggers on properties + properties_extension) + one-shot
backfill from property_details.listing_events for pre-trigger history.
Climate risk First Street
- Flood 1/10 Low FEMA zone X (unshaded) · 0% chance over 30 yrs
- Wildfire 3/10 Moderate
- Heat 4/10 Moderate 7 d/yr ≥96°F today · 17 d/yr by 30 yrs out
- Wind 4/10 Moderate 15% chance of damaging wind over 30 yrs
- Air quality 2/10 Low 2 unhealthy d/yr today · 2 by 30 yrs out
Nearby sold comps map
Loading sold comps map…
Walkable amenities ~0.75 mi
Loading nearby amenities…
Taxation est. · year 1
- Rental income
- $45,112
- − Mortgage interest
- −$7,282
- − Property taxes
- −$1,950
- − Insurance
- −$650
- − Repairs & maintenance
- −$3,609
- − Management
- −$3,609
- − HOA
- −$9,936
- − Depreciation
- −$3,782
- Taxable income
- $14,295
- Est. tax owed @ 24.0%
- −$3,431
- After-tax cash flow
- $11,491/yr
For passive investors: Depreciation is non-cash, so a rental often shows a tax loss while cash-flowing — sheltering income. Rental losses are passive: they offset passive income freely, and up to $25,000/yr can offset ordinary (W-2) income if you actively participate and your MAGI is under $100k (phasing out to $0 by $150k); unused losses carry forward. On sale, claimed depreciation is recaptured at up to 25%, and gains may owe capital-gains tax (a 1031 exchange can defer both). Figures are a year-1 estimate at your 24.0% rate — not tax advice; consult a CPA.
Condition & rehab AI · 13 photos
This well-maintained 2-bedroom, 2-bath mobile home in a 55+ community offers a good condition with updates and a good curb appeal.
Value-add opportunities
- Both Paint exterior — Enhances curb appeal and resale value.
- Both Replace outdoor light fixtures — Improves safety and enhances curb appeal.
Renovation cost estimate screening
Value-add ROI direction
- Both Paint exterior — Enhances curb appeal and resale value. ↑
- Both Replace outdoor light fixtures — Improves safety and enhances curb appeal. ↑
ⓘ Cost ranges are severity-bucket heuristics (US national rule-of-thumb). Get contractor quotes + a written scope before underwriting a rehab budget.
Schools (NCES district)
- District
- Dover Union Free School District
- NCES district ID
- 3609210
- Math proficiency
- 44% ▼ -8.00%
- Reading proficiency
- 48% ▲ 3.00%
- Median HH income
- $58,267
- Composite
- 40.25/100
- National rank
- #3768
- State rank
- #433 of 590 in NY
Livability — Dover Plains
- Score
- 63/100
- State rank
- #818
- US rank
- #15806
Category grades
Schools grade is shown separately in the Schools card above.
Census & demographics
- Population (ZIP)
- 5,074
Population outlook (Dutchess County) Hauer SSP2
- Today (2025)
- 291,768 people
- By 2030
- 287,131 · -1.6%
- By 2040
- 274,881 · -5.8%
- By 2050
- 259,971 · -10.9%
- By 2075
- 235,366 · -19.3%
- By 2100
- 208,786 · -28.4%
Race, ethnicity, and origin ACS 2023
- Neighborhood character
- Predominantly White (76%)
- Race & ethnicity
- White 76% Hispanic / Latino 14% Two or more races 10% Asian 2% Black 1%
- Hispanic origin (detail)
- Puerto Rican 5% Cuban 2%
- Common ancestry
- Lithuanian 3% Scandinavian 2% Slovak 2%
- Foreign-born
- 12% · Canada, China
- Languages at home
- 85% English-only · Spanish 6% Other Indo-European 4% Chinese 2%
Political lean MEDSL · Dutchess
- 2024 margin
- Lean D (+5.4) · D 52.7% · R 47.3%
- 2008→2024 swing
- -3.2pp toward R · 2008: 8.6pp · 2024: 5.4pp
- All cycles
- 2024: D+5.4 2020: D+9.6 2016: R+1.1 2012: D+6.6 2008: D+8.6
Not yet ingested
- Civics
- —
Market trends
- HPI YoY
- ▲ 39.50%
- Current HPI
- 262.8121
- Rent YoY
- —
- Metro
- —
- State GDP YoY
- ▲ 2.60%
- F500 in state
- 92
Industry mix (Fortune 500 HQ in NY)
| Industry | F500 HQs | Revenue |
|---|---|---|
| Financial Services | 10 | $950B |
|
||
| Consumer Goods | 9 | $162B |
|
||
| Insurance | 4 | $225B |
|
||
| Telecommunications | 2 | $144B |
|
||
| Pharmaceuticals | 2 | $112B |
|
||
| Media / Entertainment | 2 | $69B |
|
||
Price history
1 event — show timeline
- 2026-06-04 Coming Soon $130,000 OneKey® MLS as Distributed by MLS Grid
Cash-flow waterfall
monthlySold comps — $/sqft
last 12 mo · ≤1 miLoading sold comps…