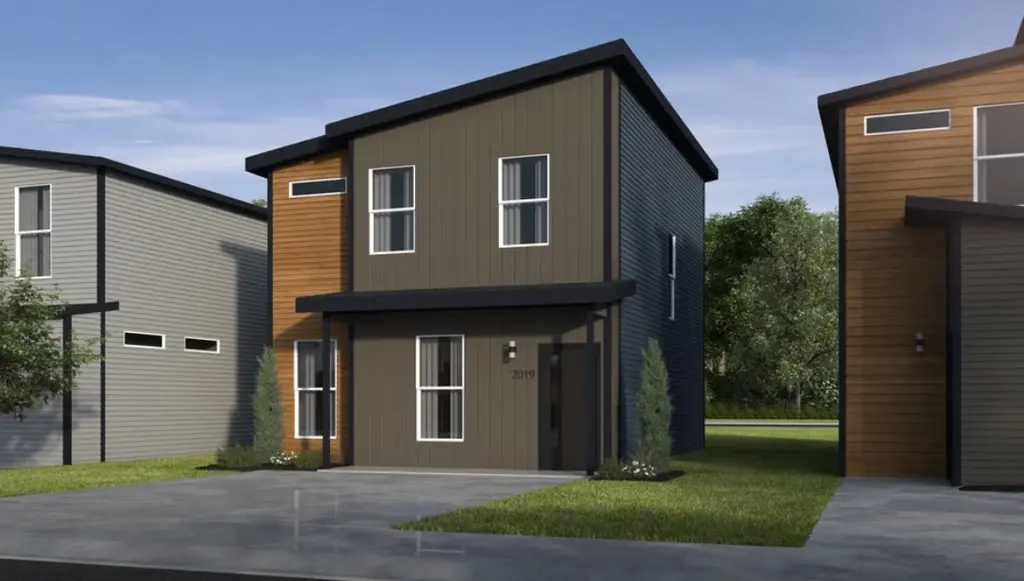
531 Discovery Ave · Centerton, AR
Flood risk 1/10 · Minimal
- FEMA flood zone
- X (unshaded)
- Chance of flooding over 30 yrs
- 0.0%
- Est. flood insurance / yr
- $507 – $1,088
Fire risk 5/10 · Moderate
- Est. fire insurance / yr
- $1,499 – $2,785
Heat risk 5/10 · Moderate
- Hot days now (above 105°F)
- 7 days/yr
- Hot days in 30 yrs
- 18 days/yr
Wind risk 3/10 · Minor
- Chance of severe wind over 30 yrs
- 5.0%
Air-quality risk 1/10 · Minimal
- Unhealthy air days now
- 0 days/yr
- Unhealthy air days in 30 yrs
- 0 days/yr
Risk factors via First Street. Map © Google.
Why this score? — see what drove the D+ grade
The composite is a weighted blend of 9 inputs, each scored 0–100. Each bar is that input's sub-score; the figure is the points it added to the 100-point composite (weight × sub-score).
- ARV discount +10.2/15.0
- Appreciation +10.0/10.0
- Cash flow +6.5/30.0
- Schools +5.2/10.0
- Condition / age +4.0/5.0
- Livability +3.9/5.0
- Rent growth +2.6/5.0
- 1% rule +2.0/10.0
- DSCR +0.8/10.0
$239,726
🖨 Deal sheet (PDF) 📄 Offer letter ✓ Due diligence
Listing remarks MLS
This 3 bedroom, 2 1/2 bath 1250 square foot Bungalow Collection floor plan provides a safe, modern and tranquil place for buyers to call home. LVP flooring and carpet in your home with durability and style. Created with the first-time homebuyer or savvy investors in mind, residents can be situated within walking distance of exciting neighborhood amenities, premier school districts and downtown life in Northwest Arkansas. Taxes are subject to change based on new construction.
Key facts
- Lvp flooring
- 3,484 sq ft lot
- Built 2026
Tags
Neighborhood map
What this means for you Summary
Snapshot
- This is a 3-bed/2.5-bath single-family listed at $240k. Condition is rated good.
Deal economics
- At list price, monthly cash flow is $-403 ($-5k/yr) — negative.
- To cash-flow at today's rent, offer at most $181k (24.3% below list).
- To meet the 1% rule (rent ≥ 1% of price), the offer needs to be $168k (29.8% below list).
- Recommended offer: $168k (29.8% below list) — sets the bar for 1% rule.
- Cap rate 4.3% vs local median 2.9% in Centerton — top-decile yield for the area; either an underpriced asset or a hidden risk that comps aren't pricing in. Stress-test before assuming the spread holds.
Location & tenants
- Location reads 77/100 on livability (#11 in AR, #3,194 nationally) — a middle-class / working-renter tenant base. Strengths: crime A+, employment A+, cost of living A+; Watch: amenities F, commute F.
- Bentonville School District (urban): math 59% / reading 59% proficiency, ranked #3 of 238 in AR (top 1%) — acceptable for families but not a draw, mixed tenant base, ~2y average lease.
- Market conditions: Rents flat; 710 active listings in the ZIP; 40 comparable units currently listed for rent nearby; rentals at typical pace (median 25d on market — plan ~3-4 weeks tenant-placement turnaround); high-income renter base; 4,359 units permitted in Benton County in 2024 (402 in 5+ unit buildings).
- This rent is only 17% of the median local income ($120k/yr) — well below the 30% rent-burden line; pricing power to push rent on renewal without tenant pushback.
Forward outlook
- In year one you build about $26k of equity ($2k loan paydown + $24k appreciation (10.0% local appreciation)).
- Benton County population projected at +56% by 2050 — long-run rental-demand tailwind backs the buy-and-hold thesis.
- By year 2, paydown + projected appreciation supports a ~$41k cash-out refi (75% LTV) — recoverable capital for the next deal without selling this one.
Negotiation context
- It's been on market 21 days — a 2% lower offer ($236k) is reasonable based on typical stale-listing flexibility.
Risks & watch-outs
- Climate carrying-cost: moderate wildfire risk; extreme-heat days projected 7→18/yr by 2055 (HVAC capex compounding) — expect insurance premiums to compound above CPI over the hold.
Questions for the listing agent
- What do current leases actually rent for vs. the listed asking? Can we see a recent rent roll and the last 12 months of T-12 income?
- What does the HOA fee cover, when was the last increase, and are there any pending special assessments or reserve-fund shortfalls?
- Is there a deadline driving the sale (1031 exchange, divorce, estate, relocation)? That informs how much negotiation room exists.
- Schools are B-rated — typically a magnet for longer-tenancy family renters. What's the average tenant stay here, and is there a school-zone premium baked into asking?
- The area grade is low — what's the realistic commute time and amenity access for the typical tenant pool here? Any planned neighborhood developments (good or bad) we should know about?
- What's the average days-on-market for RENTAL listings here right now (not sales)? A rising rental-DOM trend means longer vacancies and softer asking-rent achievability than the comps imply.
- What's the recent tenant-quality profile in this submarket — average credit score on applications, eviction rate, late-payment / NSF rate, and stable-employment percentage? A property-management company in the area should have these aggregated.
- How much new for-sale + rental construction is in the pipeline within 1–3 miles? Heavy new supply typically softens prices + rents 12–24 months out; constrained supply supports both.
Investment metrics
- 1% rule
- 0.70% ✗
- Cap rate
- 4.28%
- Cash-on-cash
- -7.20%
- DSCR
- 0.68
- GRM
- 11.9
CMA / ARV
- ARV (on-the-fly)
- $255,000
- Comps found
- 12
Show comp detail 12 sales within ~0.75 mi
| Address | Dist | Beds/Ba | Sqft | Sold | Price | $/sf | Match |
|---|---|---|---|---|---|---|---|
| 581 Solar St | 0.03mi | 3/2.5 | 1,250 (0%) | 1mo | $246,142 | $197 | 98 |
| 511 Solar St | 0.07mi | 3/2.5 | 1,250 (0%) | 1mo | $246,142 | $197 | 96 |
| 850 States Ave | 0.26mi | 3/2.5 | 1,250 (0%) | 2mo | $254,250 | $203 | 86 |
| 580 Solar St | 0.01mi | 3/2.0 | 1,100 (-12%) | 1mo | $225,426 | $205 | 77 |
| 501 Solar St | 0.08mi | 3/2.0 | 1,100 (-12%) | 0mo | $222,170 | $202 | 74 |
| 570 Solar St | 0.02mi | 2/2.5 (-1) | 1,100 (-12%) | 0mo | $224,085 | $204 | 74 |
| 661 Apollo Ave | 0.10mi | 3/2.0 | 1,100 (-12%) | 1mo | $222,170 | $202 | 72 |
| 651 Apollo Ave | 0.08mi | 2/2.5 (-1) | 1,100 (-12%) | 1mo | $224,085 | $204 | 70 |
| 861 Lakeview Dr | 0.29mi | 3/2.0 | 1,358 (+9%) | 1mo | $315,000 | $232 | 69 |
| 651 St Charles Pl | 0.16mi | 2/2.5 (-1) | 1,100 (-12%) | 2mo | $229,700 | $209 | 65 |
| 910 States Ave | 0.29mi | 3/2.0 | 1,100 (-12%) | 3mo | $257,000 | $234 | 62 |
| 1090 Indiana Ave | 0.39mi | 3/2.0 | 1,100 (-12%) | 2mo | $233,000 | $212 | 58 |
Match score weights: distance 35% · size 25% · config 20% · recency 20%. Top-matched comps best support the ARV.
Projected returns pro-forma
10.0% appreciation · 0.39% rent growth · sell at horizon
- IRR
- 18.5%
- Equity multiple
- 2.50×
- Total profit
- $100,689
- Equity at exit
- $215,964
- IRR
- 16.7%
- Equity multiple
- 5.60×
- Total profit
- $308,976
- Equity at exit
- $465,735
Cash invested: $67,123 (down + closing). Projections, not guarantees.
Landlord ↔ Tenant lean methodology
- Overall (STATE)
- 92 Strongly Landlord-Friendly
- State Arkansas
- 92 Strongly Landlord-Friendly · R+14
- County
- — inherits STATE
- City
- — inherits STATE
ZIP-level market 72713
- Home prices YoY
- 3.5%
- Rents YoY
- 0.4%
- Active inventory
- 710
- Price-to-rent
- 11.9×
Monthly cashflow live
- Estimated rent
- $1,682 high interval (Pro) →
- Mortgage (P&I)
- −$1,257
- Tax est. 1.5%
- −$300 /mo · $3,596/yr
- Insurance
- −$100
- HOA
- −$75
- Vacancy / Maint / Mgmt
- −$353
- Net cashflow
- $-403
Break-even live
Sensitivity live
| Price | -10% $-237 | -5% $-320 | +0% $-403 | +5% $-485 | +10% $-568 |
|---|---|---|---|---|---|
| Rent | -10% $-535 | -5% $-469 | +0% $-403 | +5% $-336 | +10% $-270 |
| Rate | -1.0pp $-282 | -0.5pp $-342 | base $-403 | +0.5pp $-465 | +1.0pp $-528 |
UW: 25.0% down · 7.5% · 30yr · 1.5% tax · 5.0% vac · 8.0% maint · 8.0% mgmt
Financing live
Cash to close
- Down payment
- $59,932
- Closing costs
- $7,192
- Reserves months
- —
- Total cash needed
- —
Loan-product check · same deal, 3 products live
Conventional
25% down · 7.5% · 30yr
- Down + closing
- —
- Monthly P&I
- —
- Monthly cashflow
- —
- DSCR
- —
- Eligible?
- —
Personal DTI + credit; lowest rate.
DSCR
20% down · 8.5% · 30yr
- Down + closing
- —
- Monthly P&I
- —
- Monthly cashflow
- —
- DSCR
- —
- Eligible?
- —
No personal income docs; deal must DSCR.
Hard money
10% down · 12.0% · 12mo
- Down + closing
- —
- Monthly P&I
- —
- Monthly cashflow
- —
- DSCR
- —
- Eligible?
- —
Short-term bridge; refi at stabilization.
Rent comps 40 comps
| Address | Beds | Baths | Sqft | Rent | $/sqft | DOM | Units | Dist |
|---|---|---|---|---|---|---|---|---|
| 820 Boardwalk Ave Bentonville, AR | 3.0 | 2.0 | 1100 | $1,450 | $1.32 | 25d | 1 | 0.17mi |
| 830 Ventnor Ave Bentonville, AR | 2.0 | 2.5 | 1100 | $1,350 | $1.23 | 23d | 1 | 0.18mi |
| 840 Boardwalk Ave Bentonville, AR | 2.0 | 2.5 | 1100 | $1,465 | $1.33 | 25d | 1 | 0.18mi |
| 831 Ventnor Ave Bentonville, AR | 3.0 | 2.0 | 1100 | $1,525 | $1.39 | 25d | 1 | 0.18mi |
| 860 Ventnor Ave Bentonville, AR | 2.0 | 2.5 | 1100 | $1,350 | $1.23 | 25d | 1 | 0.20mi |
| 861 Ventnor Ave Bentonville, AR | 2.0 | 2.5 | 1100 | $1,350 | $1.23 | 25d | 1 | 0.20mi |
| 881 Ventnor Ave Centerton, AR | 3.0 | 2.5 | 1250 | $1,550 | $1.24 | 25d | 1 | 0.22mi |
| 841 Tennessee Ave Bentonville, AR | 2.0 | 2.5 | 1250 | $1,640 | $1.31 | 25d | 1 | 0.23mi |
| 830 Massachusetts Ave Bentonville, AR | 2.0 | 2.0 | 1250 | $1,718 | $1.37 | 25d | 1 | 0.24mi |
| 381 Holly St Centerton, AR | 3.0 | 2.0 | 1801 | $1,845 | $1.02 | 25d | 1 | 0.24mi |
| 890 Tennessee Ave Bentonville, AR | 3.0 | 2.5 | 1250 | $1,595 | $1.28 | 23d | 1 | 0.25mi |
| 831 Massachusetts Ave Bentonville, AR | 2.0 | 2.0 | 1250 | $1,718 | $1.37 | 25d | 1 | 0.25mi |
| 840 States Ave Bentonville, AR | 3.0 | 2.0 | 1100 | $1,624 | $1.48 | 25d | 1 | 0.26mi |
| 860 States Ave Bentonville, AR | 2.0 | 2.0 | 1250 | $1,718 | $1.37 | 25d | 1 | 0.28mi |
| 960 Ventnor Ave Centerton, AR | 3.0 | 2.5 | 1250 | $1,750 | $1.40 | 25d | 1 | 0.28mi |
| 891 States Ave Bentonville, AR | 2.0 | 2.0 | 1250 | $1,718 | $1.37 | 25d | 1 | 0.30mi |
| 821 Arctic Ave Bentonville, AR | 2.0 | 2.0 | 1250 | $1,726 | $1.38 | 25d | 1 | 0.32mi |
| 931 States Ave Bentonville, AR | 2.0 | 2.0 | 1250 | $1,718 | $1.37 | 25d | 1 | 0.32mi |
| 1031 Kentucky Ave Bentonville, AR | 3.0 | 2.0 | 1100 | $1,700 | $1.55 | 25d | 1 | 0.33mi |
| 1040 Indiana Ave Bentonville, AR | 3.0 | 2.0 | 1100 | $1,624 | $1.48 | 25d | 1 | 0.35mi |
| 1020 States Ave Bentonville, AR | 3.0 | 2.0 | 1100 | $1,624 | $1.48 | 25d | 1 | 0.35mi |
| 1071 Ventnor Ave Centerton, AR | 3.0 | 2.0 | 1100 | $1,400 | $1.27 | 25d | 1 | 0.35mi |
| 1050 Indiana Ave Bentonville, AR | 3.0 | 2.0 | 1100 | $1,624 | $1.48 | 25d | 1 | 0.35mi |
| 1061 Kentucky Ave Bentonville, AR | 3.0 | 2.5 | 1250 | $1,550 | $1.24 | 25d | 1 | 0.36mi |
| 1021 States Ave Bentonville, AR | 2.0 | 2.5 | 1250 | $1,850 | $1.48 | 16d | 1 | 0.36mi |
| 1061 Indiana Ave Bentonville, AR | 3.0 | 2.0 | 1100 | $1,624 | $1.48 | 25d | 1 | 0.37mi |
| 1080 Indiana Ave Bentonville, AR | 3.0 | 2.0 | 1100 | $1,624 | $1.48 | 25d | 1 | 0.38mi |
| 1060 States Ave Bentonville, AR | 3.0 | 2.0 | 1100 | $1,624 | $1.48 | 25d | 1 | 0.38mi |
| 1091 Indiana Ave Bentonville, AR | 2.0 | 2.0 | 1250 | $1,718 | $1.37 | 25d | 1 | 0.39mi |
| 811 Meadowlands Dr Centerton, AR | 3.0 | 2.0 | 1474 | $1,225 | $0.83 | 25d | 1 | 0.40mi |
| 1090 States Ave Bentonville, AR | 2.0 | 2.0 | 1250 | $1,718 | $1.37 | 25d | 1 | 0.40mi |
| 501 E Centerton Blvd Centerton, AR | 1.0–2.0 | 1.0–2.0 | 835 | $1,292 | $1.55 | 16d | 25 | 0.45mi |
| 441 Peach Ave Centerton, AR | 3.0 | 2.0 | 1524 | $1,900 | $1.25 | 16d | 1 | 0.54mi |
| 410 Coconut Ln Centerton, AR | 3.0 | 2.0 | 1393 | $1,850 | $1.33 | 25d | 1 | 0.56mi |
| 156 Copper Oaks Dr Centerton, AR | 2.0 | 2.0 | 1140 | $1,550 | $1.36 | 25d | 1 | 0.60mi |
| 848 Oakwood Ct Unit 848 Centerton, AR | 3.0 | 2.0 | 1544 | $1,550 | $1.00 | 25d | 1 | 0.61mi |
| 621-623 Cosmos St Centerton, AR | 3.0 | 2.0 | 1475 | $1,795 | $1.22 | 15d | 1 | 0.71mi |
| 1015 Oakwood Ln Centerton, AR | 3.0 | 2.5 | 1600 | $1,450 | $0.91 | 25d | 1 | 0.72mi |
| 130 cedar St Centerton, AR | 1.0–2.0 | 1.0–1.5 | 897 | $1,395 | $1.55 | 15d | 12 | 0.76mi |
| 261 Copper Oaks Dr Centerton, AR | 3.0 | 2.0 | 1336 | $1,425 | $1.07 | 25d | 1 | 0.78mi |
HOA detail
- Monthly dues
- $75 · $900/yr
Listing history 2 events
-
2026-05-15status Pending 479-char remark
Show marketing remark (479 chars)
This 3 bedroom, 2 1/2 bath 1250 square foot Bungalow Collection floor plan provides a safe, modern and tranquil place for buyers to call home. LVP flooring and carpet in your home with durability and style. Created with the first-time homebuyer or savvy investors in mind, residents can be situated within walking distance of exciting neighborhood amenities, premier school districts and downtown life in Northwest Arkansas. Taxes are subject to change based on new construction.
-
2026-04-24$239,726 Active 479-char remark
Show marketing remark (479 chars)
This 3 bedroom, 2 1/2 bath 1250 square foot Bungalow Collection floor plan provides a safe, modern and tranquil place for buyers to call home. LVP flooring and carpet in your home with durability and style. Created with the first-time homebuyer or savvy investors in mind, residents can be situated within walking distance of exciting neighborhood amenities, premier school districts and downtown life in Northwest Arkansas. Taxes are subject to change based on new construction.
ⓘ Source: listings_history table (triggers on properties + properties_extension) + one-shot
backfill from property_details.listing_events for pre-trigger history.
Climate risk First Street
- Flood 1/10 Low FEMA zone X (unshaded) · 0% chance over 30 yrs
- Wildfire 5/10 Major
- Heat 5/10 Major 7 d/yr ≥105°F today · 18 d/yr by 30 yrs out
- Wind 3/10 Moderate 5% chance of damaging wind over 30 yrs
- Air quality 1/10 Low 0 unhealthy d/yr today · 0 by 30 yrs out
Nearby sold comps map
Loading sold comps map…
Walkable amenities ~0.75 mi
Loading nearby amenities…
Taxation est. · year 1
- Rental income
- $20,190
- − Mortgage interest
- −$13,428
- − Property taxes
- −$3,596
- − Insurance
- −$1,199
- − Repairs & maintenance
- −$1,615
- − Management
- −$1,615
- − HOA
- −$900
- − Depreciation
- −$6,974
- Taxable loss
- −$9,137
- Est. tax savings @ 24.0%
- +$2,193
- After-tax cash flow
- $-2,637/yr
For passive investors: Depreciation is non-cash, so a rental often shows a tax loss while cash-flowing — sheltering income. Rental losses are passive: they offset passive income freely, and up to $25,000/yr can offset ordinary (W-2) income if you actively participate and your MAGI is under $100k (phasing out to $0 by $150k); unused losses carry forward. On sale, claimed depreciation is recaptured at up to 25%, and gains may owe capital-gains tax (a 1031 exchange can defer both). Figures are a year-1 estimate at your 24.0% rate — not tax advice; consult a CPA.
Condition & rehab AI · 12 photos
This 3-bedroom, 2.5-bath home is in excellent condition with modern finishes and a good location. It's move-in ready and has the potential for further value increases with minor updates.
Value-add opportunities
- Both Painting the exterior and interior walls — Fresh paint can enhance curb appeal and interior aesthetics.
- Both Adding smart home features — Smart home features can increase both resale and rental value.
- Resale Upgrading the kitchen appliances — Modern appliances can attract more buyers and renters.
- Rental Adding a smart thermostat — Smart thermostats can help reduce energy costs and attract eco-conscious renters.
Renovation cost estimate screening
Value-add ROI direction
- Both Painting the exterior and interior walls — Fresh paint can enhance curb appeal and interior aesthetics. ↑
- Both Adding smart home features — Smart home features can increase both resale and rental value. ↑
- Resale Upgrading the kitchen appliances — Modern appliances can attract more buyers and renters. ↑
- Rental Adding a smart thermostat — Smart thermostats can help reduce energy costs and attract eco-conscious renters. ↑
ⓘ Cost ranges are severity-bucket heuristics (US national rule-of-thumb). Get contractor quotes + a written scope before underwriting a rehab budget.
Schools (NCES district)
- District
- Bentonville School District
- NCES district ID
- 0503060
- Math proficiency
- 59% ▼ -8.00%
- Reading proficiency
- 59% ▼ -6.00%
- Median HH income
- $66,721
- Composite
- 51.85/100
- National rank
- #1661
- State rank
- #3 of 238 in AR
Livability — Centerton
- Score
- 77/100
- State rank
- #11
- US rank
- #3194
Category grades
Schools grade is shown separately in the Schools card above.
Census & demographics
- Census place
- Centerton, AR
- County
- Benton County · 259,241 people
- City population
- 19,701
- Metro
- Fayetteville-Springdale-Rogers, AR
- Population (ZIP)
- 28,999
- Household income
- $119,853
- Rent vs Own
- Severe rent burden
- 508.0
Population outlook (Benton County) Hauer SSP2
- Today (2025)
- 318,683 people
- By 2030
- 353,481 · +10.9%
- By 2040
- 425,280 · +33.4%
- By 2050
- 497,239 · +56.0%
- By 2075
- 662,114 · +107.8%
- By 2100
- 776,431 · +143.6%
Race, ethnicity, and origin ACS 2023
- Neighborhood character
- Diverse neighborhood (Simpson 0.66)
- Race & ethnicity
- White 54% Asian 20% Two or more races 16% Hispanic / Latino 11% Black 3%
- Hispanic origin (detail)
- Mexican 8%
- Common ancestry
- Italian 2% Slovak 2% Romanian 1%
- Foreign-born
- 22% · Canada, China, Vietnam
- Languages at home
- 79% English-only · Other Asian/Pacific 8% Spanish 6% Other Indo-European 5%
Political lean MEDSL · Benton
- 2024 margin
- Strong R (+27.0) · D 35.2% · R 62.1% · Other 2.7%
- 2008→2024 swing
- +9.6pp toward D · 2008: -36.5pp · 2024: -27.0pp
- All cycles
- 2024: R+27.0 2020: R+26.4 2016: R+34.9 2012: R+40.4 2008: R+36.5
Not yet ingested
- Civics
- —
Market trends
- HPI YoY
- ▲ 10.77%
- Current HPI
- 319.3081
- Rent YoY
- ▲ 0.39%
- Metro
- Fayetteville-Springdale-Rogers, AR
- State GDP YoY
- ▲ 3.80%
- F500 in state
- 10
Industry mix (Fortune 500 HQ in AR)
| Industry | F500 HQs | Revenue |
|---|---|---|
| Retail | 1 | $681B |
|
||
| Food / Agriculture | 1 | $53B |
|
||
| Retail / Energy | 1 | $22B |
|
||
| Transportation / Logistics | 1 | $12B |
|
||
| Energy | 1 | $4B |
|
||
Price history
2 events — show timeline
- 2026-05-15 Pending — NWARMLS
- 2026-04-24 Listed $239,726 NWARMLS
Cash-flow waterfall
monthlySold comps — $/sqft
last 12 mo · ≤1 miLoading sold comps…