 Multi-family
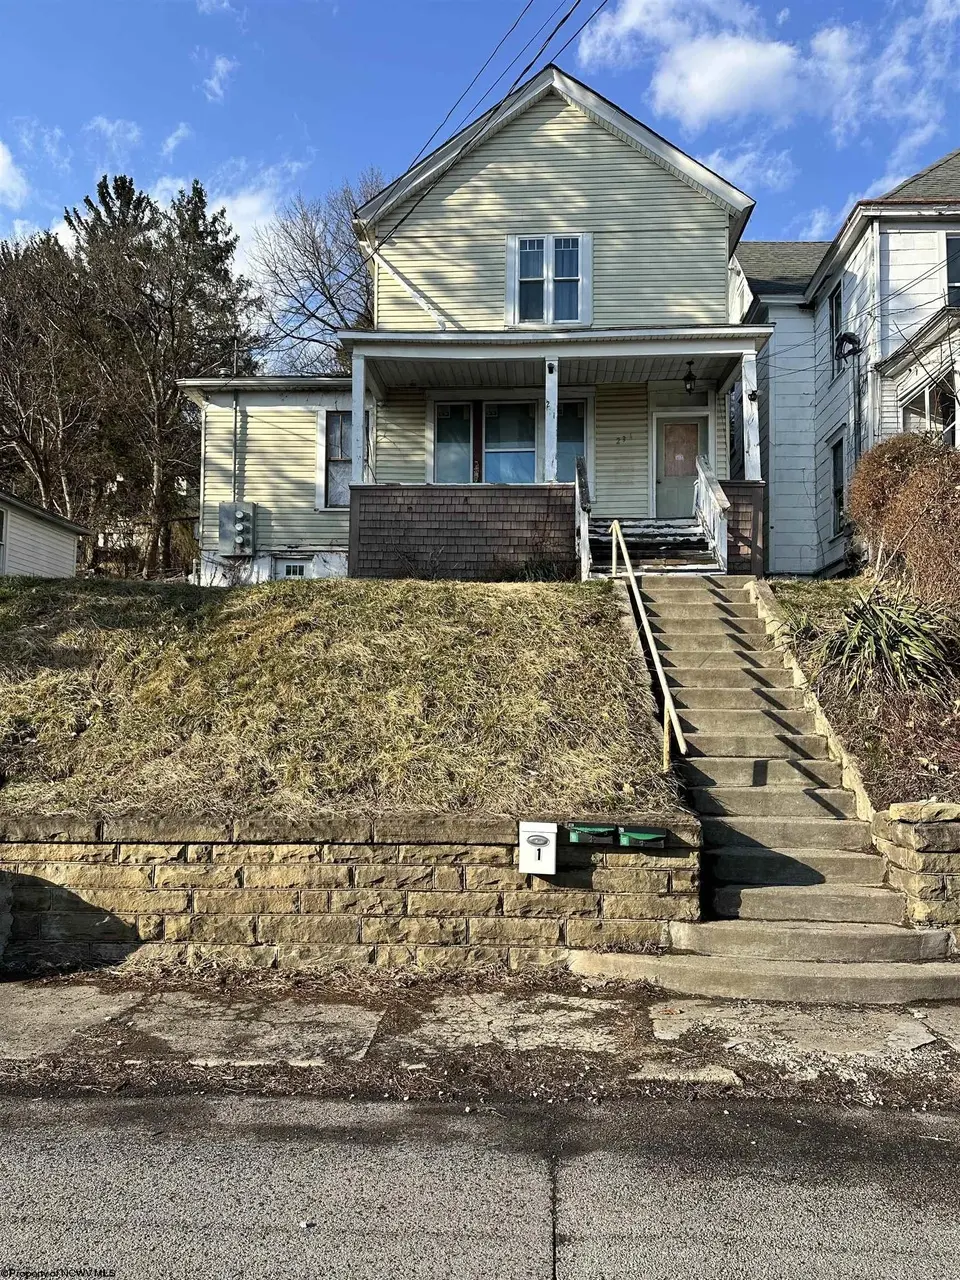
231 Watson · Fairmont, WV
Flood risk 1/10 · Minimal
- FEMA flood zone
- X (unshaded)
- Chance of flooding over 30 yrs
- 0.0%
- Est. flood insurance / yr
- $507 – $1,088
Fire risk 1/10 · Minimal
- Est. fire insurance / yr
- $787 – $1,461
Heat risk 4/10 · Minor
- Hot days now (above 99°F)
- 7 days/yr
- Hot days in 30 yrs
- 19 days/yr
Wind risk 1/10 · Minimal
- Chance of severe wind over 30 yrs
- —
Air-quality risk 2/10 · Minimal
- Unhealthy air days now
- 0 days/yr
- Unhealthy air days in 30 yrs
- 1 days/yr
Risk factors via First Street. Map © Google.
Why this score? — see what drove the B- grade
The composite is a weighted blend of 9 inputs, each scored 0–100. Each bar is that input's sub-score; the figure is the points it added to the 100-point composite (weight × sub-score).
- Cash flow +30.0/30.0
- 1% rule +10.0/10.0
- DSCR +10.0/10.0
- ARV discount +7.5/15.0
- Livability +3.5/5.0
- Schools +3.1/10.0
- Rent growth +2.5/5.0
- Condition / age +2.5/5.0
- Appreciation +0.0/10.0
$130,000
🖨 Deal sheet 📄 Offer letter ✓ Due diligence
Multi-family units
County records classify this as Multi-Family (2-4 Unit). Listing-text estimate: 1 unit. estimate disagrees with records
Listing remarks
Fully rented multi-unit investment opportunity with separate utilities! This income-producing property offers immediate cash flow and strong rental history. Each unit features its own utilities, providing convenience for tenants and lower overhead for the owner. The property offers classic charm with a welcoming front porch and a functional layout that appeals to renters. Situated in a convenient location close to local amenities, this is a great addition to any investment portfolio—whether you’re a seasoned investor or just getting started. Don’t miss your chance to own a turnkey, fully occupied property with built-in income from day one!
Key facts
- Separate utilities
- Functional layout
- Convenient location
Tags
Property features AI
Exterior
- Parking: On-street parking
- Security: Smoke detectors
- Utilities: Public water; Public sewer
- Home design: Multi-family residential income property; 2-story building; 2-4 family subtype; Irregular lot shape; Neighborhood residential zoning
- Construction: Frame construction with vinyl siding; Shingle roof
- Exterior features: Front porch; Sloped lot
Interior
- Kitchen: Range; Refrigerator
- Bedrooms: Two 1-bedroom units; One 2-bedroom unit
- Flooring: Tile; Wood
- Bathrooms: Three full bathrooms (total)
- Heating & cooling: Forced air heating (natural gas); Window air conditioning units
- Interior features: Refrigerator and range included; Tile and wood flooring; Crawl space basement
Neighborhood map
What this means for you Summary
Snapshot
- This is a 3-bed/3.0-bath multifamily listed at $130k.
Deal economics
- At list price, monthly cash flow is $769 ($9k/yr) — positive.
- The deal already cash-flows at list — no discount required.
- Meets the 1% rule at list price ($2k rent vs $130k).
- Recommended offer: $122k (6.0% below list) — sets the bar for market timing.
- Cap rate 13.4% vs local median 4.3% in Fairmont — top-decile yield for the area; either an underpriced asset or a hidden risk that comps aren't pricing in. Stress-test before assuming the spread holds.
Location & tenants
- Location reads 70/100 on livability (#64 in WV) — a middle-class / working-renter tenant base. Strengths: cost of living A+, housing A+, health & safety A+; Watch: crime D, amenities F, commute F.
- Marion County Schools (town): math 30% / reading 43% proficiency, ranked #11 of 55 in WV (top 20%) — families likely to look elsewhere, expect single-tenant / working-renter base with shorter leases.
- Zoned schools: Jayenne Elementary School (math 47% / reading 47%, grade D-, #63 of 377 statewide, top 18%, 300 students, 0% FRL); West Fairmont Middle School (math 27% / reading 41%, grade F, #36 of 109 statewide, top 35%, 629 students, 0% FRL); East Fairmont High School (math 27% / reading 52%, grade F, #21 of 110 statewide, top 26%, 689 students, 0% FRL) — zoned schools average 0% FRL vs 46% district-wide (46 pts lower); this property's tenant base skews higher-income than the district average.
- Market conditions: 151 active listings in the ZIP; 3 units permitted in Marion County in 2024 (0 in 5+ unit buildings).
Forward outlook
- Local home prices are declining (-3.0%/yr); year-one equity from $899 of loan paydown is wiped out by about $4k of value loss. Plan a longer hold.
- At projected returns (-3.0% appreciation + 3.0% rent growth), your $36k cash investment doubles in ~5 years — after that, you're playing with house money.
Negotiation context
- It's been on market 84 days — a 6% lower offer ($122k) is reasonable based on typical stale-listing flexibility.
- 2 sale attempts; this cycle's ask has dropped $29k (18%) from the opening price — seller is motivated, your offer sets the floor, not the list.
- Current owner paid $15k; list at $130k implies a 767% gain — meaningful room to come down on a strong offer.
Risks & watch-outs
- Watch-outs: built in 1908 — expect roof / HVAC / electrical / plumbing capex.
Questions for the listing agent
- It's been on market 84 days. Have you received any prior offers? Is the seller open to a 6% concession, seller financing, or rate buy-down credit?
- Built in 1908 — when were the roof, HVAC, electrical panel, plumbing, and water heater last replaced?
- Why hasn't it sold? Are there any deal-killer items the seller is aware of (foundation, flood, title, zoning, code violations)?
- Is there a deadline driving the sale (1031 exchange, divorce, estate, relocation)? That informs how much negotiation room exists.
- Schools are B-rated — typically a magnet for longer-tenancy family renters. What's the average tenant stay here, and is there a school-zone premium baked into asking?
- Crime grade is D in this area — have there been break-ins, vandalism, or insurance claims at this property in the last 3 years? What carrier currently insures it and at what premium?
- What's the average days-on-market for RENTAL listings here right now (not sales)? A rising rental-DOM trend means longer vacancies and softer asking-rent achievability than the comps imply.
- What's the recent tenant-quality profile in this submarket — average credit score on applications, eviction rate, late-payment / NSF rate, and stable-employment percentage? A property-management company in the area should have these aggregated.
- How much new apartment / multifamily construction is in the pipeline within 1–3 miles? Heavy new supply (>2% of stock underway) typically softens rents 12–24 months out; light construction supports rent growth.
Investment metrics
- 1% rule
- 1.62% ✓
- Cap rate
- 13.39%
- Cash-on-cash
- 25.35%
- DSCR
- 2.13
- GRM
- 5.2
CMA / ARV
No comps found within radius.
Projected returns pro-forma
-3.0% appreciation · 3.0% rent growth · sell at horizon
- IRR
- 18.9%
- Equity multiple
- 1.77×
- Total profit
- $27,935
- Equity at exit
- $19,383
- IRR
- 27.3%
- Equity multiple
- 3.40×
- Total profit
- $87,495
- Equity at exit
- $11,240
Cash invested: $36,400 (down + closing). Projections, not guarantees.
Landlord ↔ Tenant lean methodology
- Overall (STATE)
- 83 Strongly Landlord-Friendly
- State West Virginia
- 83 Strongly Landlord-Friendly · R+22
- County
- — inherits STATE
- City
- — inherits STATE
ZIP-level market 26554
- Home prices YoY
- -11.3%
- Active inventory
- 151
- Price-to-rent
- 10.3×
Monthly cashflow live
- Estimated rent
- $2,100 medium interval (Pro) →
- Mortgage (P&I)
- −$682
- Tax from tax record
- −$154 /mo · $1,850/yr
- Insurance
- −$54
- HOA
- −$0
- Vacancy / Maint / Mgmt
- −$441
- Net cashflow
- $769
Break-even live
2-unit breakdown (identical units grouped — click to expand)
| Units | Beds | Baths | Est. rent |
|---|---|---|---|
| 2× units | 2 | 1.5 | $2,100 |
| #1 | 2 | 1.5 | $1,050 |
| #2 | 2 | 1.5 | $1,050 |
| Total (2 units) | $2,100 | ||
UW: 25.0% down · 7.5% · 30yr · 1.5% tax · 5.0% vac · 8.0% maint · 8.0% mgmt
Financing live
Cash to close
- Down payment
- $32,500
- Closing costs
- $3,900
- Reserves months
- —
- Total cash needed
- —
Loan-product check · same deal, 3 products live
Conventional
25% down · 7.5% · 30yr
- Down + closing
- —
- Monthly P&I
- —
- Monthly cashflow
- —
- DSCR
- —
- Eligible?
- —
Personal DTI + credit; lowest rate.
DSCR
20% down · 8.5% · 30yr
- Down + closing
- —
- Monthly P&I
- —
- Monthly cashflow
- —
- DSCR
- —
- Eligible?
- —
No personal income docs; deal must DSCR.
Hard money
10% down · 12.0% · 12mo
- Down + closing
- —
- Monthly P&I
- —
- Monthly cashflow
- —
- DSCR
- —
- Eligible?
- —
Short-term bridge; refi at stabilization.
Listing history 20 events
-
2026-06-19days on market $130,000 Active 84 DOM
-
2026-06-18days on market $130,000 Active 83 DOM
-
2026-06-17days on market $130,000 Active 82 DOM
-
2026-06-16days on market $130,000 Active 81 DOM
-
2026-06-15days on market $130,000 Active 80 DOM
-
2026-06-14days on market $130,000 Active 78 DOM
-
2026-06-13pricedays on market $130,000 Active 77 DOM
-
2026-06-10days on market $159,000 Active 75 DOM
-
2026-06-09days on market $159,000 Active 74 DOM
-
2026-06-08days on market $159,000 Active 73 DOM
-
2026-06-07days on market $159,000 Active 72 DOM
-
2026-06-02days on market $159,000 Active 67 DOM
-
2026-06-01days on market $159,000 Active 66 DOM
-
2026-05-31days on market $159,000 Active 65 DOM
-
2026-05-30days on market $159,000 Active 64 DOM
-
2026-05-07status Active
-
2026-03-31historical Active Under Contract
-
2026-03-28$159,000 Active
-
2006-09-18soldstatus $15,000
-
2000-10-12soldstatus $25,000
ⓘ Source: listings_history table (triggers on properties + properties_extension) + one-shot
backfill from property_details.listing_events for pre-trigger history.
Tax reassessment forecast WV · Resets to sale price
- Current annual tax
- $1,850 · $154/mo
- Projected year-2 tax
- $1,850 · $154/mo
- Expected delta
- $0/yr ($0/mo · 0.0%)
ⓘ Screening estimate from a state-policy table — verify with the county assessor before closing.
Climate risk First Street
- Flood 1/10 Low FEMA zone X (unshaded) · 0% chance over 30 yrs
- Wildfire 1/10 Low
- Heat 4/10 Moderate 7 d/yr ≥99°F today · 19 d/yr by 30 yrs out
- Wind 1/10 Low
- Air quality 2/10 Low 0 unhealthy d/yr today · 1 by 30 yrs out
Nearby sold comps map
Loading sold comps map…
Walkable amenities ~0.75 mi
Loading nearby amenities…
Taxation est. · year 1
- Rental income
- $25,200
- − Mortgage interest
- −$7,282
- − Property taxes
- −$1,850
- − Insurance
- −$650
- − Repairs & maintenance
- −$2,016
- − Management
- −$2,016
- − Depreciation
- −$3,782
- Taxable income
- $7,604
- Est. tax owed @ 24.0%
- −$1,825
- After-tax cash flow
- $7,402/yr
For passive investors: Depreciation is non-cash, so a rental often shows a tax loss while cash-flowing — sheltering income. Rental losses are passive: they offset passive income freely, and up to $25,000/yr can offset ordinary (W-2) income if you actively participate and your MAGI is under $100k (phasing out to $0 by $150k); unused losses carry forward. On sale, claimed depreciation is recaptured at up to 25%, and gains may owe capital-gains tax (a 1031 exchange can defer both). Figures are a year-1 estimate at your 24.0% rate — not tax advice; consult a CPA.
Schools (NCES district)
- District
- Marion County Schools
- NCES district ID
- 5400720
- Math proficiency
- 30% ▼ -14.00%
- Reading proficiency
- 43% ▼ -8.00%
- Median HH income
- $42,195
- Composite
- 30.8/100
- National rank
- #6145
- State rank
- #11 of 55 in WV
Livability — Fairmont
- Score
- 70/100
- State rank
- #64
- US rank
- #8054
Category grades
Schools grade is shown separately in the Schools card above.
Census & demographics
- Census place
- Fairmont, WV
- Population (ZIP)
- 42,116
Population outlook (Marion County) Hauer SSP2
- Today (2025)
- 56,923 people
- By 2030
- 56,850 · -0.1%
- By 2040
- 56,469 · -0.8%
- By 2050
- 56,027 · -1.6%
- By 2075
- 55,509 · -2.5%
- By 2100
- 51,082 · -10.3%
Race, ethnicity, and origin ACS 2023
- Neighborhood character
- Predominantly White (90%)
- Race & ethnicity
- White 90% Two or more races 5% Black 3% Hispanic / Latino 2%
- Common ancestry
- Romanian 3% Slovak 2% Iranian 2%
- Foreign-born
- 1%
- Languages at home
- 98% English-only · Spanish 1%
Political lean MEDSL · Marion
- 2024 margin
- Solid R (+31.2) · D 33.2% · R 64.5% · Other 2.3%
- 2008→2024 swing
- -31.7pp toward R · 2008: 0.5pp · 2024: -31.2pp
- All cycles
- 2024: R+31.2 2020: R+28.7 2016: R+33.5 2012: R+14.4 2008: D+0.5
Not yet ingested
- Civics
- —
Market trends
- HPI YoY
- ▼ -30.86%
- Current HPI
- 240.9967
- Rent YoY
- —
- Metro
- —
- State GDP YoY
- —
- F500 in state
- 0
Price history
+536.0% since first listed5 events — show timeline
- 2026-05-07 Relisted — NCWVREIN
- 2026-03-31 Contingent — NCWVREIN
- 2026-03-28 Listed $159,000 NCWVREIN
- 2006-09-18 Sold (Public Records) $15,000 Public Records
- 2000-10-12 Sold (Public Records) $25,000 Public Records
Property tax history
+2.3%/yrLatest (2025): $1,850 · +4.5% YoY. Source: county tax records.
Cash-flow waterfall
monthlySold comps — $/sqft
last 12 mo · ≤1 miLoading sold comps…