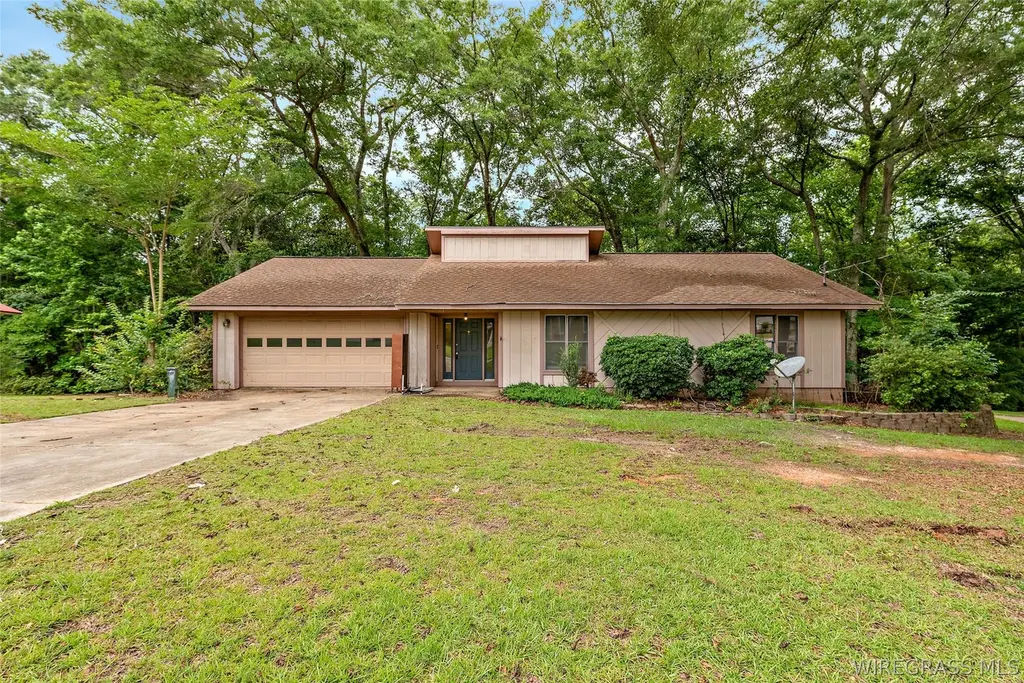
107 Mohawk St · Enterprise, AL
Flood risk 1/10 · Minimal
- FEMA flood zone
- X (unshaded)
- Chance of flooding over 30 yrs
- 0.0%
- Est. flood insurance / yr
- $507 – $1,088
Fire risk 3/10 · Minor
- Est. fire insurance / yr
- $916 – $1,700
Heat risk 8/10 · Major
- Hot days now (above 106°F)
- 7 days/yr
- Hot days in 30 yrs
- 19 days/yr
Wind risk 8/10 · Major
- Chance of severe wind over 30 yrs
- 99.0%
Air-quality risk 2/10 · Minimal
- Unhealthy air days now
- 0 days/yr
- Unhealthy air days in 30 yrs
- 1 days/yr
Risk factors via First Street. Map © Google.
Why this score? — see what drove the C grade
The composite is a weighted blend of 9 inputs, each scored 0–100. Each bar is that input's sub-score; the figure is the points it added to the 100-point composite (weight × sub-score).
- Cash flow +19.0/30.0
- ARV discount +15.0/15.0
- DSCR +6.0/10.0
- Schools +4.3/10.0
- 1% rule +4.2/10.0
- Rent growth +3.5/5.0
- Livability +3.2/5.0
- Condition / age +2.5/5.0
- Appreciation +0.0/10.0
$149,900
🖨 Deal sheet (PDF) 📄 Offer letter ✓ Due diligence
Listing remarks MLS
Chain Link, Very nice home! Walk in closets- sprinkler system- roof new in 2003- new a/c in 2011- fireplace insert in 2013- dishwasher new in 2011- stove new in 2007. Beautiful wood windows and wood trim (both are in excellent shape). Move in ready! There is a deck and a private back yard. Large rooms and freshly painted garage door. ,
Key facts
- Large windows
- Wooded backyard
- Spacious living area
Tags
Property features AI
Finance
- Other: Windows listed as green/energy-efficient
Exterior
- Parking: Attached garage with 2 spaces; Garage door opener
- Security: Fire alarm
- Utilities: Public water; Public sewer; Electricity available; Cable available; Satellite dish
- Home design: Single-family residence; One level
- Construction: HardiPlank-type siding; Slab foundation
- Exterior features: Deck; City lot
Interior
- Kitchen: Oven; Dishwasher; Electric range; Microwave; Self-cleaning oven; Disposal; Water purifier; Electric water heater
- Flooring: Tile flooring; Vinyl flooring
- Bathrooms: 2 full bathrooms
- Heating & cooling: Heat pump heating and cooling; Hot water heating; Ceiling fans
- Interior features: Walk-in closets; Insulated double-pane windows
Neighborhood map
What this means for you Summary
Snapshot
- This is a 3-bed/1.0-bath single-family listed at $150k.
Deal economics
- At list price, monthly cash flow is $157 ($2k/yr) — positive.
- The deal already cash-flows at list — no discount required.
- To meet the 1% rule (rent ≥ 1% of price), the offer needs to be $138k (7.7% below list).
- Recommended offer: $138k (7.7% below list) — sets the bar for 1% rule.
- Cap rate 7.5% vs local median 4.1% in Enterprise — top-decile yield for the area; either an underpriced asset or a hidden risk that comps aren't pricing in. Stress-test before assuming the spread holds.
Location & tenants
- Location reads 65/100 on livability (#127 in AL) — a middle-class / working-renter tenant base. Strengths: cost of living A+, housing A+; Watch: health & safety D, crime F, amenities F.
- Enterprise City (town): math 40% / reading 60% proficiency, ranked #12 of 129 in AL (top 9%) — acceptable for families but not a draw, mixed tenant base, ~2y average lease.
- Zoned schools: Dauphin Junior High School (math 42% / reading 68%, grade B-, #17 of 257 statewide, top 7%, 500 students, 39% FRL); Enterprise High School (math 34% / reading 37%, grade F, #45 of 305 statewide, top 14%, 2,117 students, 44% FRL) — zoned schools at 42% FRL track the district average.
- Market conditions: Rents rising (+3.9%/yr); 444 active listings in the ZIP; 18 comparable units currently listed for rent nearby; rentals lingering (median 45d on market — plan ~5-8 weeks vacancy on turnover, expect pricing pressure); 100% of comp listings sitting > 30 days — soft ceiling on asking rent; solid renter incomes; 137 units permitted in Coffee County in 2024 (0 in 5+ unit buildings).
Forward outlook
- Local home prices are declining (-3.0%/yr); year-one equity from $1k of loan paydown is wiped out by about $4k of value loss. Plan a longer hold.
Negotiation context
- Only 7 days on market — expect competitive offers; lowballing is unlikely to land.
- 5 sale attempts since 12y ago with the ask held roughly flat each time — persistent listings suggest the price (not the market) is what's stuck; bring a comps-based counter.
- Current owner paid $112k; 34% above their basis — modest negotiation headroom, anchor on the comps not their cost.
Risks & watch-outs
- Climate carrying-cost: severe wind risk, 99% chance of damaging wind over 30y; extreme-heat days projected 7→19/yr by 2055 (HVAC capex compounding) — expect insurance premiums to compound above CPI over the hold.
Questions for the listing agent
- Is there a deadline driving the sale (1031 exchange, divorce, estate, relocation)? That informs how much negotiation room exists.
- Crime grade is F in this area — have there been break-ins, vandalism, or insurance claims at this property in the last 3 years? What carrier currently insures it and at what premium?
- What's the average days-on-market for RENTAL listings here right now (not sales)? A rising rental-DOM trend means longer vacancies and softer asking-rent achievability than the comps imply.
- What's the recent tenant-quality profile in this submarket — average credit score on applications, eviction rate, late-payment / NSF rate, and stable-employment percentage? A property-management company in the area should have these aggregated.
- How much new for-sale + rental construction is in the pipeline within 1–3 miles? Heavy new supply typically softens prices + rents 12–24 months out; constrained supply supports both.
Investment metrics
- 1% rule
- 0.92% ✗
- Cap rate
- 7.55%
- Cash-on-cash
- 4.49%
- DSCR
- 1.20
- GRM
- 9.0
CMA / ARV
- ARV (on-the-fly)
- $193,860
- Comps found
- 12
Show comp detail 12 sales within ~0.75 mi
| Address | Dist | Beds/Ba | Sqft | Sold | Price | $/sf | Match |
|---|---|---|---|---|---|---|---|
| 502 Iroquois Rd | 0.17mi | 3/2.0 | 1,471 (+2%) | 11mo | $203,000 | $138 | 75 |
| 406 Iroquois Rd | 0.13mi | 3/2.5 | 1,538 (+7%) | 3mo | $121,500 | $79 | 74 |
| 107 Comanche Cir | 0.18mi | 3/2.5 | 1,466 (+2%) | 11mo | $197,900 | $135 | 73 |
| 109 Cahaba St | 0.34mi | 3/2.0 | 1,504 (+5%) | 0mo | $162,500 | $108 | 72 |
| 105 Don Cir | 0.34mi | 3/2.0 | 1,396 (-3%) | 10mo | $155,000 | $111 | 67 |
| 103 Cahaba St | 0.39mi | 3/2.0 | 1,455 (+1%) | 13mo | $211,000 | $145 | 65 |
| 702 Dixie Dr | 0.48mi | 3/2.0 | 1,338 (-7%) | 7mo | $180,000 | $135 | 56 |
| 105 Chickasaw Rd | 0.47mi | 3/2.0 | 1,528 (+6%) | 13mo | $206,000 | $135 | 52 |
| 807 Morgan Ln | 0.25mi | 4/3.0 (+1) | 1,625 (+13%) | 3mo | $250,000 | $154 | 51 |
| 104 Seminole Dr | 0.41mi | 3/2.0 | 1,602 (+12%) | 11mo | $184,670 | $115 | 49 |
| 215 Cardinal Ln | 0.73mi | 3/2.0 | 1,549 (+8%) | 4mo | $125,000 | $81 | 46 |
| 311 Antler Dr | 0.75mi | 3/2.0 | 1,278 (-11%) | 1mo | $115,000 | $90 | 42 |
Match score weights: distance 35% · size 25% · config 20% · recency 20%. Top-matched comps best support the ARV.
Projected returns pro-forma
-3.0% appreciation · 3.92% rent growth · sell at horizon
- IRR
- -8.4%
- Equity multiple
- 0.69×
- Total profit
- $-13,043
- Equity at exit
- $22,351
- IRR
- 2.2%
- Equity multiple
- 1.16×
- Total profit
- $6,752
- Equity at exit
- $12,961
Cash invested: $41,972 (down + closing). Projections, not guarantees.
Landlord ↔ Tenant lean methodology
- Overall (STATE)
- 90 Strongly Landlord-Friendly
- State Alabama
- 90 Strongly Landlord-Friendly · R+15
- County
- — inherits STATE
- City
- — inherits STATE
ZIP-level market 36330
- Home prices YoY
- -19.4%
- Rents YoY
- 3.9%
- Active inventory
- 444
- Price-to-rent
- 9.0×
Monthly cashflow live
- Estimated rent
- $1,383 high interval (Pro) →
- Mortgage (P&I)
- −$786
- Tax from tax record
- −$87 /mo · $1,048/yr
- Insurance
- −$62
- HOA
- −$0
- Vacancy / Maint / Mgmt
- −$290
- Net cashflow
- $157
Break-even live
Sensitivity live
| Price | -10% $242 | -5% $199 | +0% $157 | +5% $115 | +10% $72 |
|---|---|---|---|---|---|
| Rent | -10% $48 | -5% $102 | +0% $157 | +5% $212 | +10% $266 |
| Rate | -1.0pp $232 | -0.5pp $195 | base $157 | +0.5pp $118 | +1.0pp $79 |
UW: 25.0% down · 7.5% · 30yr · 1.5% tax · 5.0% vac · 8.0% maint · 8.0% mgmt
Financing live
Cash to close
- Down payment
- $37,475
- Closing costs
- $4,497
- Reserves months
- —
- Total cash needed
- —
Loan-product check · same deal, 3 products live
Conventional
25% down · 7.5% · 30yr
- Down + closing
- —
- Monthly P&I
- —
- Monthly cashflow
- —
- DSCR
- —
- Eligible?
- —
Personal DTI + credit; lowest rate.
DSCR
20% down · 8.5% · 30yr
- Down + closing
- —
- Monthly P&I
- —
- Monthly cashflow
- —
- DSCR
- —
- Eligible?
- —
No personal income docs; deal must DSCR.
Hard money
10% down · 12.0% · 12mo
- Down + closing
- —
- Monthly P&I
- —
- Monthly cashflow
- —
- DSCR
- —
- Eligible?
- —
Short-term bridge; refi at stabilization.
Rent comps 18 comps
| Address | Beds | Baths | Sqft | Rent | $/sqft | DOM | Units | Dist |
|---|---|---|---|---|---|---|---|---|
| 200 Cheyenne Dr Enterprise, AL | 2.0 | 1.5 | 1088 | $800 | $0.74 | 45d | 1 | 0.50mi |
| 108 Anthony Cir Unit C Enterprise, AL | 2.0 | 2.0 | 1032 | $900 | $0.87 | 45d | 1 | 0.75mi |
| 210 Morgan Ln Enterprise, AL | 3.0 | 2.0 | 1494 | $1,300 | $0.87 | 45d | 1 | 0.83mi |
| 214 Morgan Ln Enterprise, AL | 3.0 | 2.0 | 1322 | $1,400 | $1.06 | 45d | 1 | 0.83mi |
| 452 Sandy Oak Dr Enterprise, AL | 2.0 | 1.5 | 1300 | $1,150 | $0.88 | 45d | 1 | 0.97mi |
| 443 Sandy Oak Dr Enterprise, AL | 2.0 | 2.5 | 1504 | $1,350 | $0.90 | 45d | 1 | 0.98mi |
| 605 Melbourne Dr Enterprise, AL | 3.0 | 2.0 | 1333 | $1,650 | $1.24 | 45d | 1 | 0.99mi |
| 455 Sandy Oak Dr Enterprise, AL | 3.0 | 2.5 | 1504 | $1,975 | $1.31 | 45d | 1 | 0.99mi |
| 206 Myrick Dr Enterprise, AL | 3.0 | 2.0 | 1800 | $1,595 | $0.89 | 45d | 1 | 1.00mi |
| 106 Pineridge Dr Enterprise, AL | 2.0 | 2.5 | 1427 | $1,150 | $0.81 | 45d | 1 | 1.22mi |
| 137 Commons Dr Unit 1 Enterprise, AL | 2.0 | 2.5 | 1369 | $1,100 | $0.80 | 45d | 1 | 1.24mi |
| 133 Commons Dr Enterprise, AL | 3.0 | 2.5 | 1400 | $1,200 | $0.86 | 45d | 1 | 1.25mi |
| 206 Myrtlewood Dr Enterprise, AL | 3.0 | 2.0 | 1155 | $1,400 | $1.21 | 45d | 1 | 1.27mi |
| 114 Commons Dr Enterprise, AL | 2.0 | 2.5 | 1380 | $1,300 | $0.94 | 45d | 1 | 1.29mi |
| 102 Commons Dr Enterprise, AL | 2.0 | 2.5 | 1380 | $1,250 | $0.91 | 45d | 1 | 1.32mi |
| 220 Candlebrook Dr Enterprise, AL | 2.0 | 1.5 | 1024 | $995 | $0.97 | 45d | 1 | 1.35mi |
| 224 Candlebrook Dr Enterprise, AL | 2.0 | 1.5 | 1024 | $1,050 | $1.03 | 45d | 1 | 1.35mi |
| 184 N Springview Dr Enterprise, AL | 3.0 | 2.5 | 1494 | $1,350 | $0.90 | 45d | 1 | 1.49mi |
Listing history 10 events
-
2026-06-17status $149,900 Pending 7 DOM
-
2026-06-16days on market $149,900 Active 7 DOM
-
2026-06-15days on market $149,900 Active 6 DOM
-
2026-06-14status $149,900 Active 4 DOM
-
2026-06-07statusdays on market $149,900 Pending 4 DOM
-
2026-06-05days on market $149,900 Active 3 DOM
-
2026-06-03days on market $149,900 Active 2 DOM
-
2026-06-03price $149,900 Active 1 DOM
-
2026-06-01remarks 687-char remark
-
2026-06-01$154,900 Active 1 DOM
ⓘ Source: listings_history table (triggers on properties + properties_extension) + one-shot
backfill from property_details.listing_events for pre-trigger history.
Tax reassessment forecast AL · Resets to sale price
- Current annual tax
- $1,048 · $87/mo
- Projected year-2 tax
- $1,048 · $87/mo
- Expected delta
- $0/yr ($0/mo · 0.0%)
ⓘ Screening estimate from a state-policy table — verify with the county assessor before closing.
Climate risk First Street
- Flood 1/10 Low FEMA zone X (unshaded) · 0% chance over 30 yrs
- Wildfire 3/10 Moderate
- Heat 8/10 Severe 7 d/yr ≥106°F today · 19 d/yr by 30 yrs out
- Wind 8/10 Severe 99% chance of damaging wind over 30 yrs
- Air quality 2/10 Low 0 unhealthy d/yr today · 1 by 30 yrs out
Nearby sold comps map
Loading sold comps map…
Walkable amenities ~0.75 mi
Loading nearby amenities…
Taxation est. · year 1
- Rental income
- $16,600
- − Mortgage interest
- −$8,397
- − Property taxes
- −$1,048
- − Insurance
- −$750
- − Repairs & maintenance
- −$1,328
- − Management
- −$1,328
- − Depreciation
- −$4,361
- Taxable loss
- −$611
- Est. tax savings @ 24.0%
- +$147
- After-tax cash flow
- $2,030/yr
For passive investors: Depreciation is non-cash, so a rental often shows a tax loss while cash-flowing — sheltering income. Rental losses are passive: they offset passive income freely, and up to $25,000/yr can offset ordinary (W-2) income if you actively participate and your MAGI is under $100k (phasing out to $0 by $150k); unused losses carry forward. On sale, claimed depreciation is recaptured at up to 25%, and gains may owe capital-gains tax (a 1031 exchange can defer both). Figures are a year-1 estimate at your 24.0% rate — not tax advice; consult a CPA.
Schools (NCES district)
- District
- Enterprise City
- NCES district ID
- 0101320
- Math proficiency
- 40% ▼ -20.00%
- Reading proficiency
- 60% ▲ 4.00%
- Median HH income
- $51,311
- Composite
- 42.83/100
- National rank
- #3136
- State rank
- #12 of 129 in AL
Livability — Enterprise
- Score
- 65/100
- State rank
- #127
- US rank
- #12953
Category grades
Schools grade is shown separately in the Schools card above.
Census & demographics
- Census place
- Enterprise, AL
- County
- Coffee County · 39,557 people
- City population
- 39,557
- Metro
- Enterprise, AL
- Population (ZIP)
- 39,557
- Household income
- $75,765
- Rent vs Own
- Severe rent burden
- 1126.0
Population outlook (Coffee County) Hauer SSP2
- Today (2025)
- 53,133 people
- By 2030
- 53,832 · +1.3%
- By 2040
- 54,504 · +2.6%
- By 2050
- 54,289 · +2.2%
- By 2075
- 51,175 · -3.7%
- By 2100
- 46,793 · -11.9%
Race, ethnicity, and origin ACS 2023
- Neighborhood character
- Diverse neighborhood (Simpson 0.56)
- Race & ethnicity
- White 63% Black 17% Hispanic / Latino 13% Two or more races 9% Asian 1%
- Hispanic origin (detail)
- Mexican 6% Puerto Rican 3%
- Common ancestry
- Italian 3% Lithuanian 2% Serbian 2%
- Foreign-born
- 6% · Canada, Vietnam, South Korea
- Languages at home
- 89% English-only · Spanish 8% German/W. Germanic 2%
Political lean MEDSL · Coffee
- 2024 margin
- Solid R (+57.9) · D 20.7% · R 78.6%
- 2008→2024 swing
- -9.0pp toward R · 2008: -48.9pp · 2024: -57.9pp
- All cycles
- 2024: R+57.9 2020: R+53.1 2016: R+56.7 2012: R+49.4 2008: R+48.9
Not yet ingested
- Civics
- —
Market trends
- HPI YoY
- ▼ -44.44%
- Current HPI
- 184.0163
- Rent YoY
- ▲ 3.92%
- Metro
- Enterprise, AL
- State GDP YoY
- ▲ 2.94%
- F500 in state
- 4
Industry mix (Fortune 500 HQ in AL)
| Industry | F500 HQs | Revenue |
|---|---|---|
| Financial Services | 1 | $8B |
|
||
| Healthcare | 1 | $5B |
|
||
Price history
+30.2% since first listed8 events — show timeline
- 2026-06-01 Listed $154,900 WBR
- 2016-04-06 Sold (Public Records) $112,100 Public Records
- 2016-04-04 Sold (MLS) $112,000 MAAR
- 2016-04-04 Sold (MLS) $112,000 WBR
- 2016-01-20 Listed $119,000 MAAR
- 2016-01-20 Listed $119,000 WBR
- 2014-08-13 Listed $119,000 WBR
- 2014-08-13 Listed $119,000 MAAR
Property tax history
+0.0%/yrLatest (2016): $1,048 · +0.0% YoY. Source: county tax records.
Cash-flow waterfall
monthlySold comps — $/sqft
last 12 mo · ≤1 miLoading sold comps…