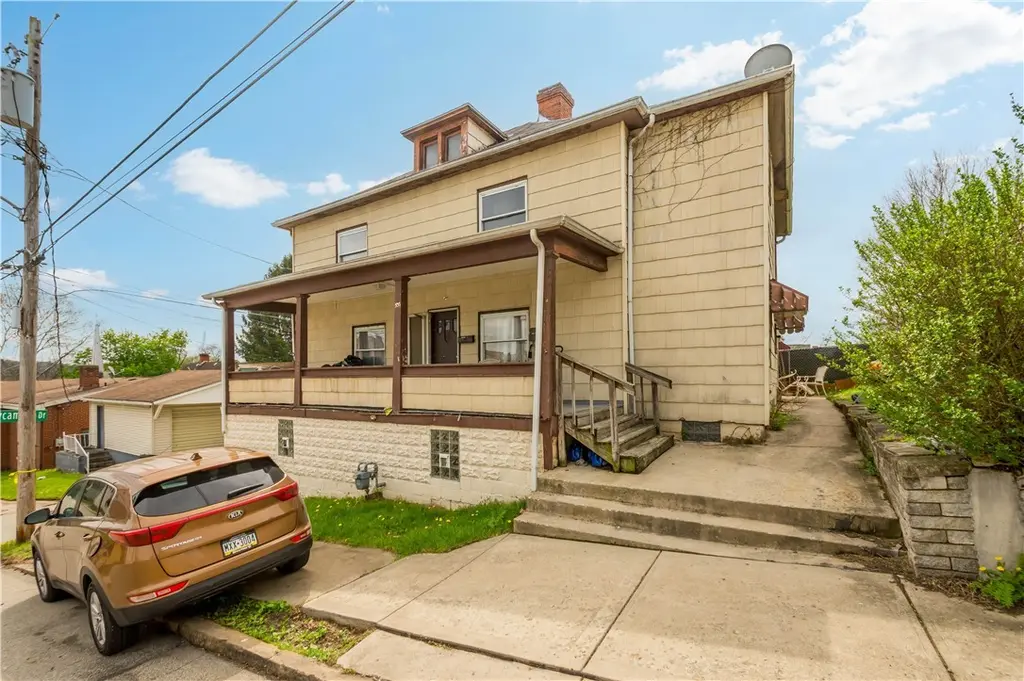
537 6th St · Donora, PA
Flood risk 1/10 · Minimal
- FEMA flood zone
- X (unshaded)
- Chance of flooding over 30 yrs
- 0.0%
- Est. flood insurance / yr
- $473 – $860
Fire risk 1/10 · Minimal
- Est. fire insurance / yr
- $511 – $949
Heat risk 4/10 · Minor
- Hot days now (above 98°F)
- 7 days/yr
- Hot days in 30 yrs
- 18 days/yr
Wind risk 2/10 · Minimal
- Chance of severe wind over 30 yrs
- —
Air-quality risk 2/10 · Minimal
- Unhealthy air days now
- 1 days/yr
- Unhealthy air days in 30 yrs
- 2 days/yr
Risk factors via First Street. Map © Google.
Why this score? — see what drove the B- grade
The composite is a weighted blend of 9 inputs, each scored 0–100. Each bar is that input's sub-score; the figure is the points it added to the 100-point composite (weight × sub-score).
- Cash flow +30.0/30.0
- 1% rule +10.0/10.0
- DSCR +10.0/10.0
- Appreciation +7.5/10.0
- Livability +3.2/5.0
- Rent growth +2.5/5.0
- Condition / age +2.5/5.0
- Schools +2.4/10.0
- ARV discount +0.0/15.0
$75,000
🖨 Deal sheet (PDF) 📄 Offer letter ✓ Due diligence
Listing remarks
Looking for a cash flowing 2-bed duplex in Donora at an entry price point? This up and down duplex at 537 6th St offers two 2 bed, 1 bath units, both currently rented, making it a straightforward addition to a rental portfolio in the Ringgold School District. Welcome to 537 6th St in Donora, a 2-bed duplex in Donora designed for investors seeking immediate rental income. This up and down duplex features two units, each offering 2 bedrooms and 1 full bath, with a total of 2,145 square feet of interior space. Both units are currently rented, providing instant income from day one. The property sits on a 45 x 77 lot and includes on street parking with no HOA requirements. The straightforward la
Key facts
- Rented units
- Cash flowing duplex
- Entry price point
Tags
Property features AI
Finance
- Other: Tax assessed value $42,700; Annual tax amount $1,234
- Financial info: One unit currently rents for $746; The other unit currently rents for $685
Exterior
- Utilities: Natural gas available
- Home design: Multifamily property
- Exterior features: Zoned X
Interior
- Bedrooms: Each unit has 2 bedrooms
- Bathrooms: Each unit has 1 full bathroom
- Interior features: Two-unit property (multifamily)
Neighborhood map
What this means for you Summary
Snapshot
- This is a 4-bed/2.0-bath other listed at $75k.
Deal economics
- At list price, monthly cash flow is $512 ($6k/yr) — positive.
- The deal already cash-flows at list — no discount required.
- Meets the 1% rule at list price ($1k rent vs $75k).
- Recommended offer: $70k (6.0% below list) — sets the bar for market timing.
Location & tenants
- Location reads 64/100 on livability (#1,198 in PA) — a middle-class / working-renter tenant base. Strengths: cost of living A+, housing A+, crime A-; Watch: health & safety D, amenities F, commute F.
- Ringgold SD (suburban): math 19% / reading 36% proficiency, ranked #452 of 539 in PA (top 84%) — low school quality limits family demand, transient renter base, plan for 1-2y turnover.
- Zoned schools: Ringgold El Sch South (math 22% / reading 47%, grade F, #1,049 of 1,518 statewide, top 71%, 580 students, 100% FRL); Ringgold Ms (math 9% / reading 29%, grade F, #447 of 512 statewide, top 88%, 787 students, 100% FRL); Ringgold Shs (math 57% / reading 24%, grade F, #255 of 437 statewide, top 60%, 852 students, 82% FRL) — zoned schools average 94% FRL vs 41% district-wide (53 pts higher); higher-poverty schools than district average — tighter screening recommended.
- Market conditions: 23 active listings in the ZIP; lower-income renter base — watch delinquency; 489 units permitted in Washington County in 2024 (30 in 5+ unit buildings).
- This rent runs 40% of the median local income ($40k/yr) — at the standard rent-burdened threshold; future hikes will face affordability resistance.
Forward outlook
- In year one you build about $4k of equity ($519 loan paydown + $4k appreciation (5.0% local appreciation)).
- Washington County population projected to shrink 6% by 2050 — rents likely to lag national; underwrite the cash flow, not the appreciation.
- At projected returns (5.0% appreciation + 3.0% rent growth), your $21k cash investment doubles in ~2 years — after that, you're playing with house money.
- By year 8, paydown + projected appreciation supports a ~$33k cash-out refi (75% LTV) — recoverable capital for the next deal without selling this one.
Negotiation context
- It's been on market 66 days — a 6% lower offer ($70k) is reasonable based on typical stale-listing flexibility.
- Current owner paid $48k; list at $75k implies a 58% gain — meaningful room to come down on a strong offer.
Risks & watch-outs
- Watch-outs: built in 1930 — expect roof / HVAC / electrical / plumbing capex.
Questions for the listing agent
- It's been on market 66 days. Have you received any prior offers? Is the seller open to a 6% concession, seller financing, or rate buy-down credit?
- Built in 1930 — when were the roof, HVAC, electrical panel, plumbing, and water heater last replaced?
- Why hasn't it sold? Are there any deal-killer items the seller is aware of (foundation, flood, title, zoning, code violations)?
- Is there a deadline driving the sale (1031 exchange, divorce, estate, relocation)? That informs how much negotiation room exists.
- Schools are F-rated, which usually means shorter tenancies and higher turnover. Who's the typical renter profile here, and what's been the actual vacancy rate?
- What's the average days-on-market for RENTAL listings here right now (not sales)? A rising rental-DOM trend means longer vacancies and softer asking-rent achievability than the comps imply.
- What's the recent tenant-quality profile in this submarket — average credit score on applications, eviction rate, late-payment / NSF rate, and stable-employment percentage? A property-management company in the area should have these aggregated.
- How much new for-sale + rental construction is in the pipeline within 1–3 miles? Heavy new supply typically softens prices + rents 12–24 months out; constrained supply supports both.
Investment metrics
- 1% rule
- 1.75% ✓
- Cap rate
- 14.48%
- Cash-on-cash
- 29.24%
- DSCR
- 2.30
- GRM
- 4.8
CMA / ARV
- ARV (median comp)
- $58,530
- List price
- $75,000
- Delta
- 28.14%
- Verdict
- OVERPRICED
- Comps
- 1 within 2.0 mi
Projected returns pro-forma
5.03% appreciation · 3.0% rent growth · sell at horizon
- IRR
- 38.6%
- Equity multiple
- 3.38×
- Total profit
- $50,029
- Equity at exit
- $42,634
- IRR
- 36.7%
- Equity multiple
- 6.86×
- Total profit
- $123,065
- Equity at exit
- $73,690
Cash invested: $21,000 (down + closing). Projections, not guarantees.
Landlord ↔ Tenant lean methodology
- Overall (STATE)
- 62 Landlord-Friendly
- State Pennsylvania
- 62 Landlord-Friendly · EVEN
- County
- — inherits STATE
- City
- — inherits STATE
ZIP-level market 15033
- Home prices YoY
- 4.8%
- Active inventory
- 23
- Price-to-rent
- 4.8×
Monthly cashflow live
- Estimated rent
- $1,315 medium interval (Pro) →
- Mortgage (P&I)
- −$393
- Tax from tax record
- −$103 /mo · $1,234/yr
- Insurance
- −$31
- HOA
- −$0
- Lot rent
- −$0
- Vacancy / Maint / Mgmt
- −$276
- Net cashflow
- $512
Break-even live
Sensitivity live
| Price | -10% $554 | -5% $533 | +0% $512 | +5% $491 | +10% $469 |
|---|---|---|---|---|---|
| Rent | -10% $408 | -5% $460 | +0% $512 | +5% $564 | +10% $616 |
| Rate | -1.0pp $550 | -0.5pp $531 | base $512 | +0.5pp $492 | +1.0pp $473 |
UW: 25.0% down · 7.5% · 30yr · 1.5% tax · 5.0% vac · 8.0% maint · 8.0% mgmt
Financing live
Cash to close
- Down payment
- $18,750
- Closing costs
- $2,250
- Reserves months
- —
- Total cash needed
- —
Loan-product check · same deal, 3 products live
Conventional
25% down · 7.5% · 30yr
- Down + closing
- —
- Monthly P&I
- —
- Monthly cashflow
- —
- DSCR
- —
- Eligible?
- —
Personal DTI + credit; lowest rate.
DSCR
20% down · 8.5% · 30yr
- Down + closing
- —
- Monthly P&I
- —
- Monthly cashflow
- —
- DSCR
- —
- Eligible?
- —
No personal income docs; deal must DSCR.
Hard money
10% down · 12.0% · 12mo
- Down + closing
- —
- Monthly P&I
- —
- Monthly cashflow
- —
- DSCR
- —
- Eligible?
- —
Short-term bridge; refi at stabilization.
Listing history 18 events
-
2026-06-22days on market $75,000 Active 66 DOM
-
2026-06-21days on market $75,000 Active 65 DOM
-
2026-06-18days on market $75,000 Active 62 DOM
-
2026-06-17days on market $75,000 Active 61 DOM
-
2026-06-16days on market $75,000 Active 60 DOM
-
2026-06-15days on market $75,000 Active 59 DOM
-
2026-06-13days on market $75,000 Active 57 DOM
-
2026-06-13days on market $75,000 Active 56 DOM
-
2026-06-09days on market $75,000 Active 53 DOM
-
2026-06-08days on market $75,000 Active 52 DOM
-
2026-06-07days on market $75,000 Active 51 DOM
-
2026-06-05days on market $75,000 Active 48 DOM
-
2026-06-03days on market $75,000 Active 47 DOM
-
2026-06-02days on market $75,000 Active 46 DOM
-
2026-06-01days on market $75,000 Active 45 DOM
-
2026-05-31days on market $75,000 Active 44 DOM
-
2026-04-15$75,000 Active 1085-char remark
-
2022-06-07soldstatus $47,500
ⓘ Source: listings_history table (triggers on properties + properties_extension) + one-shot
backfill from property_details.listing_events for pre-trigger history.
Tax reassessment forecast PA · Partial reset (capped growth)
- Current annual tax
- $1,234 · $103/mo
- Projected year-2 tax
- $1,234 · $103/mo
- Expected delta
- $0/yr ($0/mo · 0.0%)
ⓘ Screening estimate from a state-policy table — verify with the county assessor before closing.
Climate risk First Street
- Flood 1/10 Low FEMA zone X (unshaded) · 0% chance over 30 yrs
- Wildfire 1/10 Low
- Heat 4/10 Moderate 7 d/yr ≥98°F today · 18 d/yr by 30 yrs out
- Wind 2/10 Low
- Air quality 2/10 Low 1 unhealthy d/yr today · 2 by 30 yrs out
Nearby sold comps map
Loading sold comps map…
Walkable amenities ~0.75 mi
Loading nearby amenities…
Taxation est. · year 1
- Rental income
- $15,784
- − Mortgage interest
- −$4,201
- − Property taxes
- −$1,234
- − Insurance
- −$375
- − Repairs & maintenance
- −$1,263
- − Management
- −$1,263
- − Depreciation
- −$2,182
- Taxable income
- $5,267
- Est. tax owed @ 24.0%
- −$1,264
- After-tax cash flow
- $4,877/yr
For passive investors: Depreciation is non-cash, so a rental often shows a tax loss while cash-flowing — sheltering income. Rental losses are passive: they offset passive income freely, and up to $25,000/yr can offset ordinary (W-2) income if you actively participate and your MAGI is under $100k (phasing out to $0 by $150k); unused losses carry forward. On sale, claimed depreciation is recaptured at up to 25%, and gains may owe capital-gains tax (a 1031 exchange can defer both). Figures are a year-1 estimate at your 24.0% rate — not tax advice; consult a CPA.
Schools (NCES district)
- District
- Ringgold SD
- NCES district ID
- 4220400
- Math proficiency
- 19% ▼ -20.00%
- Reading proficiency
- 36% ▼ -18.00%
- Median HH income
- $46,754
- Composite
- 23.75/100
- National rank
- #7819
- State rank
- #452 of 539 in PA
Livability — Donora
- Score
- 64/100
- State rank
- #1198
- US rank
- #14079
Category grades
Schools grade is shown separately in the Schools card above.
Census & demographics
- Census place
- Donora, PA
- County
- Washington County · 106,469 people
- City population
- 4,572
- Metro
- Pittsburgh, PA
- Population (ZIP)
- 4,572
- Household income
- $39,921
- Rent vs Own
- Severe rent burden
- 363.0
Population outlook (Washington County) Hauer SSP2
- Today (2025)
- 208,060 people
- By 2030
- 207,168 · -0.4%
- By 2040
- 202,738 · -2.6%
- By 2050
- 195,269 · -6.1%
- By 2075
- 175,588 · -15.6%
- By 2100
- 145,827 · -29.9%
Race, ethnicity, and origin ACS 2023
- Neighborhood character
- Predominantly White (73%)
- Race & ethnicity
- White 73% Black 16% Two or more races 9% Hispanic / Latino 3%
- Common ancestry
- Scotch-Irish 5% Romanian 5% Subsaharan African 1%
- Foreign-born
- 1%
Political lean MEDSL · Washington
- 2024 margin
- Strong R (+25.5) · D 36.9% · R 62.4%
- 2008→2024 swing
- -20.8pp toward R · 2008: -4.7pp · 2024: -25.5pp
- All cycles
- 2024: R+25.5 2020: R+22.8 2016: R+25.3 2012: R+13.3 2008: R+4.7
Not yet ingested
- Civics
- —
Market trends
- HPI YoY
- ▲ 5.03%
- Current HPI
- 110.5976
- Rent YoY
- —
- Metro
- Pittsburgh, PA
- State GDP YoY
- ▲ 1.68%
- F500 in state
- 34
Industry mix (Fortune 500 HQ in PA)
| Industry | F500 HQs | Revenue |
|---|---|---|
| Healthcare | 2 | $309B |
|
||
| Insurance | 2 | $27B |
|
||
| Telecommunications / Media | 1 | $124B |
|
||
| Industrial Distribution | 1 | $22B |
|
||
| Financial Services | 1 | $20B |
|
||
| Chemicals / Materials | 1 | $18B |
|
||
Price history
+57.9% since first listed2 events — show timeline
- 2026-04-15 Listed $75,000 West Penn MLS
- 2022-06-07 Sold (Public Records) $47,500 Public Records
Property tax history
+4.7%/yrLatest (2026): $1,234 · +2.8% YoY. Source: county tax records.
Cash-flow waterfall
monthlySold comps — $/sqft
last 12 mo · ≤1 miLoading sold comps…