2561 Bermuda St · Clearwater, FL
Flood risk 1/10 · Minimal
- FEMA flood zone
- X (unshaded)
- Chance of flooding over 30 yrs
- 0.0%
- Est. flood insurance / yr
- $507 – $1,088
Fire risk 1/10 · Minimal
- Est. fire insurance / yr
- $947 – $1,759
Heat risk 10/10 · Severe
- Hot days now (above 107°F)
- 7 days/yr
- Hot days in 30 yrs
- 27 days/yr
Wind risk 10/10 · Severe
- Chance of severe wind over 30 yrs
- 99.0%
Air-quality risk 3/10 · Minor
- Unhealthy air days now
- 3 days/yr
- Unhealthy air days in 30 yrs
- 3 days/yr
Risk factors via First Street. Map © Google.
Why this score? — see what drove the B grade
The composite is a weighted blend of 9 inputs, each scored 0–100. Each bar is that input's sub-score; the figure is the points it added to the 100-point composite (weight × sub-score).
- Cash flow +30.0/30.0
- 1% rule +10.0/10.0
- DSCR +10.0/10.0
- ARV discount +7.5/15.0
- Schools +4.3/10.0
- Livability +4.1/5.0
- Condition / age +2.5/5.0
- Rent growth +1.8/5.0
- Appreciation +0.0/10.0
$79,900
🖨 Deal sheet 📄 Offer letter ✓ Due diligence
Listing remarks
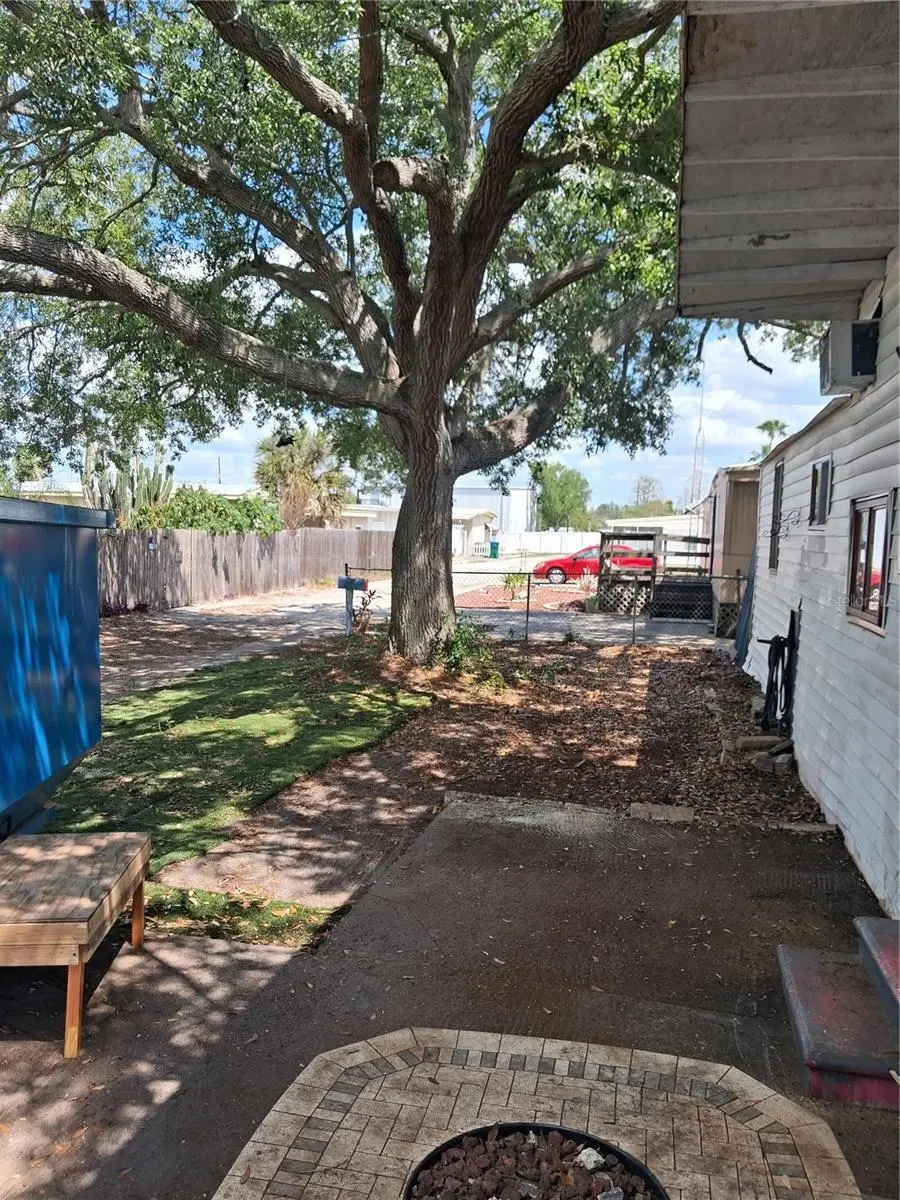
CLEARWATER GEM AT SUNSET POINT AND US 19. LAND INCLUDED…. NO HOA FEES. ZERO LEASE FEES. . THIS LISTING IS FOR THE LAND WITH THE 2 BR/1BA HOME ON IT INCLUDED…. HOME IS WITHIN WALKING DISTANCE OF ALDI (3 minute walk with no crossing the street) 1 minute access to US 19 …HAS A GREAT FULLY FENCED BACKYARD READY FOR A BBQ GRILL…. GOOD SCHOOLS…. SHADED BY A BEAUTIFUL OAK TREE with an absolutely perfect location. This high and dry lot has an EXISTING SEPTIC SYSTEM INSTALLED. .active water service and full electric.
Key facts
- Complete privacy
- 3,380 sq ft lot
- Built 1971
Tags
Property features AI
Finance
- Other: Property is homesteaded
- Financial info: No investor or income/expense details
- HOA & community: No HOA or association
Exterior
- Parking: No parking information provided
- Security: No security features listed
- Utilities: Public water available; Public sewer available; Septic tank listed; Electricity connected
- Home design: Single-wide mobile home; Residential property; One story; Faces north; Entry level: One
- Construction: Built with other construction materials; Other roof type; Other foundation details; Building area approximately 696 sq ft (living area ~648 sq ft)
- Exterior features: Lot approximately 0.08 acre (about 80 x 45 feet); Unimproved road access; No waterfront or water view
Interior
- Kitchen: No appliances listed
- Bedrooms: 1 bedroom
- Flooring: Laminate flooring; Wood flooring
- Bathrooms: 1 full bathroom
- Heating & cooling: No heating; No cooling
- Interior features: No interior features listed
- Laundry & utility: No laundry hookups or features
Neighborhood map
What this means for you Summary
Snapshot
- This is a 1-bed/1.0-bath manufactured listed at $80k.
Deal economics
- At list price, monthly cash flow is $593 ($7k/yr) — positive.
- The deal already cash-flows at list — no discount required.
- Meets the 1% rule at list price ($1k rent vs $80k).
- Recommended offer: $78k (3.0% below list) — sets the bar for market timing.
- Cap rate 15.2% vs local median 2.9% in Clearwater — top-decile yield for the area; either an underpriced asset or a hidden risk that comps aren't pricing in. Stress-test before assuming the spread holds.
Location & tenants
- Location reads 82/100 on livability (#60 in FL, #988 nationally) — a professional / high-income tenant draw. Strengths: commute A+, housing A+, health & safety A+; Watch: employment C-.
- Pinellas (suburban): math 51% / reading 51% proficiency, ranked #31 of 73 in FL (top 42%) — acceptable for families but not a draw, mixed tenant base, ~2y average lease.
- Zoned schools: Mcmullen-Booth Elementary School (math 44% / reading 46%, grade D-, #1,271 of 2,144 statewide, top 60%, 458 students, 63% FRL); Countryside High School (math 25% / reading 45%, grade F, #379 of 667 statewide, top 58%, 1,741 students, 44% FRL).
- Market conditions: Rents soft (-2.6%/yr); 288 active listings in the ZIP; 12 comparable units currently listed for rent nearby; rentals leasing fast (median 4d on market — plan ~1-2 weeks tenant-placement turnaround); 2,676 units permitted in Pinellas County in 2024 (1,422 in 5+ unit buildings).
- This rent runs 32% of the median local income ($55k/yr) — at the standard rent-burdened threshold; future hikes will face affordability resistance.
Forward outlook
- Local home prices are declining (-3.0%/yr); year-one equity from $552 of loan paydown is wiped out by about $2k of value loss. Plan a longer hold.
- Pinellas County population projected at +14% by 2050 — modest demand growth; plan on rents tracking national, not racing it.
- At projected returns (-3.0% appreciation + 0.0% rent growth), your $22k cash investment doubles in ~5 years — after that, you're playing with house money.
Negotiation context
- It's been on market 32 days — a 3% lower offer ($78k) is reasonable based on typical stale-listing flexibility.
- Current owner paid $65k; 23% above their basis — modest negotiation headroom, anchor on the comps not their cost.
Risks & watch-outs
- Climate carrying-cost: severe wind risk, 99% chance of damaging wind over 30y; extreme-heat days projected 7→27/yr by 2055 (HVAC capex compounding) — expect insurance premiums to compound above CPI over the hold.
Questions for the listing agent
- It's been on market 32 days. Have you received any prior offers? Is the seller open to a 3% concession, seller financing, or rate buy-down credit?
- Built in 1971 — when were the roof, HVAC, electrical panel, plumbing, and water heater last replaced?
- Is there a deadline driving the sale (1031 exchange, divorce, estate, relocation)? That informs how much negotiation room exists.
- What's the average days-on-market for RENTAL listings here right now (not sales)? A rising rental-DOM trend means longer vacancies and softer asking-rent achievability than the comps imply.
- What's the recent tenant-quality profile in this submarket — average credit score on applications, eviction rate, late-payment / NSF rate, and stable-employment percentage? A property-management company in the area should have these aggregated.
- How much new for-sale + rental construction is in the pipeline within 1–3 miles? Heavy new supply typically softens prices + rents 12–24 months out; constrained supply supports both.
Investment metrics
- 1% rule
- 1.82% ✓
- Cap rate
- 15.19%
- Cash-on-cash
- 31.78%
- DSCR
- 2.41
- GRM
- 4.6
CMA / ARV
No comps found within radius.
Projected returns pro-forma
-3.0% appreciation · 0.0% rent growth · sell at horizon
- IRR
- 23.3%
- Equity multiple
- 1.92×
- Total profit
- $20,560
- Equity at exit
- $11,913
- IRR
- 29.2%
- Equity multiple
- 3.24×
- Total profit
- $50,151
- Equity at exit
- $6,908
Cash invested: $22,372 (down + closing). Projections, not guarantees.
Landlord ↔ Tenant lean methodology
- Overall (STATE)
- 87 Strongly Landlord-Friendly
- State Florida
- 87 Strongly Landlord-Friendly · R+3
- County
- — inherits STATE
- City
- — inherits STATE
ZIP-level market 33763
- Rents YoY
- -2.6%
- Active inventory
- 288
- Price-to-rent
- 4.6×
Monthly cashflow live
- Estimated rent
- $1,452 high interval (Pro) →
- Mortgage (P&I)
- −$419
- Tax from tax record
- −$102 /mo · $1,225/yr
- Insurance
- −$33
- HOA
- −$0
- Vacancy / Maint / Mgmt
- −$305
- Net cashflow
- $593
Break-even live
UW: 25.0% down · 7.5% · 30yr · 1.5% tax · 5.0% vac · 8.0% maint · 8.0% mgmt
Financing live
Cash to close
- Down payment
- $19,975
- Closing costs
- $2,397
- Reserves months
- —
- Total cash needed
- —
Loan-product check · same deal, 3 products live
Conventional
25% down · 7.5% · 30yr
- Down + closing
- —
- Monthly P&I
- —
- Monthly cashflow
- —
- DSCR
- —
- Eligible?
- —
Personal DTI + credit; lowest rate.
DSCR
20% down · 8.5% · 30yr
- Down + closing
- —
- Monthly P&I
- —
- Monthly cashflow
- —
- DSCR
- —
- Eligible?
- —
No personal income docs; deal must DSCR.
Hard money
10% down · 12.0% · 12mo
- Down + closing
- —
- Monthly P&I
- —
- Monthly cashflow
- —
- DSCR
- —
- Eligible?
- —
Short-term bridge; refi at stabilization.
Rent comps 12 comps
| Address | Beds | Baths | Sqft | Rent | $/sqft | DOM | Units | Dist |
|---|---|---|---|---|---|---|---|---|
| 24862 US Highway 19 N #3202 Clearwater, FL | 1.0 | 1.0 | 600 | $1,295 | $2.16 | 4d | 1 | 0.16mi |
| 24862 U.S. 19 Unit 3202 1 Clearwater, FL | 1.0 | 1.0 | 640 | $1,295 | $2.02 | 23d | 1 | 0.17mi |
| 2031 Glass Loop Clearwater, FL | 1.0–3.0 | 1.0–2.0 | 1058 | $1,848 | $1.75 | 2d | 34 | 0.32mi |
| 25350 US Highway 19 N Clearwater, FL | 3.0 | 1.0–2.0 | 875 | $1,466 | $1.68 | 2d | 28 | 0.49mi |
| 2400 Franciscan Dr #44 Clearwater, FL | 1.0 | 1.0 | 735 | $1,200 | $1.63 | 24d | 1 | 0.62mi |
| 1730 Audrey Dr Unit 2 Clearwater, FL | 1.0 | 1.0 | 700 | $2,100 | $3.00 | 24d | 1 | 0.86mi |
| 2599 Countryside Blvd #210 Clearwater, FL | 1.0 | 1.0 | 575 | $1,400 | $2.43 | 2d | 1 | 1.04mi |
| 2625 Florida 590 Unit 1414 Clearwater, FL | 1.0 | 1.0 | 600 | $1,300 | $2.17 | 24d | 1 | 1.08mi |
| 2597 Countryside Blvd #209 Clearwater, FL | 1.0 | 1.0 | 575 | $1,500 | $2.61 | 4d | 1 | 1.09mi |
| 2481 NE Coachman Rd Clearwater, FL | 1.0–2.0 | 1.0–2.0 | 762 | $1,424 | $1.87 | 1d | 14 | 1.23mi |
| 2524 Alexander Pl Clearwater, FL | 1.0–3.0 | 1.0–2.0 | 991 | $1,735 | $1.75 | 2d | 20 | 1.29mi |
| 2583 Countryside Blvd #3103 Clearwater, FL | 1.0 | 1.0 | 555 | $1,400 | $2.52 | 24d | 1 | 1.29mi |
Listing history 18 events
-
2026-06-18days on market $79,900 Active 32 DOM
-
2026-06-17days on market $79,900 Active 31 DOM
-
2026-06-16days on market $79,900 Active 30 DOM
-
2026-06-15days on market $79,900 Active 29 DOM
-
2026-06-13remarks 516-char remark
-
2026-06-13days on market $79,900 Active 27 DOM
-
2026-06-09pricedays on market $79,900 Active 23 DOM
-
2026-06-08days on market $99,000 Active 22 DOM
-
2026-06-07remarks 306-char remark
-
2026-06-07days on market $99,000 Active 21 DOM
-
2026-06-04days on market $99,000 Active 18 DOM
-
2026-06-03days on market $99,000 Active 17 DOM
-
2026-06-01days on market $99,000 Active 15 DOM
-
2026-05-31days on market $99,000 Active 14 DOM
-
2026-05-17$99,000 Active
-
2022-07-06soldstatus $65,000
-
2005-05-23soldstatus $45,000
-
1985-12-01soldstatus $23,000
ⓘ Source: listings_history table (triggers on properties + properties_extension) + one-shot
backfill from property_details.listing_events for pre-trigger history.
Tax reassessment forecast FL · Resets to sale price
- Current annual tax
- $1,225 · $102/mo
- Projected year-2 tax
- $1,225 · $102/mo
- Expected delta
- $0/yr ($0/mo · 0.0%)
ⓘ Screening estimate from a state-policy table — verify with the county assessor before closing.
Climate risk First Street
- Flood 1/10 Low FEMA zone X (unshaded) · 0% chance over 30 yrs
- Wildfire 1/10 Low
- Heat 10/10 Extreme 7 d/yr ≥107°F today · 27 d/yr by 30 yrs out
- Wind 10/10 Extreme 99% chance of damaging wind over 30 yrs
- Air quality 3/10 Moderate 3 unhealthy d/yr today · 3 by 30 yrs out
Nearby sold comps map
Loading sold comps map…
Walkable amenities ~0.75 mi
Loading nearby amenities…
Taxation est. · year 1
- Rental income
- $17,422
- − Mortgage interest
- −$4,476
- − Property taxes
- −$1,225
- − Insurance
- −$400
- − Repairs & maintenance
- −$1,394
- − Management
- −$1,394
- − Depreciation
- −$2,324
- Taxable income
- $6,210
- Est. tax owed @ 24.0%
- −$1,490
- After-tax cash flow
- $5,620/yr
For passive investors: Depreciation is non-cash, so a rental often shows a tax loss while cash-flowing — sheltering income. Rental losses are passive: they offset passive income freely, and up to $25,000/yr can offset ordinary (W-2) income if you actively participate and your MAGI is under $100k (phasing out to $0 by $150k); unused losses carry forward. On sale, claimed depreciation is recaptured at up to 25%, and gains may owe capital-gains tax (a 1031 exchange can defer both). Figures are a year-1 estimate at your 24.0% rate — not tax advice; consult a CPA.
Schools (NCES district)
- District
- Pinellas
- NCES district ID
- 1201560
- Math proficiency
- 51% ▼ -5.00%
- Reading proficiency
- 51% ▼ -3.00%
- Median HH income
- $46,270
- Composite
- 43.27/100
- National rank
- #3046
- State rank
- #31 of 73 in FL
Livability — Clearwater
- Score
- 82/100
- State rank
- #60
- US rank
- #988
Category grades
Schools grade is shown separately in the Schools card above.
Census & demographics
- County
- Pinellas County · 939,478 people
- City population
- 170,933
- Metro
- Tampa-St. Petersburg-Clearwater, FL
- Population (ZIP)
- 21,146
- Household income
- $54,794
- Rent vs Own
- Severe rent burden
- 753.0
Population outlook (Pinellas County) Hauer SSP2
- Today (2025)
- 1,027,532 people
- By 2030
- 1,063,586 · +3.5%
- By 2040
- 1,125,020 · +9.5%
- By 2050
- 1,168,637 · +13.7%
- By 2075
- 1,265,188 · +23.1%
- By 2100
- 1,260,357 · +22.7%
Race, ethnicity, and origin ACS 2023
- Neighborhood character
- Predominantly White (72%)
- Race & ethnicity
- White 72% Hispanic / Latino 17% Two or more races 9% Black 4% Asian 2%
- Hispanic origin (detail)
- Mexican 5% Puerto Rican 3% Cuban 1%
- Common ancestry
- Romanian 3% Lithuanian 2% Slovak 2%
- Foreign-born
- 15% · Canada, Jamaica, Vietnam
- Languages at home
- 81% English-only · Spanish 10% Other Indo-European 3% Russian/Polish/Slavic 1%
Political lean MEDSL · Pinellas
- 2024 margin
- Lean R (+5.2) · D 46.9% · R 52.1%
- 2008→2024 swing
- -13.5pp toward R · 2008: 8.3pp · 2024: -5.2pp
- All cycles
- 2024: R+5.2 2020: D+0.2 2016: R+1.1 2012: D+5.6 2008: D+8.3
Not yet ingested
- Civics
- —
Market trends
- HPI YoY
- ▼ -439.90%
- Current HPI
- 265.3099
- Rent YoY
- ▼ -2.63%
- Metro
- Tampa-St. Petersburg-Clearwater, FL
- State GDP YoY
- ▲ 3.28%
- F500 in state
- 36
Industry mix (Fortune 500 HQ in FL)
| Industry | F500 HQs | Revenue |
|---|---|---|
| Industrial Technology | 2 | $29B |
|
||
| Insurance | 2 | $17B |
|
||
| Retail | 1 | $60B |
|
||
| Technology Distribution | 1 | $58B |
|
||
| Homebuilding | 1 | $35B |
|
||
| Technology Manufacturing | 1 | $35B |
|
||
Price history
+330.4% since first listed4 events — show timeline
- 2026-05-17 Listed $99,000 Stellar MLS as Distributed by MLS Grid
- 2022-07-06 Sold (Public Records) $65,000 Public Records
- 2005-05-23 Sold (Public Records) $45,000 Public Records
- 1985-12-01 Sold (Public Records) $23,000 Public Records
Property tax history
+9.7%/yrLatest (2025): $1,225 · +10.7% YoY. Source: county tax records.
Cash-flow waterfall
monthlySold comps — $/sqft
last 12 mo · ≤1 miLoading sold comps…