111 Dobson Heights Rd · Clifton, SC
Flood risk 1/10 · Minimal
- FEMA flood zone
- X (unshaded)
- Chance of flooding over 30 yrs
- 0.0%
- Est. flood insurance / yr
- $507 – $1,088
Fire risk 4/10 · Minor
- Est. fire insurance / yr
- $783 – $1,453
Heat risk 5/10 · Moderate
- Hot days now (above 105°F)
- 7 days/yr
- Hot days in 30 yrs
- 15 days/yr
Wind risk 2/10 · Minimal
- Chance of severe wind over 30 yrs
- 2.0%
Air-quality risk 4/10 · Minor
- Unhealthy air days now
- 4 days/yr
- Unhealthy air days in 30 yrs
- 4 days/yr
Risk factors via First Street. Map © Google.
Why this score? — see what drove the B- grade
The composite is a weighted blend of 9 inputs, each scored 0–100. Each bar is that input's sub-score; the figure is the points it added to the 100-point composite (weight × sub-score).
- Cash flow +30.0/30.0
- 1% rule +10.0/10.0
- DSCR +10.0/10.0
- ARV discount +7.5/15.0
- Schools +3.7/10.0
- Rent growth +2.7/5.0
- Condition / age +2.5/5.0
- Livability +2.4/5.0
- Appreciation +0.0/10.0
$59,900
🖨 Deal sheet (PDF) 📄 Offer letter ✓ Due diligence
Listing remarks
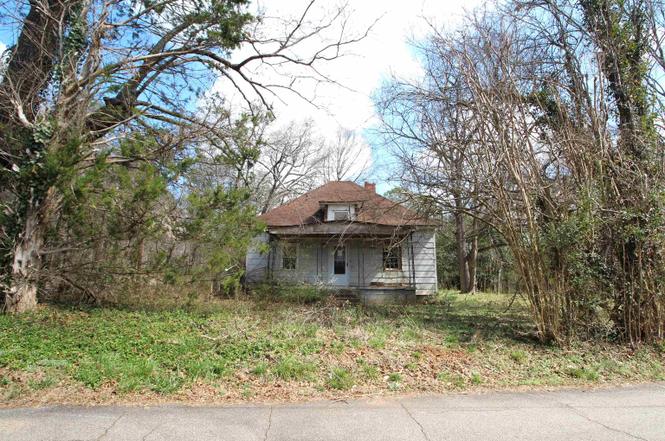
INVESTOR SPECIAL! PRICED ACCORDINGLY. Great opportunity for investors, builders, or those looking for a private homesite. Situated on 1.22 acres with no HOA, this property offers plenty of space and potential. The existing home has no value and is being sold AS-IS, making this an ideal redevelopment project. Enjoy the privacy of a wooded lot with room to build your vision while still being conveniently located near local amenities. Don’t miss this chance to secure acreage with endless possibilities!
Key facts
- Private homesite
- Wooded lot
- No hoa
Tags
Neighborhood map
What this means for you Summary
Snapshot
- This is a 2-bed/1.0-bath single-family listed at $60k.
Deal economics
- At list price, monthly cash flow is $564 ($7k/yr) — positive.
- The deal already cash-flows at list — no discount required.
- Meets the 1% rule at list price ($1k rent vs $60k).
Location & tenants
- Location reads 47/100 on livability (#377 in SC) — a working-class tenant base; expect higher turnover. Strengths: crime A, cost of living A; Watch: employment D, amenities F, commute F.
- Spartanburg 03 (suburban): math 39% / reading 49% proficiency, ranked #28 of 80 in SC (top 35%) — families likely to look elsewhere, expect single-tenant / working-renter base with shorter leases.
- Zoned schools: Cowpens Elementary (math 57% / reading 52%, grade C, #123 of 597 statewide, top 22%, 461 students, 100% FRL); Clifdale Middle (695 students, 78% FRL); Broome High (math 42% / reading 80%, grade C+, #105 of 196 statewide, top 54%, 825 students, 68% FRL) — zoned schools average 82% FRL vs 57% district-wide (25 pts higher); higher-poverty schools than district average — tighter screening recommended.
- Zoned-school proficiency averages 58% at this address vs 44% district-wide (+14 pts) — the actual schools serving this property are materially stronger than the Spartanburg 03 average implies; a family-tenant draw the district grade alone would hide.
- Market conditions: Rents flat; 275 active listings in the ZIP; 3 comparable units currently listed for rent nearby; rentals at typical pace (median 15d on market — plan ~3-4 weeks tenant-placement turnaround); 3,129 units permitted in Spartanburg County in 2024 (40 in 5+ unit buildings).
Forward outlook
- Local home prices are declining (-3.0%/yr); year-one equity from $414 of loan paydown is wiped out by about $2k of value loss. Plan a longer hold.
- Spartanburg County population projected at +18% by 2050 — long-run rental-demand tailwind backs the buy-and-hold thesis.
- At projected returns (-3.0% appreciation + 0.6% rent growth), your $17k cash investment doubles in ~4 years — after that, you're playing with house money.
Negotiation context
- Only 6 days on market — expect competitive offers; lowballing is unlikely to land.
Risks & watch-outs
- Watch-outs: built in 1880 — expect roof / HVAC / electrical / plumbing capex.
- Climate carrying-cost: extreme-heat days projected 7→15/yr by 2055 (HVAC capex compounding) — expect insurance premiums to compound above CPI over the hold.
Questions for the listing agent
- Built in 1880 — when were the roof, HVAC, electrical panel, plumbing, and water heater last replaced?
- Is there a deadline driving the sale (1031 exchange, divorce, estate, relocation)? That informs how much negotiation room exists.
- Schools are F-rated, which usually means shorter tenancies and higher turnover. Who's the typical renter profile here, and what's been the actual vacancy rate?
- What's the average days-on-market for RENTAL listings here right now (not sales)? A rising rental-DOM trend means longer vacancies and softer asking-rent achievability than the comps imply.
- What's the recent tenant-quality profile in this submarket — average credit score on applications, eviction rate, late-payment / NSF rate, and stable-employment percentage? A property-management company in the area should have these aggregated.
- How much new for-sale + rental construction is in the pipeline within 1–3 miles? Heavy new supply typically softens prices + rents 12–24 months out; constrained supply supports both.
Investment metrics
- 1% rule
- 2.11% ✓
- Cap rate
- 17.58%
- Cash-on-cash
- 40.32%
- DSCR
- 2.79
- GRM
- 3.9
CMA / ARV
- ARV (on-the-fly)
- $198,044
- Comps found
- 4
Show comp detail 4 sales within ~0.75 mi
| Address | Dist | Beds/Ba | Sqft | Sold | Price | $/sf | Match |
|---|---|---|---|---|---|---|---|
| 140 Gardner Rd Rd | 0.21mi | 3/1.0 (+1) | 1,336 (+4%) | 23mo | $156,000 | $117 | 59 |
| 610 Coopertown Road Rd | 0.35mi | 3/2.0 (+1) | 1,235 (-4%) | 17mo | $189,900 | $154 | 54 |
| 4891 S Main St | 0.62mi | 1/1.0 (-1) | 1,224 (-5%) | 6mo | $500,000 | $408 | 53 |
| 107 Cowpens Line Rd | 0.74mi | 3/2.5 (+1) | 1,319 (+3%) | 18mo | $192,000 | $146 | 36 |
Match score weights: distance 35% · size 25% · config 20% · recency 20%. Top-matched comps best support the ARV.
Projected returns pro-forma
-3.0% appreciation · 0.64% rent growth · sell at horizon
- IRR
- 34.0%
- Equity multiple
- 2.39×
- Total profit
- $23,284
- Equity at exit
- $8,931
- IRR
- 39.6%
- Equity multiple
- 4.29×
- Total profit
- $55,141
- Equity at exit
- $5,179
Cash invested: $16,772 (down + closing). Projections, not guarantees.
Landlord ↔ Tenant lean methodology
- Overall (STATE)
- 90 Strongly Landlord-Friendly
- State South Carolina
- 90 Strongly Landlord-Friendly · R+6
- County
- — inherits STATE
- City
- — inherits STATE
ZIP-level market 29307
- Home prices YoY
- -17.7%
- Rents YoY
- 0.6%
- Active inventory
- 275
- Price-to-rent
- 3.9×
Monthly cashflow live
- Estimated rent
- $1,264 medium interval (Pro) →
- Mortgage (P&I)
- −$314
- Tax from tax record
- −$96 /mo · $1,155/yr
- Insurance
- −$25
- HOA
- −$0
- Vacancy / Maint / Mgmt
- −$266
- Net cashflow
- $564
Break-even live
Sensitivity live
| Price | -10% $597 | -5% $580 | +0% $564 | +5% $547 | +10% $530 |
|---|---|---|---|---|---|
| Rent | -10% $464 | -5% $514 | +0% $564 | +5% $613 | +10% $663 |
| Rate | -1.0pp $594 | -0.5pp $579 | base $564 | +0.5pp $548 | +1.0pp $532 |
UW: 25.0% down · 7.5% · 30yr · 1.5% tax · 5.0% vac · 8.0% maint · 8.0% mgmt
Financing live
Cash to close
- Down payment
- $14,975
- Closing costs
- $1,797
- Reserves months
- —
- Total cash needed
- —
Loan-product check · same deal, 3 products live
Conventional
25% down · 7.5% · 30yr
- Down + closing
- —
- Monthly P&I
- —
- Monthly cashflow
- —
- DSCR
- —
- Eligible?
- —
Personal DTI + credit; lowest rate.
DSCR
20% down · 8.5% · 30yr
- Down + closing
- —
- Monthly P&I
- —
- Monthly cashflow
- —
- DSCR
- —
- Eligible?
- —
No personal income docs; deal must DSCR.
Hard money
10% down · 12.0% · 12mo
- Down + closing
- —
- Monthly P&I
- —
- Monthly cashflow
- —
- DSCR
- —
- Eligible?
- —
Short-term bridge; refi at stabilization.
Rent comps 3 comps
| Address | Beds | Baths | Sqft | Rent | $/sqft | DOM | Units | Dist |
|---|---|---|---|---|---|---|---|---|
| 112 Goldmine Rd Unit A Spartanburg, SC | 2.0 | 1.5 | 970 | $1,185 | $1.22 | 22d | 1 | 0.79mi |
| 112 Goldmine Rd Unit D Spartanburg, SC | 2.0 | 1.5 | 970 | $1,175 | $1.21 | 15d | 1 | 1.06mi |
| 4147 E Main Street Ext Spartanburg, SC | 1.0–2.0 | 1.0–2.0 | 1251 | $1,515 | $1.21 | 15d | 5 | 1.48mi |
Listing history 2 events
-
2026-03-12status Pending
-
2026-03-06$59,900 Active
ⓘ Source: listings_history table (triggers on properties + properties_extension) + one-shot
backfill from property_details.listing_events for pre-trigger history.
Tax reassessment forecast SC · Resets to sale price
- Current annual tax
- $1,155 · $96/mo
- Projected year-2 tax
- $1,155 · $96/mo
- Expected delta
- $0/yr ($0/mo · 0.0%)
ⓘ Screening estimate from a state-policy table — verify with the county assessor before closing.
Climate risk First Street
- Flood 1/10 Low FEMA zone X (unshaded) · 0% chance over 30 yrs
- Wildfire 4/10 Moderate
- Heat 5/10 Major 7 d/yr ≥105°F today · 15 d/yr by 30 yrs out
- Wind 2/10 Low 2% chance of damaging wind over 30 yrs
- Air quality 4/10 Moderate 4 unhealthy d/yr today · 4 by 30 yrs out
Nearby sold comps map
Loading sold comps map…
Walkable amenities ~0.75 mi
Loading nearby amenities…
Taxation est. · year 1
- Rental income
- $15,173
- − Mortgage interest
- −$3,355
- − Property taxes
- −$1,155
- − Insurance
- −$300
- − Repairs & maintenance
- −$1,214
- − Management
- −$1,214
- − Depreciation
- −$1,743
- Taxable income
- $6,193
- Est. tax owed @ 24.0%
- −$1,486
- After-tax cash flow
- $5,276/yr
For passive investors: Depreciation is non-cash, so a rental often shows a tax loss while cash-flowing — sheltering income. Rental losses are passive: they offset passive income freely, and up to $25,000/yr can offset ordinary (W-2) income if you actively participate and your MAGI is under $100k (phasing out to $0 by $150k); unused losses carry forward. On sale, claimed depreciation is recaptured at up to 25%, and gains may owe capital-gains tax (a 1031 exchange can defer both). Figures are a year-1 estimate at your 24.0% rate — not tax advice; consult a CPA.
Schools (NCES district)
- District
- Spartanburg 03
- NCES district ID
- 4503540
- Math proficiency
- 39% ▼ -5.00%
- Reading proficiency
- 49% ▲ 6.00%
- Median HH income
- $36,898
- Composite
- 36.52/100
- National rank
- #4645
- State rank
- #28 of 80 in SC
Livability — Clifton
- Score
- 47/100
- State rank
- #377
- US rank
- #26274
Category grades
Schools grade is shown separately in the Schools card above.
Census & demographics
- County
- Spartanburg County · 258,607 people
- City population
- 70
- Metro
- Spartanburg, SC
- Population (ZIP)
- 19,115
- Household income
- $65,850
- Rent vs Own
- Severe rent burden
- 438.0
Population outlook (Spartanburg County) Hauer SSP2
- Today (2025)
- 325,495 people
- By 2030
- 338,800 · +4.1%
- By 2040
- 363,471 · +11.7%
- By 2050
- 384,156 · +18.0%
- By 2075
- 430,137 · +32.1%
- By 2100
- 442,733 · +36.0%
Race, ethnicity, and origin ACS 2023
- Neighborhood character
- Predominantly White (74%)
- Race & ethnicity
- White 74% Black 20% Two or more races 4% Hispanic / Latino 3%
- Common ancestry
- Serbian 4% Slovak 2% Romanian 1%
- Foreign-born
- 4% · Canada, Jamaica
- Languages at home
- 91% English-only · Spanish 5% Russian/Polish/Slavic 1% Other Indo-European 1%
Political lean MEDSL · Spartanburg
- 2024 margin
- Solid R (+33.6) · D 32.6% · R 66.2% · Other 1.2%
- 2008→2024 swing
- -12.0pp toward R · 2008: -21.6pp · 2024: -33.6pp
- All cycles
- 2024: R+33.6 2020: R+27.3 2016: R+30.0 2012: R+23.1 2008: R+21.6
Not yet ingested
- Civics
- —
Market trends
- HPI YoY
- ▼ -52.58%
- Current HPI
- 244.9855
- Rent YoY
- ▲ 0.64%
- Metro
- Spartanburg, SC
- State GDP YoY
- ▲ 4.51%
- F500 in state
- 2
Industry mix (Fortune 500 HQ in SC)
| Industry | F500 HQs | Revenue |
|---|---|---|
| Packaging | 1 | $7B |
|
||
Price history
2 events — show timeline
- 2026-03-12 Pending — SPMLS
- 2026-03-06 Listed $59,900 SPMLS
Property tax history
+2.9%/yrLatest (2025): $1,155 · +1.1% YoY. Source: county tax records.
Cash-flow waterfall
monthlySold comps — $/sqft
last 12 mo · ≤1 miLoading sold comps…