5460 Missouri Ave · Jacksonville, FL
Flood risk 5/10 · Moderate
- FEMA flood zone
- AE
- Chance of flooding over 30 yrs
- 0.24%
- Est. flood insurance / yr
- $1,737 – $8,500
Fire risk 4/10 · Minor
- Est. fire insurance / yr
- $947 – $1,759
Heat risk 8/10 · Major
- Hot days now (above 107°F)
- 6 days/yr
- Hot days in 30 yrs
- 17 days/yr
Wind risk 9/10 · Severe
- Chance of severe wind over 30 yrs
- 99.0%
Air-quality risk 4/10 · Minor
- Unhealthy air days now
- 6 days/yr
- Unhealthy air days in 30 yrs
- 6 days/yr
Risk factors via First Street. Map © Google.
Why this score? — see what drove the F grade
The composite is a weighted blend of 9 inputs, each scored 0–100. Each bar is that input's sub-score; the figure is the points it added to the 100-point composite (weight × sub-score).
- ARV discount +7.5/15.0
- Appreciation +6.7/10.0
- Cash flow +5.7/30.0
- Livability +4.2/5.0
- Schools +3.9/10.0
- Rent growth +2.9/5.0
- Condition / age +2.5/5.0
- 1% rule +1.2/10.0
- DSCR +0.1/10.0
$249,000
🖨 Deal sheet (PDF) 📄 Offer letter ✓ Due diligence
Listing remarks MLS
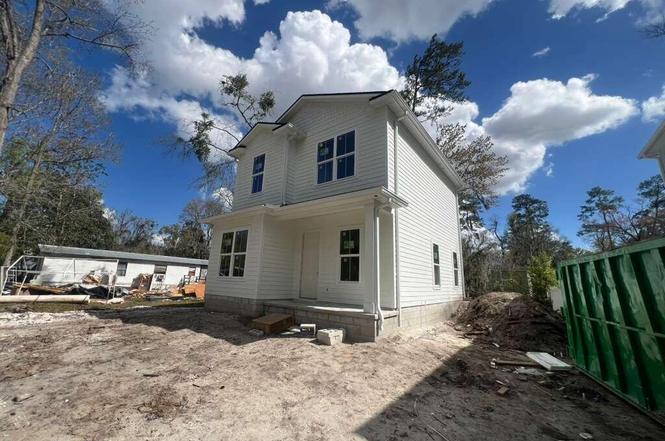
Great fixer upper investor property. Needs rehab. 3/1 with new stucco exterior. Big lot. Property to be sold 'as-is', Seller to make no repairs. Make an offer!
Key facts
- 5,227 sq ft lot
- Built 2026
- Listed 154 days
Property features AI
Finance
- HOA & community: Not a senior community
Exterior
- Parking: Other/unassigned parking
- Security: Smoke detector(s)
- Utilities: Public sewer; Cable available; Electricity available; Water available
- Home design: Single family residence; Two levels; Entry level is 1; Home faces north; Property attached
- Exterior features: Asphalt road access; No private pool
Interior
- Kitchen: Electric range; Microwave; Refrigerator
- Bedrooms: Four bedrooms (Bedroom 2 on first level; Bedrooms 3 and 4 on second level)
- Bathrooms: Three full bathrooms
- Heating & cooling: Central heating; Central air conditioning
- Interior features: Smoke detector(s); Ten total rooms
- Laundry & utility: Unfurnished unit (no washer/dryer specified)
Neighborhood map
What this means for you Summary
Snapshot
- This is a 4-bed/3.0-bath land listed at $249k.
Deal economics
- At list price, monthly cash flow is $-934 ($-11k/yr) — negative.
- To cash-flow at today's rent, offer at most $114k (54.3% below list).
- To meet the 1% rule (rent ≥ 1% of price), the offer needs to be $154k (38.3% below list).
- Recommended offer: $114k (54.3% below list) — sets the bar for cash-flow.
Location & tenants
- Location reads 83/100 on livability (#50 in FL, #911 nationally) — a professional / high-income tenant draw. Strengths: amenities A+, commute A+, housing A+.
- Duval (urban): math 46% / reading 45% proficiency, ranked #48 of 73 in FL (top 66%) — families likely to look elsewhere, expect single-tenant / working-renter base with shorter leases.
- Zoned schools: Pickett Elementary School (math 57% / reading 37%, grade D-, #1,191 of 2,144 statewide, top 57%, 200 students, 73% FRL); Jean Ribault Middle School (math 28% / reading 24%, grade F, #506 of 571 statewide, top 89%, 679 students, 78% FRL); Jean Ribault High School (math 22% / reading 25%, grade F, #533 of 667 statewide, top 80%, 1,385 students, 71% FRL) — zoned schools average 74% FRL vs 49% district-wide (24 pts higher); higher-poverty schools than district average — tighter screening recommended.
- Zoned-school proficiency averages 32% at this address vs 46% district-wide (-13 pts) — the specific schools serving this property underperform the Duval average; the district grade overstates school quality for this exact location.
- Market conditions: Rents rising (+1.7%/yr); 173 active listings in the ZIP; 8 comparable units currently listed for rent nearby; rentals at typical pace (median 26d on market — plan ~3-4 weeks tenant-placement turnaround); lower-income renter base — watch delinquency; 6,503 units permitted in Duval County in 2024 (1,131 in 5+ unit buildings).
Forward outlook
- In year one you build about $10k of equity ($2k loan paydown + $8k appreciation (3.4% local appreciation)).
- Duval County population projected at +19% by 2050 — long-run rental-demand tailwind backs the buy-and-hold thesis.
- By year 4, paydown + projected appreciation supports a ~$35k cash-out refi (75% LTV) — recoverable capital for the next deal without selling this one.
Negotiation context
- It's been on market 155 days — a 12% lower offer ($219k) is reasonable based on typical stale-listing flexibility.
- 2 sale attempts since 16y ago with the ask held roughly flat each time — persistent listings suggest the price (not the market) is what's stuck; bring a comps-based counter.
- Current owner paid $13k; list at $249k implies a 1815% gain — meaningful room to come down on a strong offer.
Risks & watch-outs
- Watch-outs: flood insurance adds $427/mo.
- Climate carrying-cost: in FEMA flood zone AE (mandatory federal flood insurance); severe wind risk, 99% chance of damaging wind over 30y; extreme-heat days projected 6→17/yr by 2055 (HVAC capex compounding) — expect insurance premiums to compound above CPI over the hold.
Questions for the listing agent
- What do current leases actually rent for vs. the listed asking? Can we see a recent rent roll and the last 12 months of T-12 income?
- It's been on market 155 days. Have you received any prior offers? Is the seller open to a 54% concession, seller financing, or rate buy-down credit?
- What's the actual annual flood-insurance premium (NFIP or private), and is the property in a SFHA with mandatory coverage?
- Why hasn't it sold? Are there any deal-killer items the seller is aware of (foundation, flood, title, zoning, code violations)?
- Is there a deadline driving the sale (1031 exchange, divorce, estate, relocation)? That informs how much negotiation room exists.
- Schools are B-rated — typically a magnet for longer-tenancy family renters. What's the average tenant stay here, and is there a school-zone premium baked into asking?
- The area grade is low — what's the realistic commute time and amenity access for the typical tenant pool here? Any planned neighborhood developments (good or bad) we should know about?
- What's the average days-on-market for RENTAL listings here right now (not sales)? A rising rental-DOM trend means longer vacancies and softer asking-rent achievability than the comps imply.
- What's the recent tenant-quality profile in this submarket — average credit score on applications, eviction rate, late-payment / NSF rate, and stable-employment percentage? A property-management company in the area should have these aggregated.
- How much new for-sale + rental construction is in the pipeline within 1–3 miles? Heavy new supply typically softens prices + rents 12–24 months out; constrained supply supports both.
Investment metrics
- 1% rule
- 0.62% ✗
- Cap rate
- 3.85%
- Cash-on-cash
- -8.73%
- DSCR
- 0.61
- GRM
- 13.5
CMA / ARV
No comps found within radius.
Projected returns pro-forma
3.41% appreciation · 1.7% rent growth · sell at horizon
- IRR
- -6.2%
- Equity multiple
- 0.63×
- Total profit
- $-25,704
- Equity at exit
- $117,794
- IRR
- -1.5%
- Equity multiple
- 0.76×
- Total profit
- $-16,980
- Equity at exit
- $186,205
Cash invested: $69,720 (down + closing). Projections, not guarantees.
Landlord ↔ Tenant lean methodology
- Overall (STATE)
- 87 Strongly Landlord-Friendly
- State Florida
- 87 Strongly Landlord-Friendly · R+3
- County
- — inherits STATE
- City
- — inherits STATE
ZIP-level market 32254
- Home prices YoY
- 1.2%
- Rents YoY
- 1.7%
- Active inventory
- 173
- Price-to-rent
- 13.5×
Monthly cashflow live
- Estimated rent
- $1,536 high interval (Pro) →
- Mortgage (P&I)
- −$1,306
- Tax est. 1.5%
- −$311 /mo · $3,735/yr
- Insurance
- −$104
- Flood insurance flood zone
- −$427 /mo · $5,118/yr
- HOA
- −$0
- Vacancy / Maint / Mgmt
- −$323
- Net cashflow
- $-934
Break-even live
Sensitivity live
| Price | -10% $-762 | -5% $-848 | +0% $-934 | +5% $-1,020 | +10% $-1,106 |
|---|---|---|---|---|---|
| Rent | -10% $-1,055 | -5% $-995 | +0% $-934 | +5% $-873 | +10% $-813 |
| Rate | -1.0pp $-809 | -0.5pp $-871 | base $-934 | +0.5pp $-998 | +1.0pp $-1,064 |
UW: 25.0% down · 7.5% · 30yr · 1.5% tax · 5.0% vac · 8.0% maint · 8.0% mgmt
Financing live
Cash to close
- Down payment
- $62,250
- Closing costs
- $7,470
- Reserves months
- —
- Total cash needed
- —
Loan-product check · same deal, 3 products live
Conventional
25% down · 7.5% · 30yr
- Down + closing
- —
- Monthly P&I
- —
- Monthly cashflow
- —
- DSCR
- —
- Eligible?
- —
Personal DTI + credit; lowest rate.
DSCR
20% down · 8.5% · 30yr
- Down + closing
- —
- Monthly P&I
- —
- Monthly cashflow
- —
- DSCR
- —
- Eligible?
- —
No personal income docs; deal must DSCR.
Hard money
10% down · 12.0% · 12mo
- Down + closing
- —
- Monthly P&I
- —
- Monthly cashflow
- —
- DSCR
- —
- Eligible?
- —
Short-term bridge; refi at stabilization.
Rent comps 8 comps
| Address | Beds | Baths | Sqft | Rent | $/sqft | DOM | Units | Dist |
|---|---|---|---|---|---|---|---|---|
| 5239 Potomac Ave Jacksonville, FL | 3.0 | 2.0 | 1392 | $1,432 | $1.03 | 9d | 1 | 0.30mi |
| 5141 Shenandoah Ave Jacksonville, FL | 1.0–3.0 | 1.0–2.0 | 950 | $1,200 | $1.26 | 3d | 4 | 0.38mi |
| 3078 W 15th St Jacksonville, FL | 3.0 | 1.0 | 1128 | $1,200 | $1.06 | 25d | 1 | 1.23mi |
| 6412 New Kings Rd Unit 2 Jacksonville, FL | 3.0 | 2.0 | 1300 | $1,400 | $1.08 | 19d | 1 | 1.30mi |
| 3004 W 16th St Unit 1 Jacksonville, FL | 3.0 | 2.0 | 1456 | $1,526 | $1.05 | 25d | 1 | 1.30mi |
| 6718 Gaspar Cir W Jacksonville, FL | 3.0 | 2.0 | 1068 | $1,305 | $1.22 | 25d | 1 | 1.39mi |
| 6705 Gaspar Cir E Jacksonville, FL | 3.0 | 1.5 | 1116 | $1,254 | $1.12 | 19d | 1 | 1.42mi |
| 2939 W 11th St Jacksonville, FL | 3.0 | 1.0 | 1086 | $1,295 | $1.19 | 25d | 1 | 1.48mi |
Listing history 18 events
-
2026-06-21days on market $249,000 Active 155 DOM
-
2026-06-18days on market $249,000 Active 152 DOM
-
2026-06-17days on market $249,000 Active 151 DOM
-
2026-06-16days on market $249,000 Active 150 DOM
-
2026-06-15days on market $249,000 Active 149 DOM
-
2026-06-10days on market $249,000 Active 143 DOM
-
2026-06-08days on market $249,000 Active 142 DOM
-
2026-06-08days on market $249,000 Active 141 DOM
-
2026-06-03days on market $249,000 Active 137 DOM
-
2026-06-02days on market $249,000 Active 136 DOM
-
2026-06-01days on market $249,000 Active 135 DOM
-
2026-05-31days on market $249,000 Active 134 DOM
-
2026-05-07price $249,900
-
2026-04-14price $258,000
-
2025-12-09$260,000 Active
-
2010-11-16soldstatus $13,000 163-char remark
Show marketing remark (163 chars)
Great fixer upper investor property. Needs rehab. 3/1 with new stucco exterior. Big lot. Property to be sold 'as-is', Seller to make no repairs. Make an offer!
-
2010-05-07$13,900 163-char remark
Show marketing remark (163 chars)
Great fixer upper investor property. Needs rehab. 3/1 with new stucco exterior. Big lot. Property to be sold 'as-is', Seller to make no repairs. Make an offer!
-
2003-12-22soldstatus $71,000
ⓘ Source: listings_history table (triggers on properties + properties_extension) + one-shot
backfill from property_details.listing_events for pre-trigger history.
Climate risk First Street
- Flood 5/10 Major FEMA zone AE · 24% chance over 30 yrs
- Wildfire 4/10 Moderate
- Heat 8/10 Severe 6 d/yr ≥107°F today · 17 d/yr by 30 yrs out
- Wind 9/10 Extreme 99% chance of damaging wind over 30 yrs
- Air quality 4/10 Moderate 6 unhealthy d/yr today · 6 by 30 yrs out
Nearby sold comps map
Loading sold comps map…
Walkable amenities ~0.75 mi
Loading nearby amenities…
Taxation est. · year 1
- Rental income
- $18,431
- − Mortgage interest
- −$13,948
- − Property taxes
- −$3,735
- − Insurance
- −$6,364
- − Repairs & maintenance
- −$1,474
- − Management
- −$1,474
- − Depreciation
- −$7,244
- Taxable loss
- −$15,808
- Est. tax savings @ 24.0%
- +$3,794
- After-tax cash flow
- $-7,413/yr
For passive investors: Depreciation is non-cash, so a rental often shows a tax loss while cash-flowing — sheltering income. Rental losses are passive: they offset passive income freely, and up to $25,000/yr can offset ordinary (W-2) income if you actively participate and your MAGI is under $100k (phasing out to $0 by $150k); unused losses carry forward. On sale, claimed depreciation is recaptured at up to 25%, and gains may owe capital-gains tax (a 1031 exchange can defer both). Figures are a year-1 estimate at your 24.0% rate — not tax advice; consult a CPA.
Schools (NCES district)
- District
- Duval
- NCES district ID
- 1200480
- Math proficiency
- 46% ▼ -11.00%
- Reading proficiency
- 45% ▼ -4.00%
- Median HH income
- $48,987
- Composite
- 38.97/100
- National rank
- #4076
- State rank
- #48 of 73 in FL
Livability — Jacksonville
- Score
- 83/100
- State rank
- #50
- US rank
- #911
Category grades
Schools grade is shown separately in the Schools card above.
Census & demographics
- Census place
- Jacksonville, FL
- County
- Duval County · 1,015,274 people
- City population
- 979,034
- Metro
- Jacksonville, FL
- Population (ZIP)
- 13,927
- Household income
- $34,953
- Rent vs Own
- Severe rent burden
- 882.0
Population outlook (Duval County) Hauer SSP2
- Today (2025)
- 1,013,010 people
- By 2030
- 1,059,228 · +4.6%
- By 2040
- 1,141,439 · +12.7%
- By 2050
- 1,205,258 · +19.0%
- By 2075
- 1,324,282 · +30.7%
- By 2100
- 1,319,620 · +30.3%
Race, ethnicity, and origin ACS 2023
- Neighborhood character
- Diverse neighborhood (Simpson 0.56)
- Race & ethnicity
- Black 60% White 28% Two or more races 7% Hispanic / Latino 5%
- Hispanic origin (detail)
- Puerto Rican 1%
- Common ancestry
- Slovak 1% Hispanic 1% Lithuanian 1%
- Foreign-born
- 4% · Canada
- Languages at home
- 94% English-only · Spanish 4% French/Haitian/Cajun 2%
Political lean MEDSL · Duval
- 2024 margin
- Toss-up / Even · D 48.7% · R 50.1% · Other 1.2%
- 2008→2024 swing
- +0.4pp no change · 2008: -1.9pp · 2024: -1.5pp
- All cycles
- 2024: R+1.5 2020: D+3.8 2016: R+1.5 2012: R+3.6 2008: R+1.9
Not yet ingested
- Civics
- —
Market trends
- HPI YoY
- ▲ 3.41%
- Current HPI
- 282.2981
- Rent YoY
- ▲ 1.70%
- Metro
- Jacksonville, FL
- State GDP YoY
- ▲ 3.28%
- F500 in state
- 36
Industry mix (Fortune 500 HQ in FL)
| Industry | F500 HQs | Revenue |
|---|---|---|
| Industrial Technology | 2 | $29B |
|
||
| Insurance | 2 | $17B |
|
||
| Retail | 1 | $60B |
|
||
| Technology Distribution | 1 | $58B |
|
||
| Homebuilding | 1 | $35B |
|
||
| Technology Manufacturing | 1 | $35B |
|
||
Price history
+252.0% since first listed6 events — show timeline
- 2026-05-07 Price Changed $249,900 realMLS
- 2026-04-14 Price Changed $258,000 realMLS
- 2025-12-09 Listed $260,000 realMLS
- 2010-11-16 Sold (MLS) $13,000 realMLS
- 2010-05-07 Listed $13,900 realMLS
- 2003-12-22 Sold (Public Records) $71,000 Public Records
Property tax history
-8.6%/yrLatest (2025): $451 · +14.8% YoY. Source: county tax records.
Cash-flow waterfall
monthlySold comps — $/sqft
last 12 mo · ≤1 miLoading sold comps…