1010 Palm Canyon Dr #32 · Borrego Springs, CA
Flood risk 4/10 · Minor
- FEMA flood zone
- AO
- Chance of flooding over 30 yrs
- 0.21%
- Est. flood insurance / yr
- $848 – $2,087
Fire risk 4/10 · Minor
- Est. fire insurance / yr
- $659 – $1,223
Heat risk 9/10 · Severe
- Hot days now (above 112°F)
- 7 days/yr
- Hot days in 30 yrs
- 19 days/yr
Wind risk 1/10 · Minimal
- Chance of severe wind over 30 yrs
- —
Air-quality risk 3/10 · Minor
- Unhealthy air days now
- 3 days/yr
- Unhealthy air days in 30 yrs
- 4 days/yr
Risk factors via First Street. Map © Google.
Why this score? — see what drove the C- grade
The composite is a weighted blend of 9 inputs, each scored 0–100. Each bar is that input's sub-score; the figure is the points it added to the 100-point composite (weight × sub-score).
- Cash flow +15.0/30.0
- ARV discount +15.0/15.0
- 1% rule +5.0/10.0
- DSCR +5.0/10.0
- Livability +2.9/5.0
- Schools +2.6/10.0
- Rent growth +2.5/5.0
- Condition / age +2.2/5.0
- Appreciation +0.0/10.0
$51,000
🖨 Deal sheet 📄 Offer letter ✓ Due diligence
Listing remarks MLS
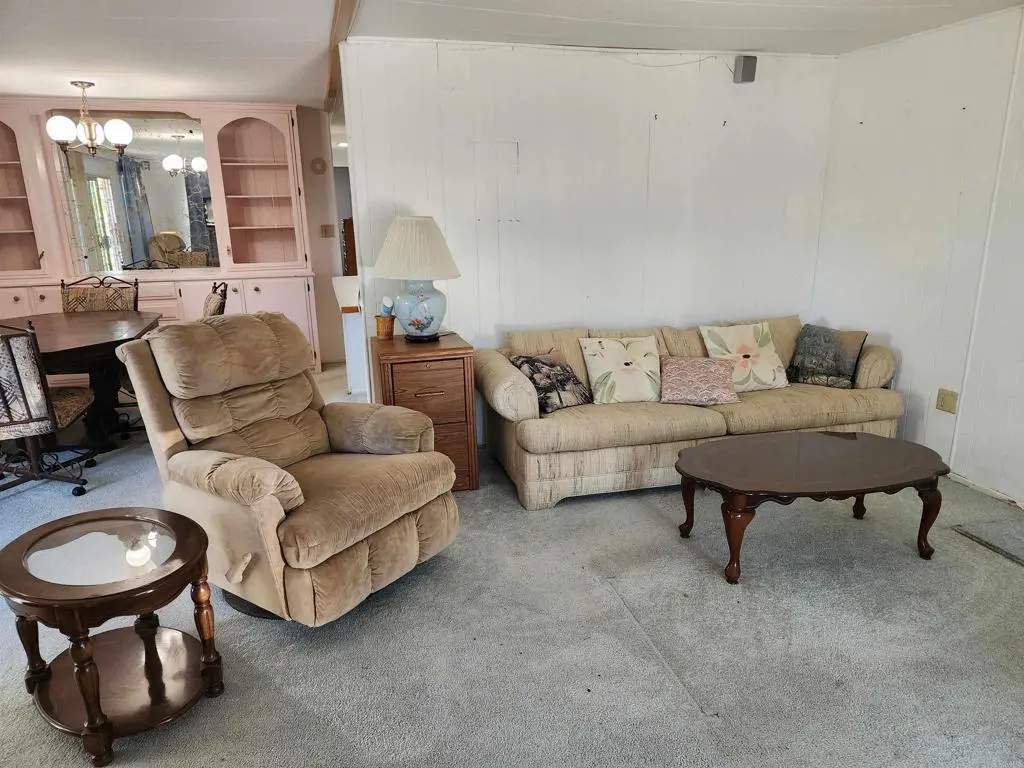
Financing available. 2 BR, 2 BATH and BONUS ROOM!!! At the beautiful Roadrunner Golf & Country Club including golf, heated pool, jacuzzi, tennis pickle ball courts, and club house. This retro manufactured home boasts a large living room for entertainment. Culd-e-sac unit with enclosed 10x20 bonus room addition. Electric fireplace adds ambiance to toasty Borrego evenings! Pink vintage kitchen with coordinating dinette cabinetry. Poker table, exercise equipment. Carport parking. Upgraded cemented shed ($8,000 upgrade!) bench art studio. Central air. Beautiful front yard with palm tree.
Key facts
- Pickle ball courts
- Tennis courts
- Large living room
Tags
Neighborhood map
What this means for you Summary
Snapshot
- This is a 2-bed/2.0-bath manufactured listed at $51k. Condition is rated fair.
Deal economics
- At list price, monthly cash flow is $1k ($18k/yr) — positive.
- The deal already cash-flows at list — no discount required.
- Meets the 1% rule at list price ($2k rent vs $51k).
- Recommended offer: $45k (12.0% below list) — sets the bar for market timing.
- Cap rate 43.5% vs local median 6.0% in Borrego Springs — top-decile yield for the area; either an underpriced asset or a hidden risk that comps aren't pricing in. Stress-test before assuming the spread holds.
Location & tenants
- Location reads 58/100 on livability (#712 in CA) — a working-class tenant base; expect higher turnover. Strengths: crime A+, employment A+, housing A+; Watch: schools F, amenities F, commute F.
- Borrego Springs Unified (rural): math 20% / reading 35% proficiency, ranked #1,120 of 1,400 in CA (top 80%) — low school quality limits family demand, transient renter base, plan for 1-2y turnover; 72% free/reduced lunch — lower-income household profile, screen leases tightly.
- Market conditions: 174 active listings in the ZIP; 11,759 units permitted in San Diego County in 2024 (7,244 in 5+ unit buildings).
Forward outlook
- Local home prices are declining (-3.0%/yr); year-one equity from $353 of loan paydown is wiped out by about $2k of value loss. Plan a longer hold.
- San Diego County population projected at +20% by 2050 — long-run rental-demand tailwind backs the buy-and-hold thesis.
- At projected returns (-3.0% appreciation + 3.0% rent growth), your $14k cash investment doubles in ~1 year — after that, you're playing with house money.
Negotiation context
- It's been on market 131 days — a 12% lower offer ($45k) is reasonable based on typical stale-listing flexibility.
- 3 sale attempts; this cycle's ask has dropped $8k (13%) from the opening price — seller is motivated, your offer sets the floor, not the list.
Risks & watch-outs
- Watch-outs: flood insurance adds $122/mo.
- Climate carrying-cost: in FEMA flood zone AO (mandatory federal flood insurance); extreme-heat days projected 7→19/yr by 2055 (HVAC capex compounding) — expect insurance premiums to compound above CPI over the hold.
Questions for the listing agent
- It's been on market 131 days. Have you received any prior offers? Is the seller open to a 12% concession, seller financing, or rate buy-down credit?
- Have any recent inspections been done? Can we get a copy of the seller's disclosures and any deferred-maintenance estimates?
- Built in 1970 — when were the roof, HVAC, electrical panel, plumbing, and water heater last replaced?
- What's the actual annual flood-insurance premium (NFIP or private), and is the property in a SFHA with mandatory coverage?
- Why hasn't it sold? Are there any deal-killer items the seller is aware of (foundation, flood, title, zoning, code violations)?
- Is there a deadline driving the sale (1031 exchange, divorce, estate, relocation)? That informs how much negotiation room exists.
- Schools are F-rated, which usually means shorter tenancies and higher turnover. Who's the typical renter profile here, and what's been the actual vacancy rate?
- What's the average days-on-market for RENTAL listings here right now (not sales)? A rising rental-DOM trend means longer vacancies and softer asking-rent achievability than the comps imply.
- What's the recent tenant-quality profile in this submarket — average credit score on applications, eviction rate, late-payment / NSF rate, and stable-employment percentage? A property-management company in the area should have these aggregated.
- How much new for-sale + rental construction is in the pipeline within 1–3 miles? Heavy new supply typically softens prices + rents 12–24 months out; constrained supply supports both.
Investment metrics
- 1% rule
- 4.80% ✓
- Cap rate
- 43.52%
- Cash-on-cash
- 132.96%
- DSCR
- 6.92
- GRM
- 1.7
CMA / ARV
- ARV (median comp)
- $78,817
- List price
- $51,000
- Delta
- -35.29%
- Verdict
- UNDERPRICED
- Comps
- 15 within 1.0 mi
Show comp detail 7 sales within ~0.75 mi
| Address | Dist | Beds/Ba | Sqft | Sold | Price | $/sf | Match |
|---|---|---|---|---|---|---|---|
| 1010 Palm Canyon Dr #59 | 0.00mi | 2/2.0 | 1,152 (+3%) | 8mo | $75,000 | $65 | 89 |
| 1010 Palm Canyon Dr #291 | 0.00mi | 2/2.0 | 1,152 (+3%) | 18mo | $165,000 | $143 | 80 |
| 1010 Palm Canyon Dr #339 | 0.00mi | 2/2.0 | 1,248 (+11%) | 6mo | $140,000 | $112 | 76 |
| 1010 Palm Canyon Dr #12 | 0.28mi | 2/2.0 | 1,100 (-2%) | 17mo | $63,000 | $57 | 69 |
| 1010 Palm Cyn #305 | 0.28mi | 2/2.0 | 1,248 (+11%) | 8mo | $115,000 | $92 | 61 |
| 1010 Palm Canyon Dr #7 | 0.28mi | 2/2.0 | 960 (-14%) | 4mo | $60,000 | $63 | 60 |
| 1010 Palm Canyon Dr #11 | 0.28mi | 2/2.0 | 1,248 (+11%) | 13mo | $85,000 | $68 | 57 |
Match score weights: distance 35% · size 25% · config 20% · recency 20%. Top-matched comps best support the ARV.
Projected returns pro-forma
-3.0% appreciation · 3.0% rent growth · sell at horizon
- IRR
- —
- Equity multiple
- 6.94×
- Total profit
- $84,832
- Equity at exit
- $7,604
- IRR
- —
- Equity multiple
- 14.59×
- Total profit
- $194,058
- Equity at exit
- $4,410
Cash invested: $14,280 (down + closing). Projections, not guarantees.
Landlord ↔ Tenant lean methodology
- Overall (STATE)
- 18 Strongly Tenant-Friendly
- State California
- 18 Strongly Tenant-Friendly · D+13
- County
- — inherits STATE
- City
- — inherits STATE
ZIP-level market 92004
- Home prices YoY
- -18.4%
- Active inventory
- 174
- Price-to-rent
- 1.7×
Monthly cashflow live
- Estimated rent
- $2,449 medium interval (Pro) →
- Mortgage (P&I)
- −$267
- Tax est. 1.5%
- −$64 /mo · $765/yr
- Insurance
- −$21
- Flood insurance flood zone
- −$122 /mo · $1,468/yr
- HOA
- −$0
- Vacancy / Maint / Mgmt
- −$514
- Net cashflow
- $1,460
Break-even live
UW: 25.0% down · 7.5% · 30yr · 1.5% tax · 5.0% vac · 8.0% maint · 8.0% mgmt
Financing live
Cash to close
- Down payment
- $12,750
- Closing costs
- $1,530
- Reserves months
- —
- Total cash needed
- —
Loan-product check · same deal, 3 products live
Conventional
25% down · 7.5% · 30yr
- Down + closing
- —
- Monthly P&I
- —
- Monthly cashflow
- —
- DSCR
- —
- Eligible?
- —
Personal DTI + credit; lowest rate.
DSCR
20% down · 8.5% · 30yr
- Down + closing
- —
- Monthly P&I
- —
- Monthly cashflow
- —
- DSCR
- —
- Eligible?
- —
No personal income docs; deal must DSCR.
Hard money
10% down · 12.0% · 12mo
- Down + closing
- —
- Monthly P&I
- —
- Monthly cashflow
- —
- DSCR
- —
- Eligible?
- —
Short-term bridge; refi at stabilization.
Listing history 24 events
-
2026-06-19days on market $51,000 Active 131 DOM
-
2026-06-18days on market $51,000 Active 130 DOM
-
2026-06-17days on market $51,000 Active 129 DOM
-
2026-06-16days on market $51,000 Active 128 DOM
-
2026-06-15days on market $51,000 Active 127 DOM
-
2026-06-14days on market $51,000 Active 125 DOM
-
2026-06-12days on market $51,000 Active 124 DOM
-
2026-06-09days on market $51,000 Active 121 DOM
-
2026-06-08days on market $51,000 Active 120 DOM
-
2026-06-07days on market $51,000 Active 119 DOM
-
2026-06-07days on market $51,000 Active 118 DOM
-
2026-06-04days on market $51,000 Active 115 DOM
-
2026-06-02days on market $51,000 Active 114 DOM
-
2026-06-01days on market $51,000 Active 113 DOM
-
2026-05-31days on market $51,000 Active 112 DOM
-
2026-05-31days on market $51,000 Active 111 DOM
-
2026-04-28price $51,000 596-char remark
Show marketing remark (596 chars)
Financing available. 2 BR, 2 BATH and BONUS ROOM!!! At the beautiful Roadrunner Golf & Country Club including golf, heated pool, jacuzzi, tennis pickle ball courts, and club house. This retro manufactured home boasts a large living room for entertainment. Culd-e-sac unit with enclosed 10x20 bonus room addition. Electric fireplace adds ambiance to toasty Borrego evenings! Pink vintage kitchen with coordinating dinette cabinetry. Poker table, exercise equipment. Carport parking. Upgraded cemented shed ($8,000 upgrade!) bench art studio. Central air. Beautiful front yard with palm tree.
-
2026-02-08$58,888 Active 596-char remark
Show marketing remark (596 chars)
Financing available. 2 BR, 2 BATH and BONUS ROOM!!! At the beautiful Roadrunner Golf & Country Club including golf, heated pool, jacuzzi, tennis pickle ball courts, and club house. This retro manufactured home boasts a large living room for entertainment. Culd-e-sac unit with enclosed 10x20 bonus room addition. Electric fireplace adds ambiance to toasty Borrego evenings! Pink vintage kitchen with coordinating dinette cabinetry. Poker table, exercise equipment. Carport parking. Upgraded cemented shed ($8,000 upgrade!) bench art studio. Central air. Beautiful front yard with palm tree.
-
2026-02-03price $51,000
-
2026-02-03historical
-
2025-12-29price $56,000
-
2025-11-03$59,000 Active
-
2025-10-23$50,000 Active
-
2025-10-23historical
ⓘ Source: listings_history table (triggers on properties + properties_extension) + one-shot
backfill from property_details.listing_events for pre-trigger history.
Climate risk First Street
- Flood 4/10 Moderate FEMA zone AO · 21% chance over 30 yrs
- Wildfire 4/10 Moderate
- Heat 9/10 Extreme 7 d/yr ≥112°F today · 19 d/yr by 30 yrs out
- Wind 1/10 Low
- Air quality 3/10 Moderate 3 unhealthy d/yr today · 4 by 30 yrs out
Nearby sold comps map
Loading sold comps map…
Walkable amenities ~0.75 mi
Loading nearby amenities…
Taxation est. · year 1
- Rental income
- $29,388
- − Mortgage interest
- −$2,857
- − Property taxes
- −$765
- − Insurance
- −$1,723
- − Repairs & maintenance
- −$2,351
- − Management
- −$2,351
- − Depreciation
- −$1,484
- Taxable income
- $17,858
- Est. tax owed @ 24.0%
- −$4,286
- After-tax cash flow
- $13,233/yr
For passive investors: Depreciation is non-cash, so a rental often shows a tax loss while cash-flowing — sheltering income. Rental losses are passive: they offset passive income freely, and up to $25,000/yr can offset ordinary (W-2) income if you actively participate and your MAGI is under $100k (phasing out to $0 by $150k); unused losses carry forward. On sale, claimed depreciation is recaptured at up to 25%, and gains may owe capital-gains tax (a 1031 exchange can defer both). Figures are a year-1 estimate at your 24.0% rate — not tax advice; consult a CPA.
Condition & rehab AI · 12 photos
This manufactured home requires moderate renovations to update the dated kitchen and bathroom, and improve the exterior and interior aesthetics. Upgrades will significantly enhance its resale and rental value.
Repairs flagged
- Major kitchen cabinets — dated pink cabinets
- Major bathroom cabinets — dated pink cabinets
- Minor exterior siding — slight wear
Value-add opportunities
- Both paint interior walls — enhances curb appeal and interior aesthetics
- Both replace carpet — improves comfort and reduces maintenance
- Both update kitchen cabinets — modernizes the space and increases appeal
- Both update bathroom cabinets — modernizes the space and increases appeal
- Both landscaping — enhances curb appeal and creates a more inviting environment
Renovation cost estimate screening
| Repair item | Severity | Est. cost |
|---|---|---|
| kitchen cabinets · dated pink cabinets | Major | $15,000–50,000 |
| bathroom cabinets · dated pink cabinets | Major | $15,000–50,000 |
| exterior siding · slight wear | Minor | $500–3,000 |
| Total estimated repair cost · 3 items | $30,500–103,000 |
Value-add ROI direction
- Both paint interior walls — enhances curb appeal and interior aesthetics ↑
- Both replace carpet — improves comfort and reduces maintenance ↑
- Both update kitchen cabinets — modernizes the space and increases appeal ↑
- Both update bathroom cabinets — modernizes the space and increases appeal ↑
- Both landscaping — enhances curb appeal and creates a more inviting environment ↑
ⓘ Cost ranges are severity-bucket heuristics (US national rule-of-thumb). Get contractor quotes + a written scope before underwriting a rehab budget.
Schools (NCES district)
- District
- Borrego Springs Unified
- NCES district ID
- 0605700
- Math proficiency
- 20% ▼ -6.00%
- Reading proficiency
- 35% ▼ -6.00%
- Median HH income
- $42,330
- Composite
- 26.31/100
- National rank
- #12684
- State rank
- #1120 of 1400 in CA
Livability — Borrego Springs
- Score
- 58/100
- State rank
- #712
- US rank
- #21334
Category grades
Schools grade is shown separately in the Schools card above.
Census & demographics
- Census place
- Borrego Springs, CA
- Population (ZIP)
- 3,030
Population outlook (San Diego County) Hauer SSP2
- Today (2025)
- 3,678,185 people
- By 2030
- 3,856,546 · +4.8%
- By 2040
- 4,171,407 · +13.4%
- By 2050
- 4,421,607 · +20.2%
- By 2075
- 4,831,599 · +31.4%
- By 2100
- 4,832,502 · +31.4%
Race, ethnicity, and origin ACS 2023
- Neighborhood character
- Predominantly White (66%)
- Race & ethnicity
- White 66% Hispanic / Latino 33% Two or more races 24%
- Hispanic origin (detail)
- Mexican 29%
- Common ancestry
- Lithuanian 10% Slovak 5% Scotch-Irish 1%
- Foreign-born
- 27% · Canada
- Languages at home
- 70% English-only · Spanish 30%
Political lean MEDSL · San Diego
- 2024 margin
- D (+16.8) · D 56.9% · R 40.1% · Other 2.9%
- 2008→2024 swing
- +6.6pp toward D · 2008: 10.2pp · 2024: 16.8pp
- All cycles
- 2024: D+16.8 2020: D+22.8 2016: D+17.8 2012: D+5.1 2008: D+10.2
Not yet ingested
- Civics
- —
Market trends
- HPI YoY
- ▼ -50.39%
- Current HPI
- 222.8196
- Rent YoY
- —
- Metro
- —
- State GDP YoY
- ▲ 3.21%
- F500 in state
- 116
Industry mix (Fortune 500 HQ in CA)
| Industry | F500 HQs | Revenue |
|---|---|---|
| Technology | 27 | $1,492B |
|
||
| Financial Services | 3 | $174B |
|
||
| Retail | 3 | $44B |
|
||
| Insurance | 3 | $26B |
|
||
| Media / Entertainment | 2 | $115B |
|
||
| Pharmaceuticals / Biotech | 2 | $62B |
|
||
Price history
+2.0% since first listed8 events — show timeline
- 2026-04-28 Price Changed $51,000 CRMLS
- 2026-02-08 Listed $58,888 CRMLS
- 2026-02-03 Price Changed $51,000 CRMLS
- 2026-02-03 Listing Removed — CRMLS
- 2025-12-29 Price Changed $56,000 CRMLS
- 2025-11-03 Listed $59,000 CRMLS
- 2025-10-23 Listing Removed — CRMLS
- 2025-10-23 Listed $50,000 CRMLS
Cash-flow waterfall
monthlySold comps — $/sqft
last 12 mo · ≤1 miLoading sold comps…